NNadir
NNadir's JournalA Study of the Evolution of HBV Virus By Sequencing Samples Up To 4000 Years Old.
The paper I will discuss in this post is this one: Ancient hepatitis B viruses from the Bronze Age to the Medieval period. (Eske Willerslev et al.Nature Volume 557, pages 418–423 (2018))
Recently I've become interested in the biophysical chemistry of nucleic acids, developing a somewhat amateurish understanding of the topic that despite being primitive is nonetheless awe inspiring. The development of modern sequencing techniques, stimulated by a Government investment - the human genome project set in motion by the Clinton administration - that ultimately stimulating great success in the private sector, has resulted in incredible scientific advances in this age of rising popular ignorance. It's probably as stimulating for biology, biochemistry, and medicine as the Government investment in the more popularly dramatic landings on the moon -set in motion by the Kennedy administration in response to developments in the Truman/Eisenhower era - were to the computer industry.
A terrifying aside:
The days of great government stimulated science are ending since primitive troglodytes - the result of a highly effective Russian attack on the United States applauded by people who nonetheless obscenely wrap themselves in American flags, claim moral superiority while kidnapping children and glorifying rape: George Orwell's "doublespeak" brought depressingly to life - have ended up controlling the government. Future generations will justifiably curse us for allowing this to pass.
They uniformly hate everything that's beautiful, a hatred of science being only one aspect.
Anyway. Enough. There still is beauty to be seen, and perhaps it will rise again. Anyway.
This interest in nucleic acids drew my attention to the paper cited at the outset of this post. It appears that scientists have sequenced the viral genome from samples thousands of years old.
From the introductory text:
...Approximately 257 million people are chronically infected and around 887,000 people died in 2015 owing to associated complications...
...Despite the prevalence and public health impact of HBV, its origin and evolution remain unclear6,7. Inference of HBV nucleotide substitution rates is complicated by the fact that the virus genome consists of four overlapping open reading frames8, and that mutation rates differ between phases of chronic infection9. Studies based on heterochronous sequences, sampled over a relatively short time period, find higher substitution rates, whereas rates estimated using external calibrations tend to be lower, leading to a wide range of estimated HBV substitution rates (7.72?×?10^?4–3.7?×?10^?6 substitutions per site per year)10,11,12...
The authors report that the virus exhibits 9 subtypes, and that efforts to attribute the distribution of these subtypes by tracing, for example, human migration give ambiguous results, as does the study of the viral sequences that infect other species affected by HBV, including other primates and animals like squirrels and bats.
Here's a figure from the text showing the distribution of some HPV subtypes:

The caption:
To get a better understanding of the history of this virus and the disease it causes, they do a remarkable thing as implied by the comment "b" in the caption: They examine viruses obtained from tissue samples that are hundreds and even thousands of years old.
A remark from the text:
Recombination is known to occur in HBV24. We found strong evidence that an ancient sequence (HBV-DA51) and an unknown parent recombined to form the ancient genotype A sequences. Although this cannot literally be the case owing to sample ages, the logical interpretation is that an ancestor of HBV-DA51 was involved in the recombination. The same recombination is also suggested for the two modern genotype A sequences that were included in the analysis. The ancient genotype B (HBV-DA45), a modern genotype B and two modern genotype C sequences were not similarly flagged, which suggests that the possible recombination occurred after genotypes A, B and C had diverged.
Recombination is a type of genetic modification which is known to take place naturally in a wide range of living things; however when this process is the result of human engineering, it generates a huge amount of protest from people like those benighted people who join organizations like Greenpeace; while it may be true that all Republican members of the House, Senate, and the current administration are anti-science troglodytes, it is not true that all anti-science troglodytes are Republican government office holders and their supporters.
The authors construct a putative evolutionary tree from there study of ancient DNA.
Here's a figure from the text:
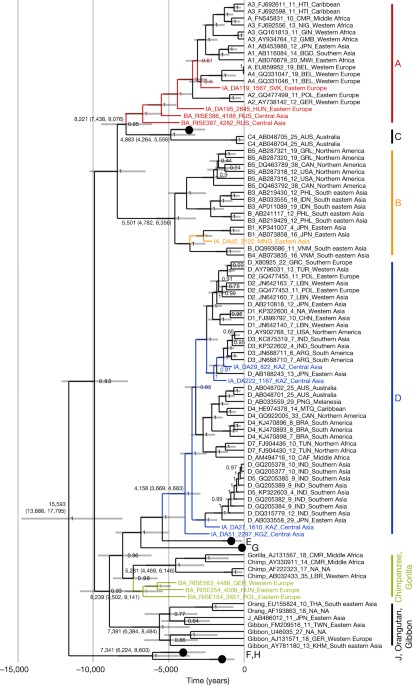
The caption:
The authors discuss their data thus:
...Sequences HBV-DA27, HBV-DA29, HBV-DA51 and HBV-DA222 phylogenetically group with the modern genotype D. They have high sequence identity (96.99–98.74%) with modern genotype D sequences (Extended Data Table 4a), and have the typical 33-nucleotide deletion in the preS1 region of the S gene, encoding the three HBV surface proteins8 (Table 2).
Sequences HBV-RISE154, HBV-RISE254 and HBV-RISE563 are in a sister relationship with the chimpanzee–gorilla HBV clade (Fig. 2). HBV-RISE254 and HBV-RISE563 have the same 33-nucleotide deletion in the preS1 sequence that is shared with non-human primate HBVs and human genotype D (Table 2). HBV-RISE563 does not encode a functional pre-core peptide (Table 2). On the basis of sequence similarity across the whole genome, HBV-RISE563 and HBV-RISE254 together might be classified as a new human HBV genotype that is extinct today, and HBV-RISE154 might possibly be classified as another
The authors have a very interesting discussion of the geography of their samples and the sequences found and identified in those regions, Central Asia, Hungary, Kazakhstan, India...etc etc.
The beauty of science is that unlike the increasingly common assertions of orthodoxy and dogma - no one should be so smug as to assume immunity - science can and does question itself; science is a process of questioning what one knows or thinks one knows.
Some closing text along these lines:
Scientists can use the words "probably misleading," whereas our political figures define what is deliberately misleading and now more obviously outright lies, as "truth," truth being in their case, again, in the Orwellian sense.
It's an interesting article, quite awe inspiring, and yet depressing in the sense that we face great risks if we do not stop these awful people occupying our government.
I despite these threats to our way of life and to our hope for progress, you are having a wonderful week.
Characterizing the Materials Composition and Recovery Potential from Waste Mobile Phones
The paper from the primary scientific literature that I will discuss today, is represented, in part, by the title of this post. The full title is:
Characterizing the Materials Composition and Recovery Potential from Waste Mobile Phones: A Comparative Evaluation of Cellular and Smart Phones (Singh et al ACS Sustainable Chem. Eng., 2018, 6 (10), pp 13016–13024.
Recently I drove up to my son's university - which is not far - to bring him the replacement cell phone his mother bought him in case the one he had finally failed; he jumped in a swimming pool with it just weeks after his brother jumped in the ocean with his. We were able to actually get the swimming pool version to work, by putting it under high vacuum after soaking it in deionized water. The same procedure did not work for the ocean water exposed cell phone.
The technicians at the store cheerfully switched the phones over.
Since I have an acute awareness of what's in their phone - I often get myself in a "peak oil tizzy" over indium, even if "peak oilism" has entirely lost credibility because it didn't happen fast enough to make sense in our party hearty and screw tomorrow world. (I personally can't wait for "peak oil," since I'm not so concerned that the oil will run out but that the place to dump oil waste - the planetary atmosphere and hydrosphere - has run out of space to safely contain it.
I asked the technician who was working on my phone if he could "recycle it" and he just laughed, since, he said he has no idea how to do that, and when he has a customer who insists he try, he usually ends up putting the phone in the trash.
Recycling is energy intensive, and depending on how its done, can have huge environmental, health and moral problems. Toxicology literature examining China is rife with these consequences.
However, with vast quantities of cheap, clean energy I believe it's possible and desirable.
The paper cited at the beginning here does a wonderful job telling us what's in cell phones.
First it's always good to begin with scale; too often our lies to ourselves begin with representing some lab scale thing as if it were an industrial solution. The scale of cell phones, according to the part I've put in bold from the introductory text is mind boggling.
A mobile phone is a portable hand-held device that can make and receive calls over a radio frequency link within a telephone service area. A mobile phone that contains a fixed set of functions such as voice calling, text messaging, and web browsing is generally referred to as a feature or cellular phone; a mobile phone that contains a number of distinguishing features and offers greatly advanced computing capabilities is referred to as a smart phone.(5) The volume of waste mobile phones is growing rapidly all over the world, while the collection and recycling rates of these waste devices are insignificant compared to other waste electrical appliances.(3,6?8) Waste mobile phones typically consist of many materials such as plastic, printed circuit boards (PCBs, which contain most of the precious and toxic metals), screens, magnets, vibrators, LED back lights, steel, and batteries, with a complex chemical composition.(9) In the past few years, various researchers and research institutions have published numerous research studies, white papers, and reports on the metal composition of mobile phones.(6,10?14) However, no comprehensive evaluation of the precise components of these devices, nor any comparative study of the various models of cellular and smart phones and their metal compositions, is readily available.
The authors note that a lot of precious materials go into making these devices, reporting data indicating that the world's electronics industry consumes more than 850 metric tons of gold, 6500 tons of silver and almost 30 tons of palladium annually.
Gold mining, in particular, is a very noxious business: think mercury, or cyanide or both.
Anyway, the authors provide us with a wonderful graphic showing where the stuff in portable phones are located:

Not all of these materials are found in "green" solar cells, by the way, but many are, which is why - speaking only for myself - I have a jaundiced view of the words "green" and "renewable" attached to solar cells. They require far more mass than cell phones and for that matter computers, meaning that their scale will dwarf the already intractable electronic waste scale.
By the way PCB here does not refer to the highly toxic polychlorinated biphenyls, but rather to "printed circuit boards" (Many electronic devices do contain PBDE's - polybrominated diphenylethers - as flame retardants. Measurements have been made showing huge concentrations of this stuff in Chinese children; China's banning imported "green" electronic components to be recycled.
This graphic, similar to the first, adds metal content to the components.

The caption:
The grind the cell phones up to analyze them:

Here's where he finds the metals are:

The caption:
The mass of precious metals in cell phones.

The caption:
Figure 5. Precious metal content in waste cellular and smart phones’ PCBs, manufactured between 2001 and 2015. (a) Precious metal content in waste cell phones. (b) Precious metal content in waste smart phones.
While these gold mg/phone concentrations seem low, keep in mind that ores from which gold is mine - again using very dirty processes - are also at a similar level of concentration.
The authors comment:
The demand for precious metals such as gold, silver, and palladium has been increasing rapidly with the increasing consumption in the electronics industry around the world. Figure 6(a) and (b) show the precious metal consumption trends in waste cellular and smart phones from 2001 to 2015. These results reveal that the consumption of precious metals has been constantly increasing in smart phones, while in cellular phones the contents of gold and palladium have remained almost unchanged while the silver content has shown a rapidly increasing trend. The average price trends of the precious metals from 2000 to 2017 are shown in Figure 6(c) (data attached in Supporting Information Table S2). This figure shows that the prices of all the precious metals are increasing, although gold and silver reached their peaks in 2012 and then resumed normal trends in 2013, possibly because of the global economic recession or the gold mining restrictions in some countries. Nevertheless, overall price trends are increasing along with the increasing demand for precious metals in metal-consuming industries. For example, approximately 861 tonnes of gold, 6619 tonnes of silver, and 29 tonnes of palladium are being consumed by the electronic industries annually.(18) However, these amounts of precious metals represent only 10 to 15% of total global production, while the recovery rate for these precious metals from all end-of-life electronic devices is less than 10%, and in the case of mobile phones, it is around 2 to 5%, and sometimes even less. Most of the precious metals in waste mobile phones are still encased somewhere in individual households or storage yards
They produce another graphic relevant to their discussion:
The caption:
The authors conclude in part:
It is high time for waste mobile phones to get proper attention from government and the public, to increase awareness about their recycling value and the hazardous toxins they create when improperly managed. Not only are there serious environmental and human health effects from improper management waste mobile phones, but recycling the phones also has real economic value.(48,49)
What they say here probably goes for other electronic waste, but note it is more expensive, and energy intensive, to do this safely as opposed to declaring ourselves "green" because "we" "recycle" without regard to the conditions and health of the impoverished people who make us "green."
I have to go.
Have a pleasant work week.
Nature Communications: "Europe's 'Renewable Energy' Policy Likely to Destroy It's Forests."
In 1307, Edward I banned the combustion of coal in England, thus enacting the first known air pollution law in history. By the 16th century it was necessary to repeal the law because England had basically run out of wood to burn: Attitudes and Responses Towards Air Pollution in Medieval England (Brimblecomb, Journal of the Air Pollution Control Association, 26:10, 941-945)
As they say, "Plus ça change…" or "Those who forget history..."
The current article is in the scientific journal Nature Communications.
Europe’s renewable energy directive poised to harm global forests (Searchinger et al. Nature Communications Volume 9, Article number: 3741 (2018))
In January of this year, even as the Parliament of the European Union admirably voted to double Europe’s 2015 renewable energy levels by 2030, it also voted to allow countries, power plants and factories to claim that cutting down trees just to burn them for energy fully qualifies as low-carbon, renewable energy. It did so against the written advice of almost 800 scientists that this policy would accelerate climate change1. This Renewable Energy Directive (RED) is now finalized...
...Over the last decade, however, due to similar flaws in the 2008 RED, Europe has expanded its use of wood harvested to burn directly for energy, much from U.S. and Canadian forests in the form of wood pellets. Contrary to repeated claims, almost 90% of these wood pellets come from the main stems of trees, mostly of pulpwood quality, or from sawdust otherwise used for wood products5.
Greenhouse gas effects of burning wood
Unlike wood wastes, harvesting additional wood just for burning is likely to increase carbon in the atmosphere for decades to centuries6,7,8,9,10,11,12,13,14,15,16. This effect results from the fact that wood is a carbon-based fuel whose harvest and use are inefficient from a greenhouse gas (GHG) perspective. Typically, around one third or more of each harvested tree is contained in roots and small branches that are properly left in the forest to protect soils but that decompose and release carbon. Wood that reaches a power plant can displace fossil emissions but per kWh of electricity typically emits 1.5x the CO2 of coal and 3x the CO2 of natural gas because of wood’s carbon bonds, water content (Table 2.2 of ref. 17) and lower burning temperature (and pelletizing wood provides no net advantages)
The full paper is open sourced and you can read it yourself if you care to do so.
Here's another link to the subject from Princeton University: Europe’s policy to treat wood as low-carbon fuel poised to harm global forests
Don't worry, be happy. Split wood, not atoms! Go green, or um, ash and mud colored anyway...
In case you thought that the United States was the only insane place in the world, I thought I'd offer this.
Have a happy Sunday tomorrow.
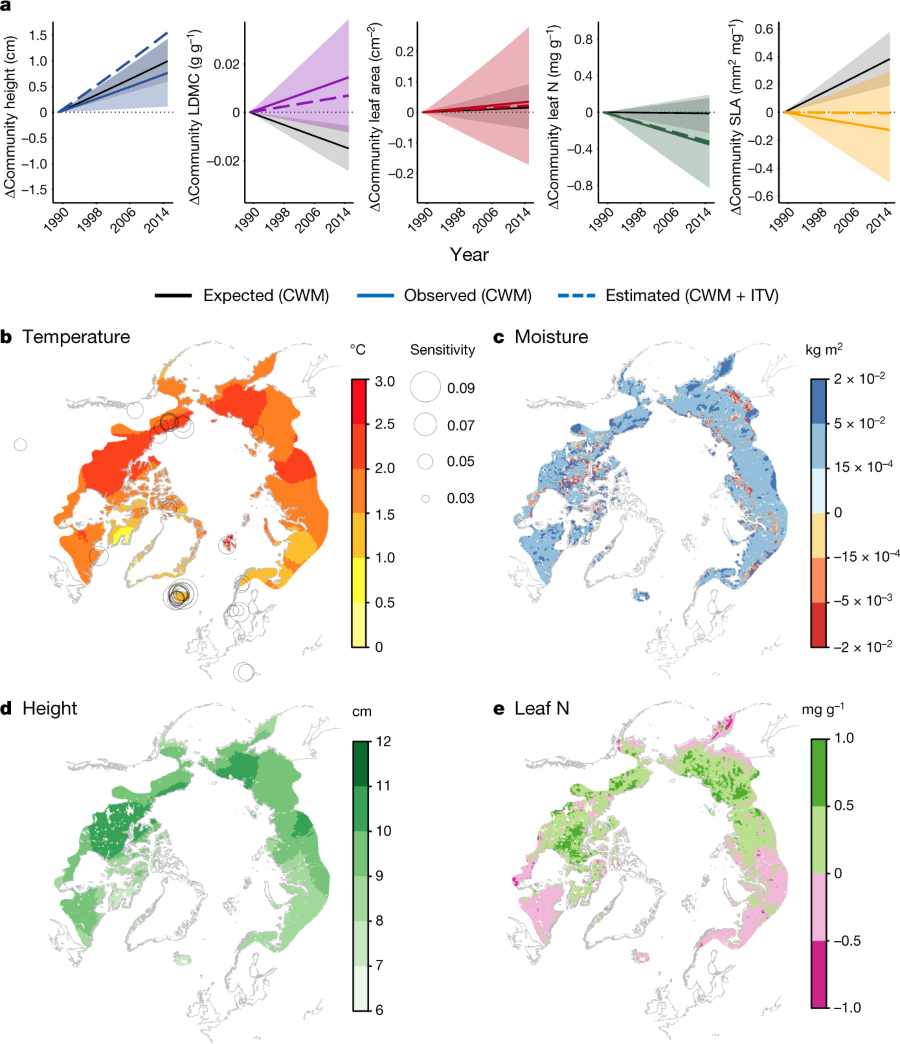
Plant functional trait change across a warming tundra biome.
The paper from the primary scientific literature I will discuss briefly in this post is this one: Plant functional trait change across a warming tundra biome. (Anne D. Bjorkman et al Nature Volume 562, pages 57–62 (2018).
An excerpt from the introduction:
The "et al" in the author list here is rather large; this is the work of a large team of scientists, as the work demanded:
That's cool, scientists wandering across the tundra all over the world to make 56,000 measurements.
The paper is rather long, as one might expect, and regrettably it seems not to be open sourced. Someone who wishes to read it must either travel to a library or else take advantage of Nature's current quite reasonable (and wonderful) reduced price subscription offer which can be located on the internet. Here's some pictures from the paper, though:
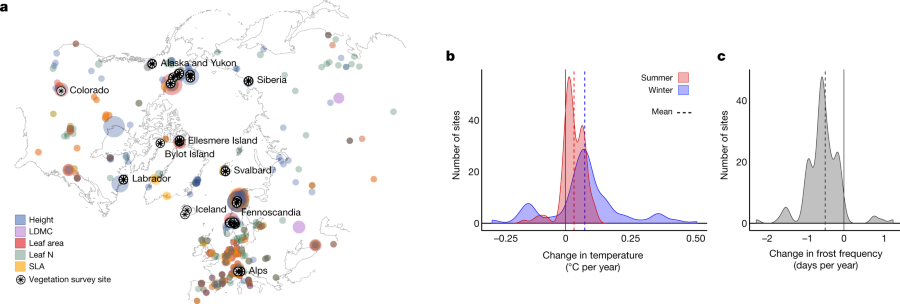
The caption:
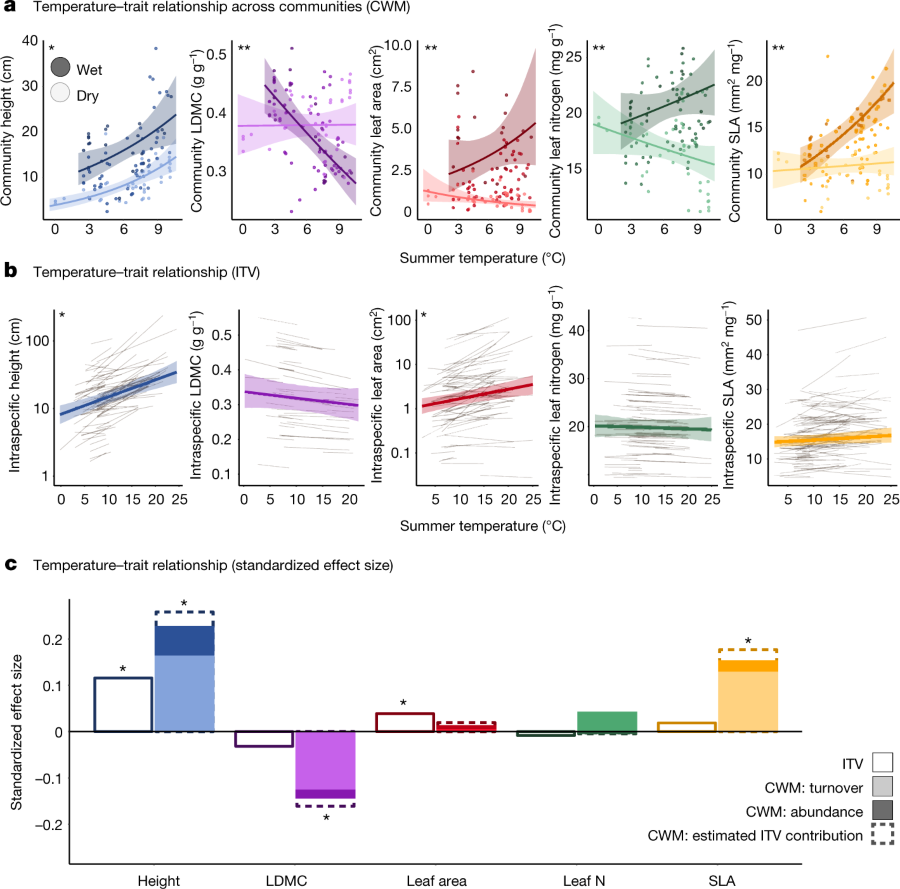
The caption, where "IVT" is intraspecific variation; "CWM" is community-weighted trait means ;"LDMC" leaf dry matter content:
More graphical data:
The caption:
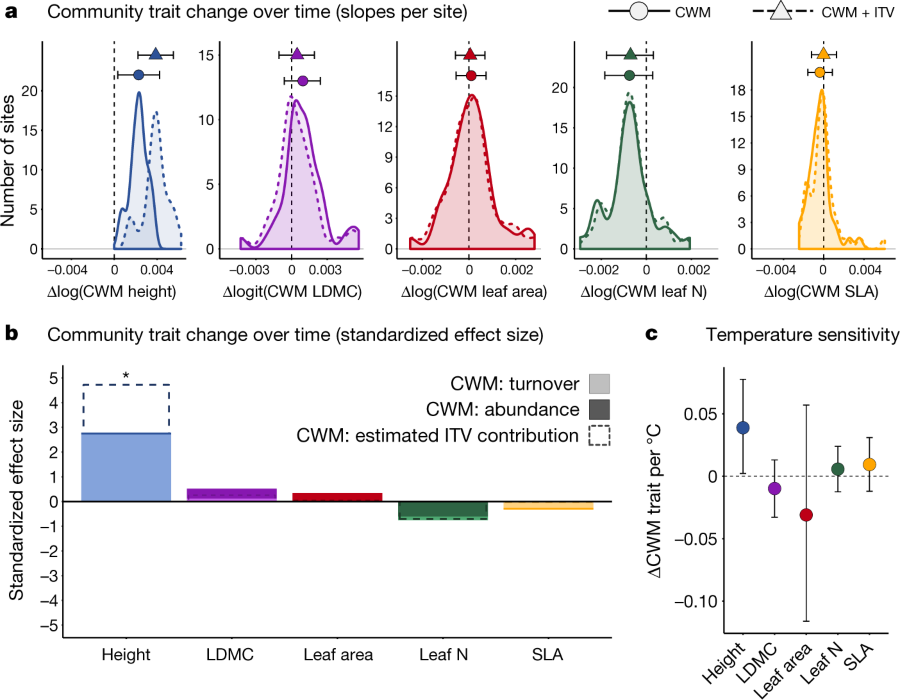
The caption:
Some remarks on plant height:
The caption:
The authors describe possible positive and negative feedbacks associated with our inability to address the rising tragedy of fossil fuels:
We need to understand this stuff, but we are in no place to change what it happening, particularly with the international will to celebrate ignorance, racism, rape and ethical vapidity, which prevents us from doing what might have been done. With no reference to my screen name, we are at the nadir, or at least one hopes so.
Nature - and here I'm not referring to the journal but to reality - is affected by politics, of course, but it will do what it will do independent of politics. Politicians can destroy the world by denial, inaction, or lies - and our contempt for the future suggests this is a real possibility - but they can not pass laws to demand that rain or snow fall, or that winds blow or don't blow, or food grows or doesn't grow.
It is easy to criticize our current Congress and it's now publicly and openly stated fondness for rape and for lies - as well as the administration's hatred of children and in fact, all future generations - but frankly, as an advocate of nuclear energy which I regard as the only technology that might work to address climate change - nuclear energy is often demonized by what I regard as "ersatz environmentalists" who complain it's not perfect (and it isn't) as if anything was - in my opinion we on the left are not innocent in the creation of the situation in the Tundra and elsewhere around the world, in every space the atmosphere touches.
"We" seem to think the solution is involved with Elon Musk's stupid electric car for billionaires and millionaires and other consumer junk like that, "all new stuff."
It isn't.
I hope you will have a pleasant and rewarding weekend.
The degrees of freedom are zero at this point.
While power point presentations have, well, power, the days of the professor with chalk and a blackboard had their own magnificence.
For fun, go back to the beginning. A fun basic lecture.
Another Discussion of Biomass Derived Anodes to Replace Petroleum Coke in Aluminum Production.
The paper I will discuss in this post is this one: Renewable Biomass-Derived Coke with Texture Suitable for Aluminum Smelting Anodes (Yaseen Elkasabi*† , Hans Darmstadt‡, and Akwasi A. Boateng, ACS Sustainable Chem. Eng., 2018, 6 (10), pp 13324–13331)
This is a follow up to recent post in this space, Can Biocoke Address the Anode CO2 Problem (Owing to Petroleum Coke) for Aluminum Production?
I don't buy into the pop enthusiasm for so called "renewable energy," since I am aware of the demonstrated fact - the demonstration being the concentration of carbon dioxide in the planetary atmosphere rising at an unprecedented rate despite the "investment" of trillions of dollars on this pixilated adventure - that so called "renewable energy" has not worked, is not working and will not work to address climate change.
Thus, the subtext of my previous post was an inferential attack on this pop enthusiasm, since I noted that the construction of so called "renewable energy" infrastructure is metal (and, just as bad, concrete intensive) and that two of the most important structural metals, specifically steel and aluminum, both depend on access to coke made from dangerous fossil fuels, coal based coke in the case of steel, petroleum based coke in the case of aluminum.
Ironically I am somewhat less hostile to what is clearly the most dangerous form of so called "renewable energy," biofuels than I am to wind and solar, even though biomass combustion is responsible for about half of the seven million air pollution deaths each year. (Recent publications however suggest that while the overall death toll from air pollution is rising significantly, both the fraction caused by biomass and the absolute numbers associated with biomass related deaths are falling, probably owing to improvements in stoves in impoverished areas. Impoverished areas are areas where "renewable energy" never really went away after largely being abandoned by the wealthier population beginning in the early 19th century, when the invention of steam engines made it possible to drain coal mines. Pretty much all of the increasing death toll related to air pollution derives from the rising use of dangerous fossil fuels.)
The reason that I'm less hostile to biomass than I am to wind and solar is that I believe it is technologically feasible to utilize (some) biomass to capture some of the dangerous fossil fuel waste carbon dioxide from our currently unrestrictedly utilized waste dump for it, the planetary atmosphere.
Although abandoning the "renewables will save us" fantasy will prevent massive surges in the demand for steel and aluminum - at what will be in my view an unacceptable environmental cost - the abandonment will not in any way eliminate the demand for steel and aluminum. The best it can do is to keep it steady.
By use of a well known and sometimes industrial chemical reaction, the Boudouard reaction, I have actually come to believe that it might be possible to run aluminum plants (with their electrical demand coming from nuclear energy, as well as thermal energy for the reduction of carbon dioxide by thermochemical splitting) as carbon negative enterprise. I referred obliquely to this in my earlier post on this subject.
In that post I discussed the use of carbon anodes containing a fraction of biochar, wood thermally decomposed by heating in the absence of oxygen to make biocarbon that could be mixed into petroleum coke to reduce the carbon impact of aluminum production.
The paper cited at the outset of this post, by contrast, uses bio-oil to make carbon anodes.
Bio-oils are made by the destructive distillation of biomass in the absence of oxygen. Since biomass contains largely cellulosic polymers made up of chains of sugars and lignins, largely ether linked catecholic aromatics, bio oils tend to contain a fair amount of oxygen. Although they can be utilized in combustion, including combustion in engines, they tend not to be very stable. They oxidize to organic acids which not only burn poorly, but are prone to take up water as well as to be corrosive.
The current paper suggests a better use for biooils.
From the introduction to the paper:
Although proposed in the literature,(8) use of biomass char in electrodes is not performed commercially. According to laboratory studies,(9,10) partial replacement of petroleum coke by biomass char resulted in poorer anode properties. The anode density decreased, whereas anode resistivity and oxidation increased. This was attributed to low char bulk densities and to the presence of inorganic compounds (such as Na and K) which catalyze anode oxidation. While methods exist for removal of inorganic compounds from biomass char,(11) the low bulk density remains an issue. Pressurized pyrolysis, in a manner similar to ablative reactors, can increase the char bulk density,(12) but costs have yet to be determined. Furthermore, biomass char usually has an amorphous texture.(13) Anodes containing fillers with these textures have a high coefficient of thermal expansion (CTE),(14) making them susceptible to thermal shock cracking.(15) In anodes, isotropic coke can only be used as a blend component, but not exclusively.(16) It can be summarized that the poor performance of biomass char in anodes has several reasons: inorganic compounds present in biomass report to the char and during carbonization, the developing char does not pass through a liquid phase required for the development of the desired graphite-like, anisotropic texture...
The authors propose to use bio-oils prepared pyrolytically from several sources, guayle (creosote bushes), willow, switch grass, hardwood and - how ironic is this - horseshit, which they more politely euphemize as "horse litter."
Briefly, they heat their biomass in a fluidized sand bath at 500C in a stream of flowing nitrogen.
The oils distill out, and then are heated under argon at temperatures between 200 and 300 C, then "coked" in an oven at 900C.
It is found that the resulting cokes contain considerable elemental impurities. These can and do end up in the aluminum prepared in the cryolite electrolyzer utilized in the Hall Process, and can impact the quality of the aluminum.
Elements found in the biomass are calcium, vanadium, sodium, silicon and nickel at levels in the hundreds of parts per million, and zinc, manganese and titanium at concentrations an order of magnitude lower.
Potassium is also prominent in hardwood sources.
Horseshit contains large amounts of phosphorous, and the authors thus reject its use, since phosphorous content in anodes leads to higher electricity costs and in aluminum degrades its properties.
Alkali metals like potassium and calcium are said to increase the rate of oxidation of anodes and thus are undesirable, as is calcium - although calcium chloride is the working electrolyte in the FFC process for electrolytic titanium reduction (instead of croylite in the Hall process.)
Here's some pictures of the anode materials:

The caption:

The caption:

The caption:
Like the authors who produced the subject paper in my last post on this subject, these authors actually make electrodes that are only partially biological with respect to the carbon in the anodes.

The caption:
Although the authors here do not make a large enough sample to perform the standard tests for anodes used in the aluminum industry, the do some electrical measurements, such as "I V" curves, current vs. voltage:

The caption:
For some reason this graph lacks a key. It will probably show up in a "corrections" paper in this journal in the future.
The authors thus conclude:
The amount of aluminum produced by humanity is huge. I personally hope that this materials science effort will continue, since it is increasingly exigent to ban the use of dangerous fossil fuels and switch to nuclear energy.
This sort of thing offers some small hope for the future.
I wish you a pleasant day tomorrow.
Profile Information
Gender: MaleCurrent location: New Jersey
Member since: 2002
Number of posts: 33,512