NNadir
NNadir's JournalConstraints on global mean sea level during Pliocene warmth: Sea level was 16-17 meters higher.
The paper I'll discuss is this one: Constraints on global mean sea level during Pliocene warmth (Onac, et al, Nature 574, 233–236 (2019)).
Currently, carbon dioxide accumulations are the highest recorded ever (although the record extends only to the mid 20th century), about 2.4 ppm per year and rising. We are currently reaching (or have reached) the annual minimum that comes every September. (It may end up being in October this year as the Northern Hemisphere's summer is extending with climate change.) The weekly low for this year was recorded at the Mauna Loa Carbon Dioxide Observatory for the week ending September 9, 2019, a reading of 407.96 ppm. The high for this year was recorded during the week ending May 12, 2019, when the reading was 415.39 ppm, the highest value ever recorded at Mauna Loa.
At 2.4 ppm per year, our current rising rate of increase, we should see 450 ppm in about 15 years, "by 2035" in the kind of language Greenpeace has been using for the last 50 years to describe when we will all live in a "renewable energy" nirvana powered solely be wind, solar, and all be driving electric cars, although in the old days, when I was a kid, that renewable energy nirvana was supposed to arrive "by 2000."
It didn't, but who's counting? We should do things on a faith basis, no, and only read Greenpeace "studies," because they always make you feel warm and fuzzy.
Warm, definitely. It's getting very hot these days. Fuzzy? I don't know. How does "fuzzy" feel?
The reason that this 450 number sticks in my mind, other than the 350 number about which Bill McKibben likes to talk, is the cited paper refers to a period, the Pliocene, which was relatively recent in geological history when carbon dioxide briefly was above 450 ppm. Let me jump the gun a little and post a figure from the paper before excerpting any text. Here it is, figure 3:

The caption:
Some text from the abstract, which should be open sourced:
From the paper's introduction:
Oxygen isotope ratios from benthic foraminifera10 paired with deep ocean temperature estimates have been used to approximate ice-volume-equivalent GMSL changes over the Pliocene11,12. While invaluable, these approaches are limited by uncertainties in the methodology and a number of factors (for example, post-burial diagenesis, long-term changes in seawater chemistry and salinity) that are poorly constrained and may bias the sea-level estimates3. Field mapping of palaeoshorelines has been a complementary approach...
A few other means of estimating sea level height are given. The authors however choose a new approach:
"Phereatic overgrowths on speleotherms" refer to deposits that form on stalactites and stalagmites when they go under water.
Table 1:

Some other pictures in the paper:
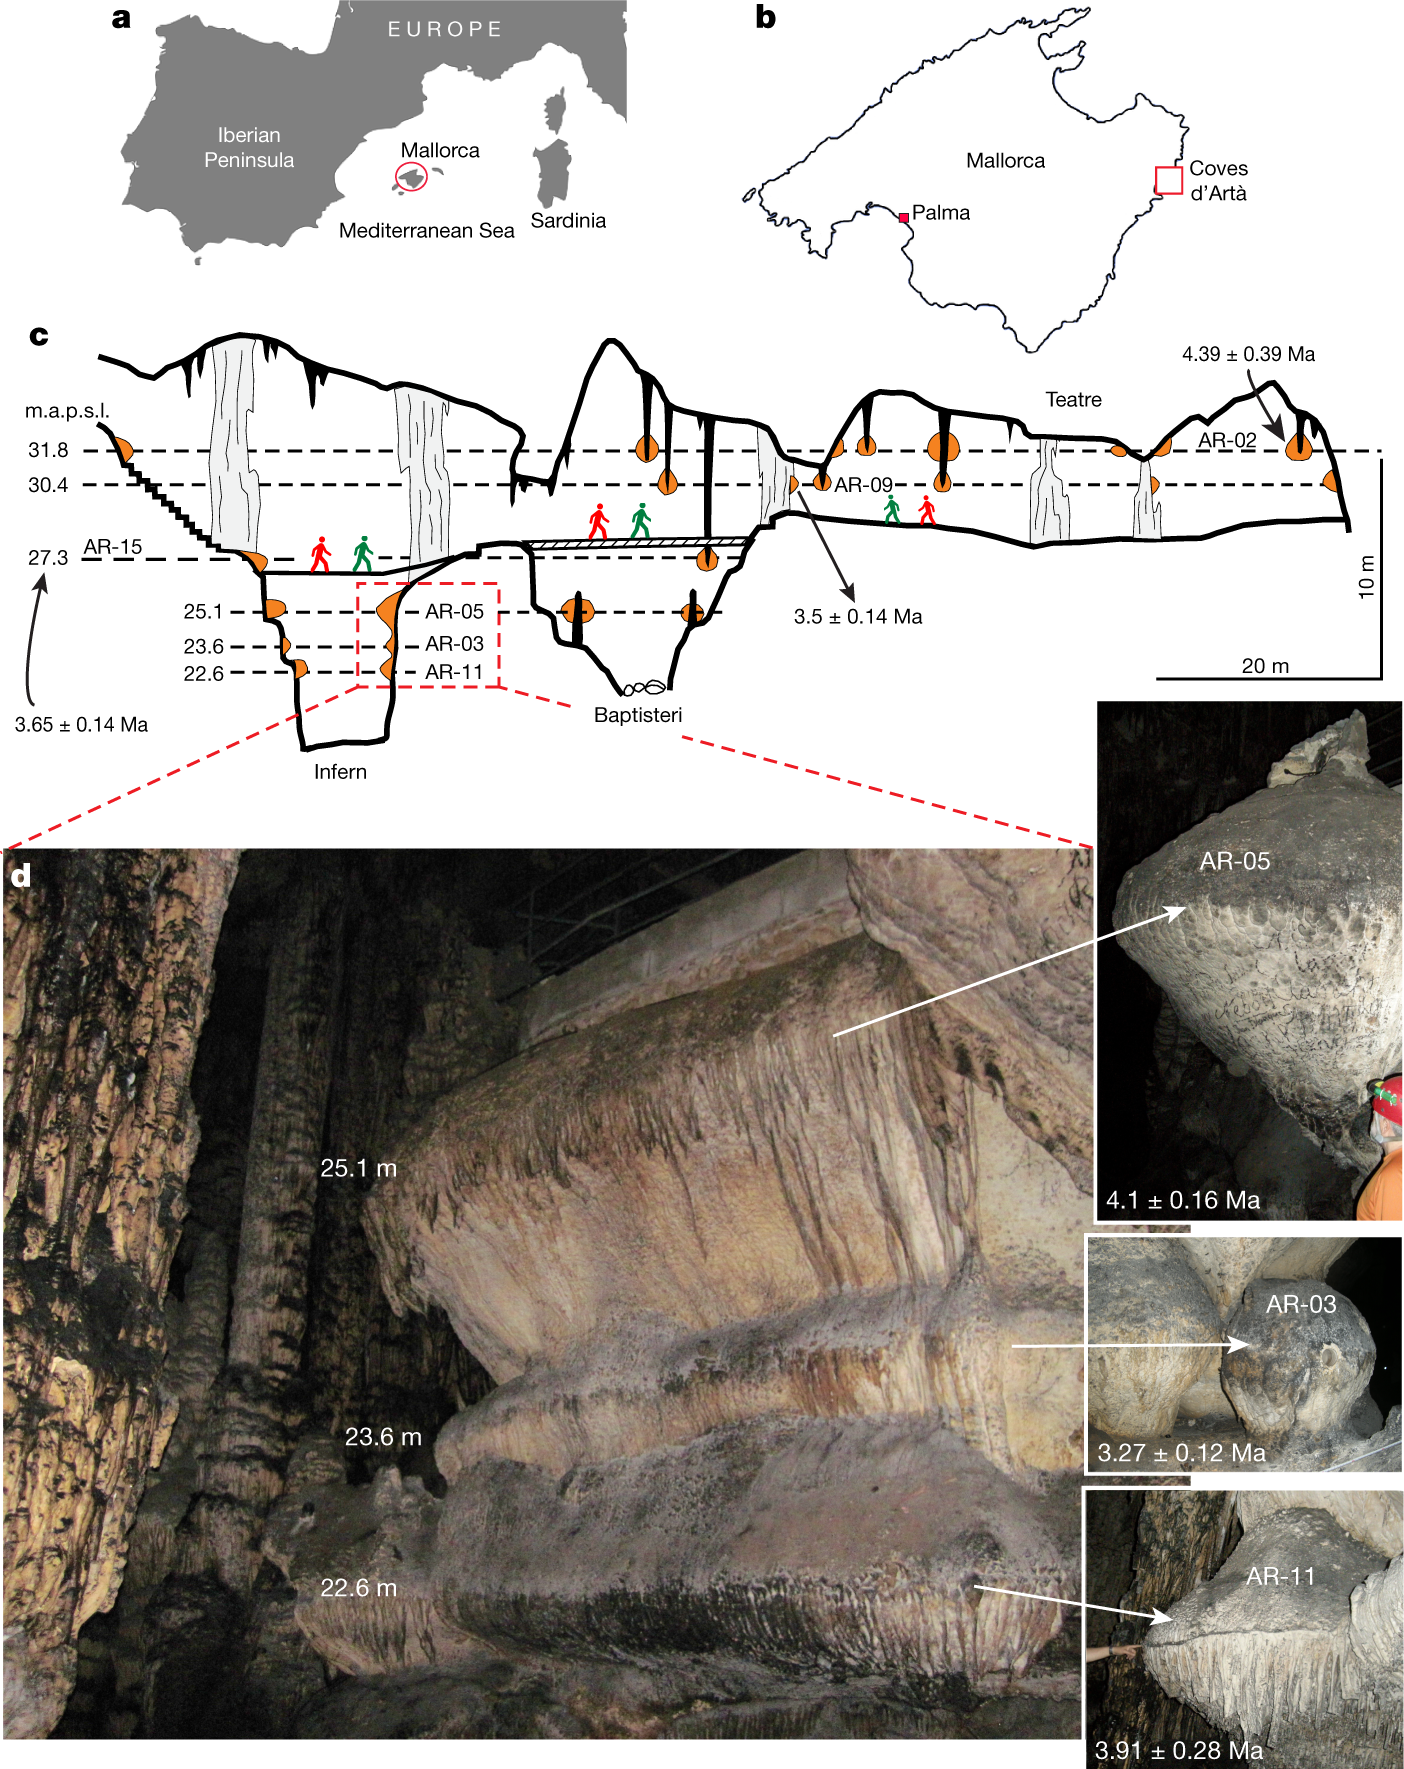
The caption:
The caption:
Figure 3 was produced here earlier.
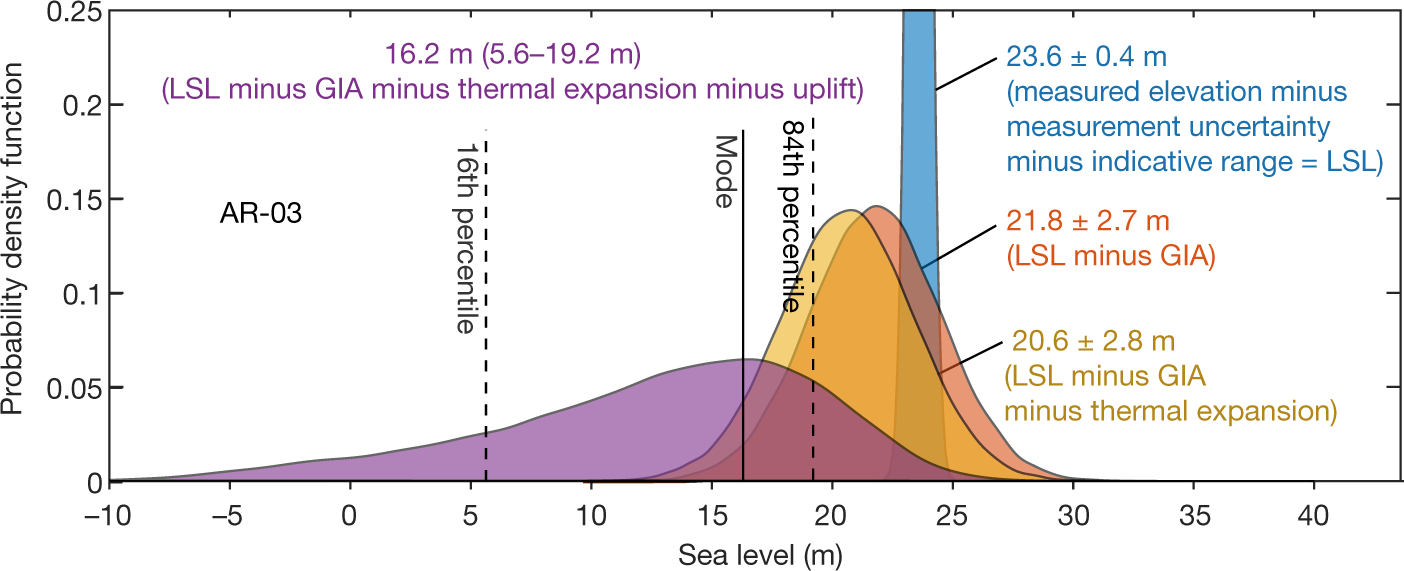
An excerpt of the conclusion:
"m.a.p.s.l" is an unnecessary abbreviation of "meters above present sea level."
Don't worry. Be happy. It's not your problem. You'll be dead "by 2100" just like the people who bet the planet on so called "renewable energy," but happily will be dead when future generations will almost certainly not be able to achieve, because we have insisted blithely, that it will be easy for them to do what we could not do ourselves.
Most likely, the reality is that future generations, much as was the case for all generations before the 19th century will actually experience living by "renewable energy" the way those generations did: Then, as in the future I predict - may I be proved wrong - even more so than today, the bulk of humanity lived short, miserable lives of dire poverty.
History will not forgive us, nor should it.
I hope you enjoy the upcoming weekend.
Tuning element distribution, structure and properties by composition in high-entropy alloys.
The paper I'll discuss in this post is this one: Tuning element distribution, structure and properties by composition in high-entropy alloys (Zhu et al, Nature volume 574, pages 223–227 (2019))
Recently in this space, I referred to the presence of the relatively rare (but extremely useful) element palladium, a constituent of used nuclear fuel: Palladium is a fission product. In that post I referred to use of the element in thermoelectric devices, which convert heat directly into electricity, as in famous deep space spacecraft like Voyager, New Horizons and the spectacularly successful Cassini mission. I argue that similar (more efficient) thermoelectric devices can raise the thermodynamic efficiency of nuclear plants, thus accelerating the ease of addressing climate change by the only feasible approach to do so.
As of this writing, the price of palladium is about $54,000/kg at a kg scale.
Non-radioactive palladium can be isolated only from rapidly reprocessed nuclear fuels or those that are continuously reprocessed, which is possible for fluid phased reactors, such as those with salt based fuels or (my personal favorite because of extremely high neutronic efficiency) liquid metal fuels like the LAMPRE reactor which operated in the early 1960's at Los Alamos using a plutonium/iron eutectic. (Other plutonium eutectics are known.)
Separation would involve exploiting the volatility of ruthenium tetraoxide generated from extracted metal samples, and allowing the obtained ruthenium's 106 isotope to decay and harvesting the non-radioactive palladium-106 daughter.
Older nuclear fuels will contain the radioactive palladium isotope Pd-107, which is an isotope representing low risk, since it is a low energy pure ?- with no penetrating radiation, that will be diluted by, Pd-104, Pd-105, Pd-106, Pd-108, and Pd-110. This should allow for wide use of this palladium, if and only if the stupidity of some of the less educated, i.e. ignorant, people responsible for 7 million deaths per year from dangerous fossil fuel and biomass combustion waste is rejected in an effort to save humanity from itself.
(The worst kind of ignorance is deliberate ignorance expressed with a complete lack of shame and with some force, that is, Trumpian ignorance. I have been sparing myself from engaging people here who represent exemplars of this kind of ignorance. As this is an issue on a national scale, I often reflect on a lecture I saw by the neuroscientist - and anti-gerrymandering activist - Sam Wang in which he claimed that the best way to give lies credibility is to repeat and report them while trying to discredit them. This may, in my opinion, be true; it's at least worthy of consideration. I wish our national media believed that. I'm personally as tired of hearing drooled drivel from the so called "President of the United States" as I am of hearing the drivel of anti-nukes.)
Anyway, isotopes decaying either to stable palladium and including radioactive Pd-107, constitute, in direct fission, about 21.8% of fast fission events in plutonium-239, the fast fission of plutonium being the most desirable in terms of sustainability and foreclosing all energy mining (including uranium mining) for several centuries using uranium already mined. (The similar use of thorium already mined and dumped by the lanthanide industry might extend this period for additional centuries.)
Note this neglects neutron capture reactions, which depend in turn on the capture cross sections of the isotopes in the fast spectrum, but is useful as a first approximation.
World Energy Demand as of 2017, according to the 2018 World Energy Outlook put out by the EIA - the 2019 edition should come out soon - was 584.98 exajoules. To eliminate all energy mining by plutonium utilization would require the complete fission of about 7,300 tons of plutonium per year, and produce, therefore, about 1,500 tons of palladium per year. The availability of this element in such quantities would of course reduce prices and make use of the element more available, but at current prices, just for arguments sake, the value of this palladium would be about 82 billion dollars.
As for the radioactivity, neglecting neutron capture, and also neglecting the option of separating the 106 isomer, about 14.7% of the total palladium would be radioactive palladium-107. The long half life of Pd-107, 4.5 million years, yields a fairly low specific activity, about 0.4 millicuries per gram for the pure isotope, and, representing 14.7% of the total palladium, even less, 0.075 millicuries, or about 75 microcuries. As a pure beta emitter with low energy beta (0.987 keV) in a self shielding situation, it is hard to imagine than an alloy containing this palladium would exhibit any health risk to persons using it as a structural alloy, which is what the cited paper is all about.
Note that the alloy discussed therein would represent even further dilution of any Pd-107 related radioactivity, to even more meaningless levels, with the specific activities listed above reduced by a factor of five.
From the abstract:
...These deformation mechanisms in the CrFeCoNiPd alloy, which differ markedly from those in the Cantor alloy and other face-centred cubic high-entropy alloys, are promoted by pronounced fluctuations in composition and an increase in stacking-fault energy, leading to higher yield strength without compromising strain hardening and tensile ductility. Mapping atomic-scale element distributions opens opportunities for understanding chemical structures and thus providing a basis for tuning composition and atomic configurations to obtain outstanding mechanical properties.
(The abstract is probably open sourced.)
From the full paper's introduction:
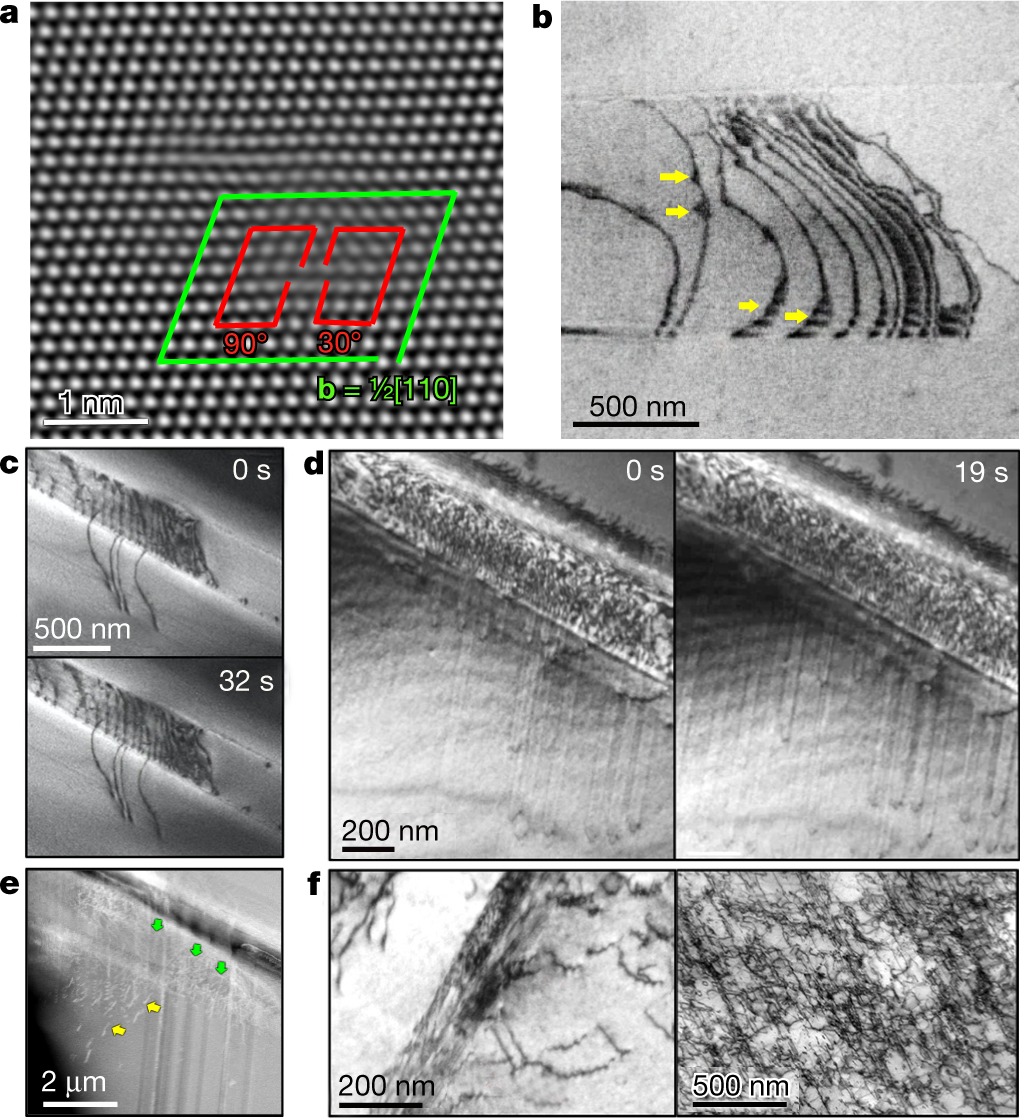
Some pictures from the paper:
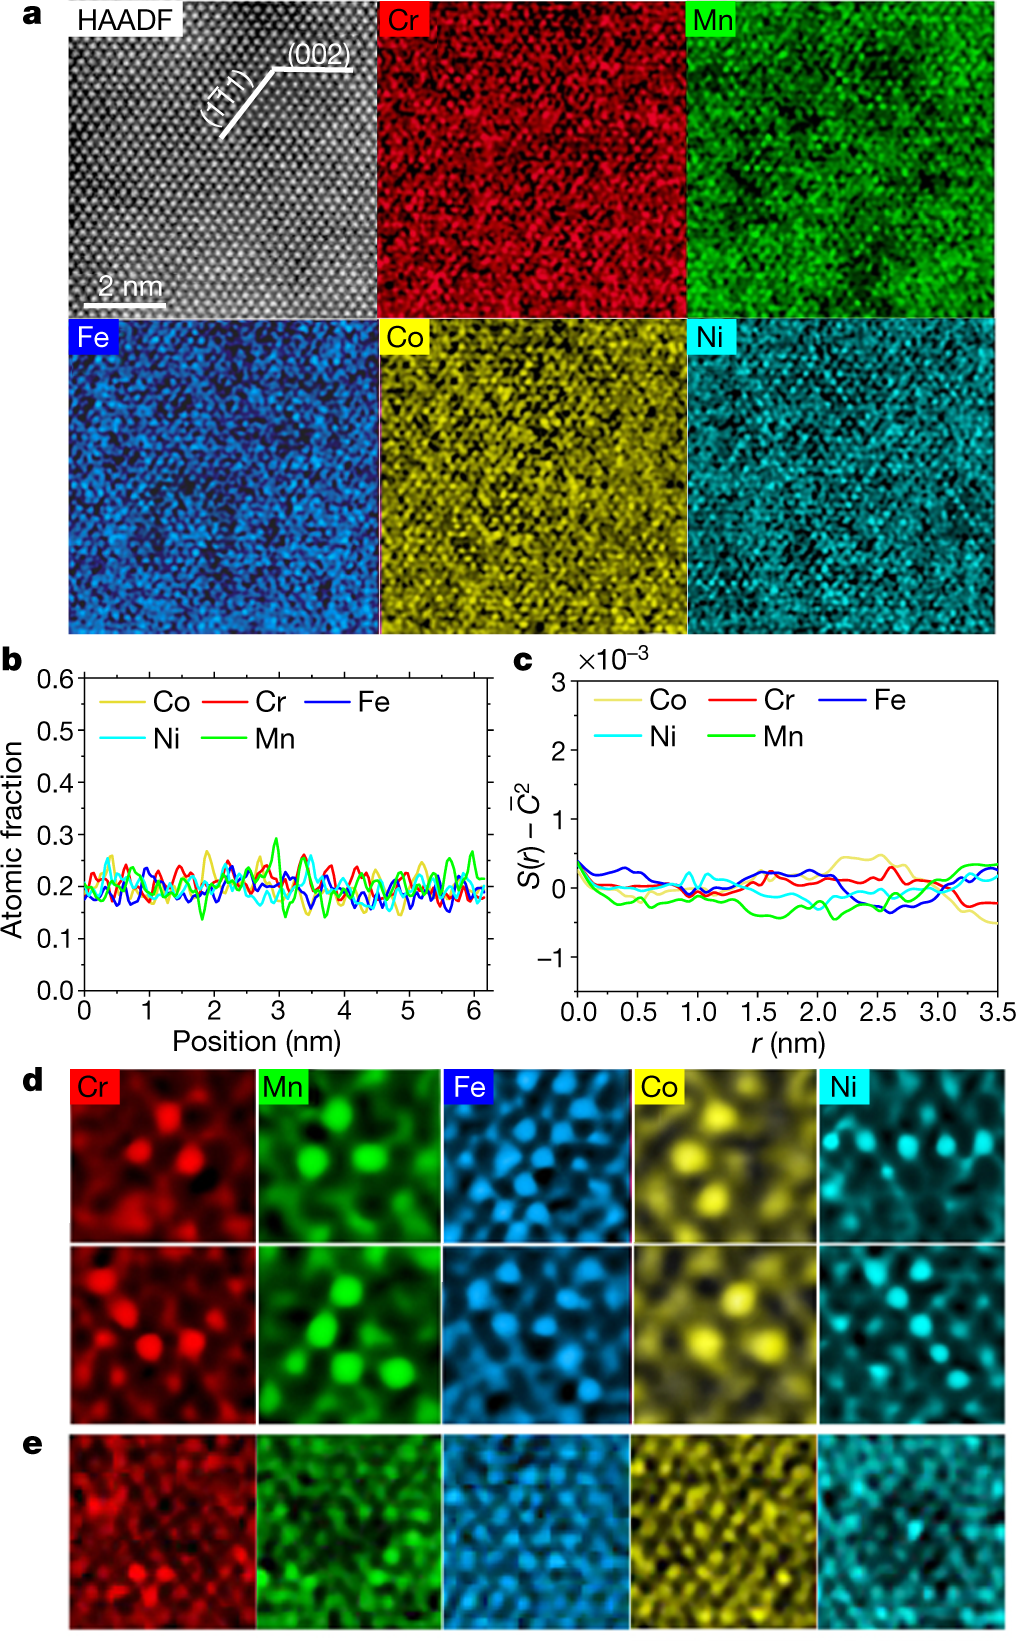
The caption:
HAADF refers to atomic-resolution high-angle annular dark field transmission electron microscopy (TEM), a techiniq my son about which probably knows the details. (I don't.) EDS refers to Electron Dispersive Spectroscopy.
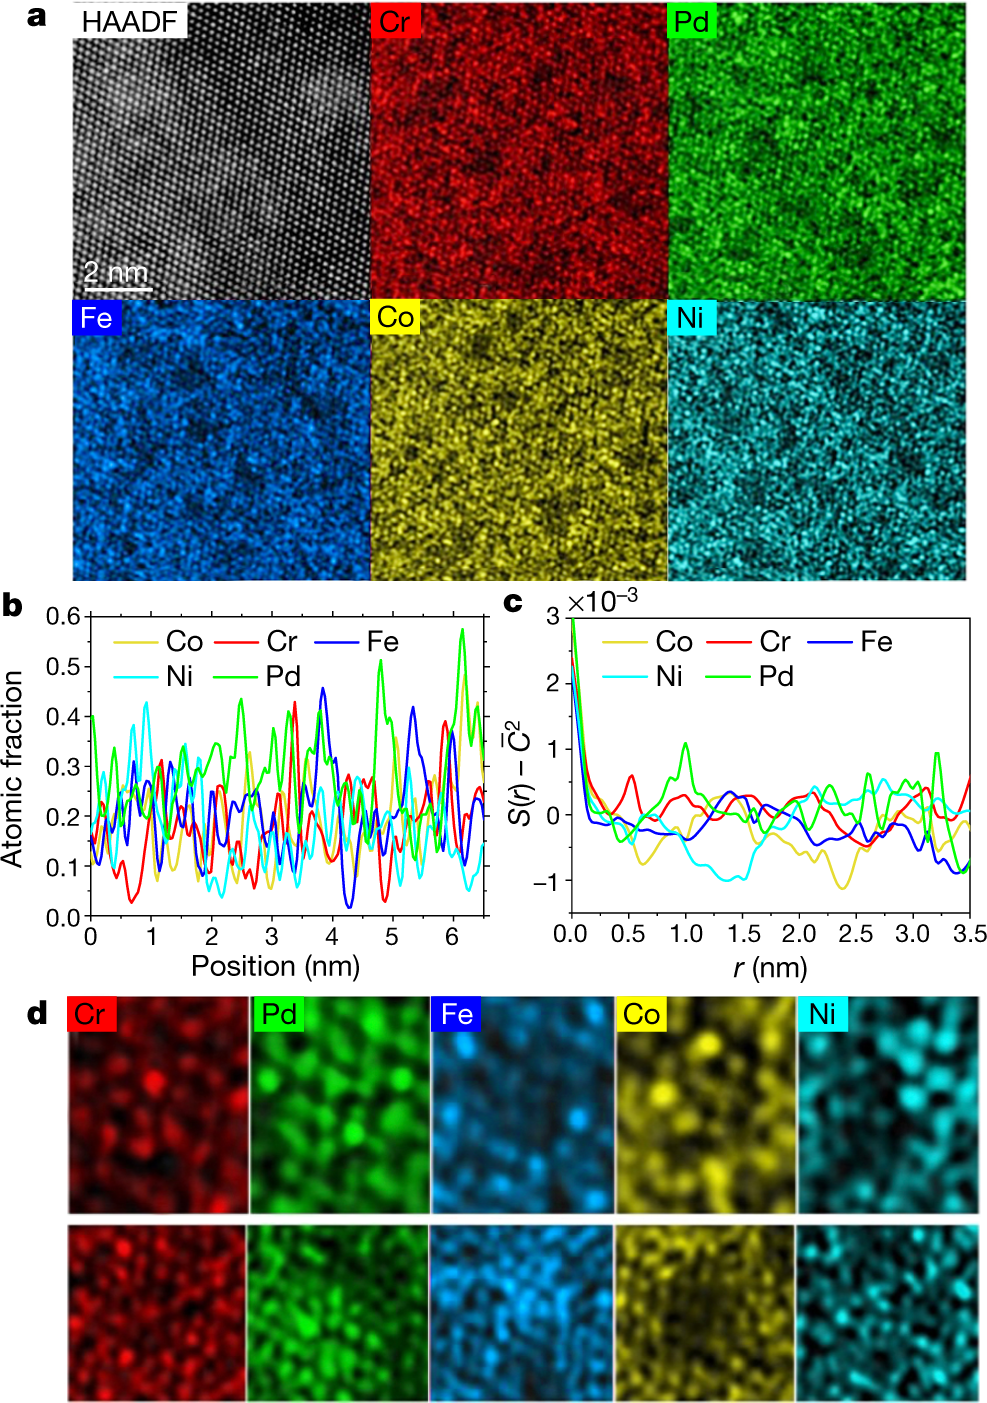
The caption:
Superscripts and lines over symbols are displaced in these captions because of the limits of the DU editor, but one can get the idea.
 ?as=webp
The caption:
The "money" picture:
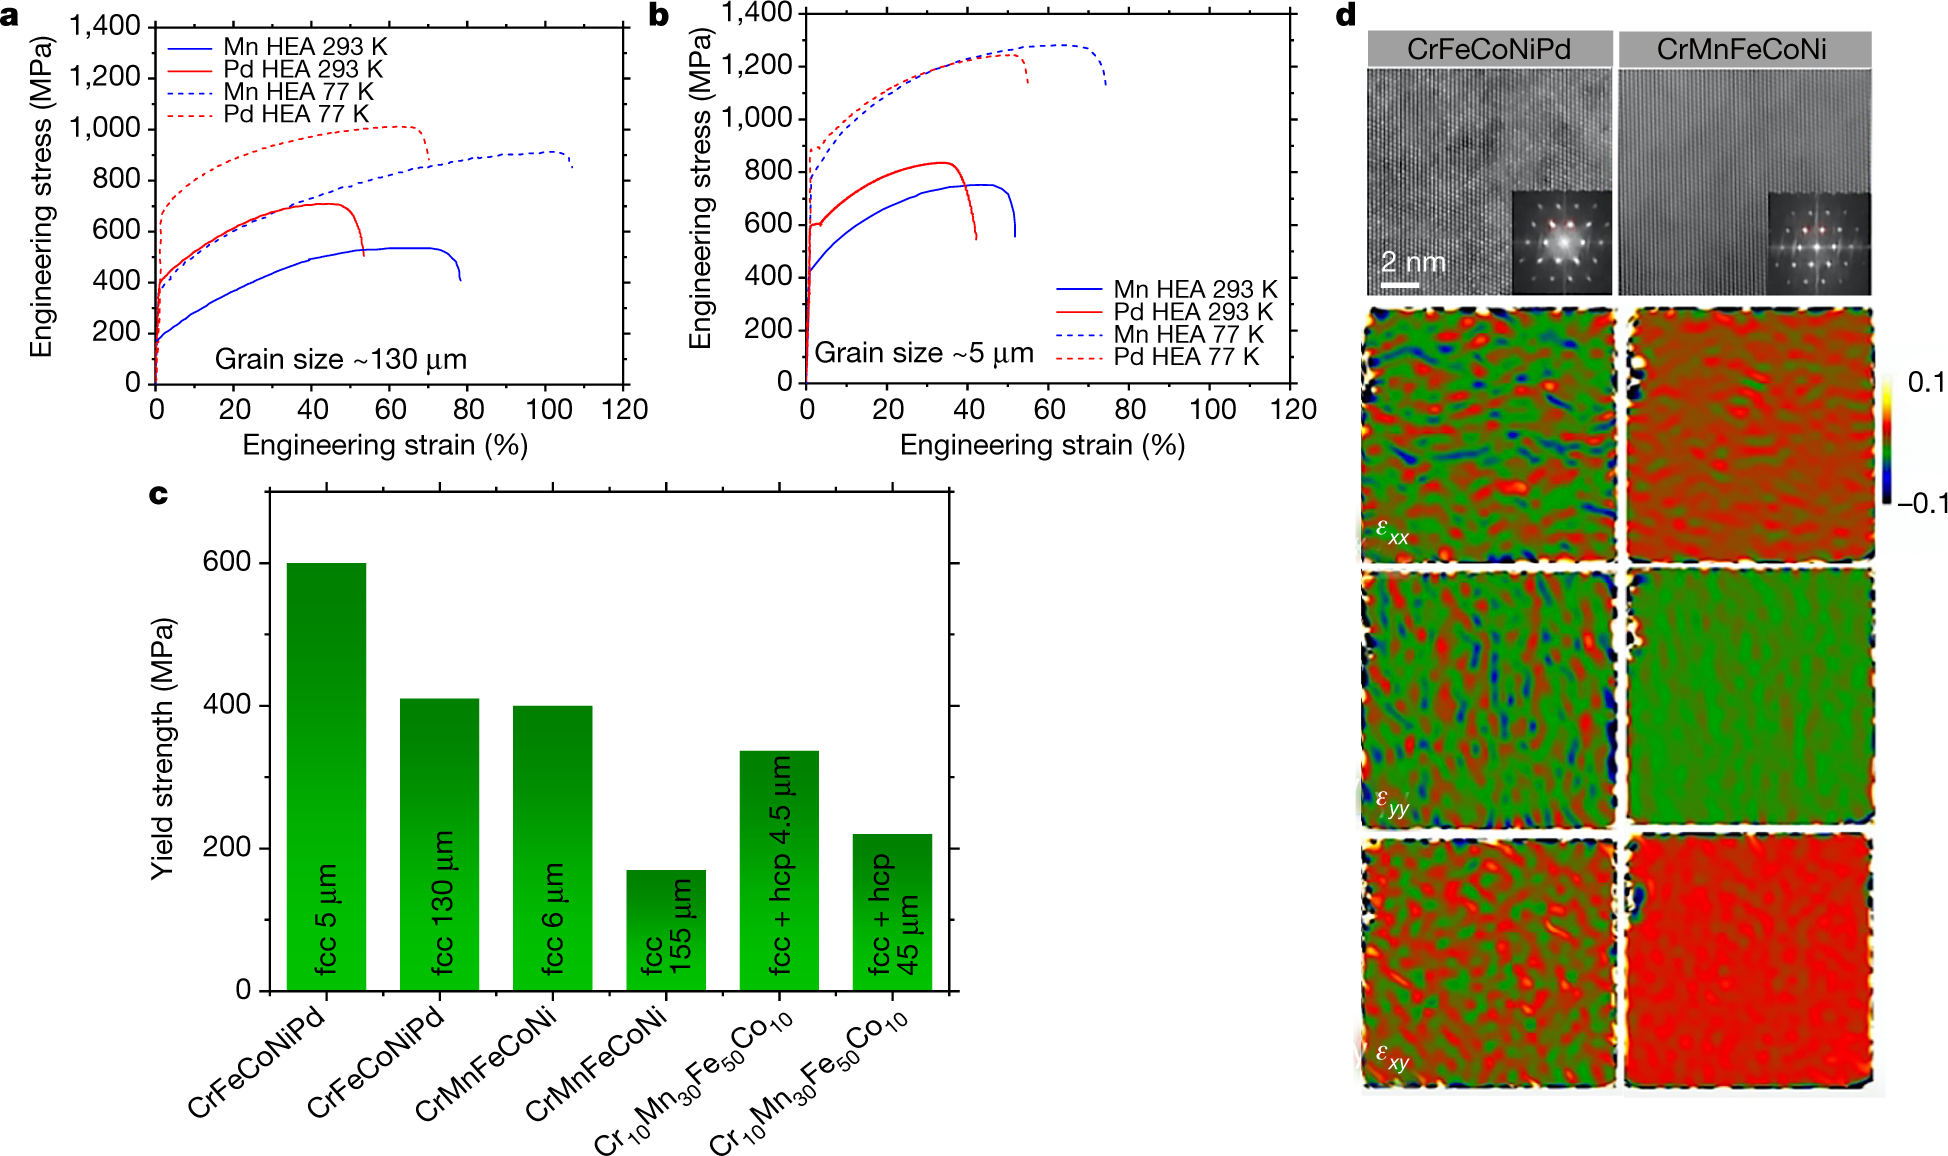
The caption:
The paper reports the temperature treatment of these alloys, but not mechanical strength at these temperatures:
Perhaps therefore with appropriate thermal barrier coatings, these alloys may be usable in high temperature turbines, where strain resistance, strength, is important. The engineering details are beyond the scope of this post, but I would like to see Brayton type nuclear heated turbines with a carbon dioxide working fluid operating at around 1400 °C for the purposes of reducing carbon dioxide. Such a system might exhibit extremely high exergy.
My son has a long weekend coming up, and will be visiting us at home. I'm looking forward to discussing this paper with him.
I wish you a pleasant day tomorrow.
Dealing with 11 Million Tons of Lithium Ion Battery Waste: Molten Salt Reprocessing.
The paper I'll discuss in this post is this one: Low-Temperature Molten-Salt-Assisted Recovery of Valuable Metals from Spent Lithium-Ion Batteries (Renjie Chen et al, ACS Sustainable Chem. Eng. 2019, 7, 19, 16144-16150)
There is, in the United States, about 75,000 tons of used nuclear fuels, generated in the United States, with 100% of the materials therein being valuable and recoverable. All of this material, called "nuclear waste" by people who have never opened a science book in their lives but nevertheless like to assert their ignorance loudly - as in the idiotic comment "Nobody knows what to do with 'Nuclear Waste'" - is located in about 100 locations, where it has been spectacularly successful at not harming a single soul.
If one doesn't know what to do with so called "nuclear waste," it's not like one is even remotely qualified to understand anything about nuclear energy because it is obvious that one has not opened a reputable science book in one's life. One's ignorance it obvious in this case, but it's not like, in Trumpian times, people are unwilling to make sweeping generalizations and pronouncements on subjects about which they know nothing.
Irrespective of the ignorance of anti-nukes, it is a shame to let these valuable materials, the only materials with high enough energy density to displace dangerous fossil fuels, go to waste, and I have spent about 30 years studying their chemistry, coming to the conclusion that the ideal way to recover the valuable materials therein is via the use of molten salts in various ways.
There are, by the way, as has been discovered in my lifetime, potentially an infinite number of such salts, and they can be finely tuned for any purpose one wishes.
By contrast to used nuclear fuel, electronic waste is widely distributed; its toxicology is not understood by the people who use it, including scientifically illiterate anti-nukes who run their computers parading their ignorance, without a care in the world about what will become of the electronic waste in their computers, their electric cars, their solar cells, their inverters, and the television sets in front of which they evidently rot their little brains. Electronic waste is not only widely distributed; it is massive and growing rapidly in volume, because of the dangerous conceit that so called "renewable energy" is "green" and "sustainable," neither of which is true.
The lithium ion battery was discovered in 1980 According to the paper I'll discuss shortly, by 2030 the total mass of lithium batteries that have been transformed into potential landfill will be 11 million tons. (I'll bold this statement in the excerpt of the paper's introduction below.) This means that each year, on average, since their discovery, 282,000 tons of waste batteries are taken out of use, about 370% of the mass of nuclear fuel accumulated over half a century.
It is only going to get worse with the bizarre popularity of electric cars, which dumb anti-nukes, with their Trumpian contempt for reality, imagine are all fueled by solar cells and wind turbines, even though solar cells and wind turbines, despite the expenditure of trillions of dollars on them have only resulted in climate change accelerating, not decelerating, since a growing[ proportion of the electricity on this planet is generated by dangerous fossil fuels, not so called "renewable energy."
It is difficult to recycle distributed stuff, and of course, it takes energy even if one can find an electronic waste recycling center, to drive to it, never mind the energy required to ship it to some third world country where the toxic materials therein will be less subject to health scruples. Inevitably, much electronic waste ends up in landfills, where it is forgotten, at least until the health effects begin to appear.
From the paper:
State-of-the-art techniques for recycling of spent LIBs have been reviewed in several studies.(2,6?10) Generally speaking, existing recovery strategies can be divided into pyrometallurgical, direct generation, and hydrometallurgical processes. Pyrometallurgical processes are usually undertaken at high temperature, resulting in relatively high energy consumption.(11?13) The alloyed product and residue require further processing to obtain high-purity products.(14) Direct generation has stringent requirements for the purity of the feed and is not appropriate for recycling materials containing large amounts of impurities.(15) In contrast, hydrometallurgical methods have obvious advantages, including high recovery efficiency of valuable metals, mild reaction conditions, and environmentally friendly conditions. These advantages make hydrometallurgical methods a preferable and promising approach for disposing of spent LIBs; however, the inorganic(16?19) and organic(14,20?22) acids used in hydrometallurgical processing may cause secondary pollution, such as acidic waste waters and production of toxic gases (Cl2, SO3, and NOx) during the leaching process, which are threats to the environment. Therefore, developing a method to reduce acid consumption, decrease the emissions of the secondary pollution, and increase recovery efficiencies of metals is critical. A salt-assisted calcination method has recently been proposed that avoids the above issues and increases recycling efficiency.(23)
Salt-assisted calcination has become widely used as a metal-recovery method for waste materials due to its high reactivity, high volatility, low melting point, and high solubilities of salts.(23?30) In addition, the solid salt agents used are generally environmentally friendly, and the process has simple operation and low-cost equipment.(28) For example, Liu et al.(31) reported a vacuum chlorinating process for simultaneous sulfur fixation and lead recovery from spent lead-acid batteries using calcium chloride (CaCl2) and silicon dioxide (SiO2) as reagents. Dang et al.(23) proposed a chlorination roasting method to recycle lithium from a pyrometallurgical slag using three chlorine donors; namely, NaCl, AlCl3, and CaCl2. These findings showed that it is possible to recover metals through salt-assisted roasting, but the reaction temperature of these solid salt fluxing agents is quite high.
In this work, we developed a combination of low-temperature ammonium salt roasting and water leaching to efficiently and environmentally recover valuable metals from spent LIBs. NH4Cl, a nontoxic and noncorrosive solid chlorinating agent, can be decomposed to NH3 and HCl gases above 230 °C; (32) the introduction of NH4Cl as a chlorinating agent into the calcination process can therefore destroy the crystal structure of LiCoO2 and enable precipitation of Li and Co. Owing to the high solubilities of the chloride salts, the metals are recovered by water leaching after chlorination. The effects of various parameters on recovery efficiencies of Co and Li, including calcination temperature, time, and mass ratio of LiCoO2 to NH4Cl, were systematically investigated. The mechanism underlying the low-temperature molten-salt-assisted recovery process is discussed in detail. The method was proven by efficiently recovering valuable metals from LiMn2O4 and LiCo1/3Mn1/3Ni1/3O2 spent LIBs. This study presents an environmentally friendly and efficient method for recovery of metals from mixed cathode materials of spent LIBs.
I have bolded the information described above. Reference 4 is here: Burgeoning Prospects of Spent Lithium-Ion Batteries in Multifarious Applications (.Natarajan, S.; Aravindan, V. Burgeoning Prospects of Spent Lithium-Ion Batteries in Multifarious Applications. Adv. Energy Mater. 2018, 8 (33), 1802303– 1802319)
One can question, if one wishes, how environmentally "friendly" a process requiring a temperature of 230 °C really is, there is certainly no efficient and scalable way to do this with so called "renewable energy" on which all our battery worshipping types have bet the planetary atmosphere, a bet we are losing at great cost to all future generations.
No matter. I personally believe that to the extent that we can close material cycles, not just for nuclear fuels but for everything, not limited to carbon either, the less odious we will appear in history, although, as I often say, history already will not forgive us, nor should it. I own lithium batteries, and to the extent the materials in them can be recovered, so much the better, fewer modern day African children will need to dig cobalt for example.
Here are the chemical reactions and the equations for thermodynamic values in this process:


Note that one of these reactions is the oxidation of ammonia to nitrogen gas using chlorine gas. Almost all of the world's ammonia is produced from hydrogen produced using dangerous natural gas, although one could have read over the last five decades or so, and can still read, lots of increasingly delusional claims that hydrogen "could" be produced by so called "renewable energy." After half a century of such rhetoric, almost none of it is.
The oxidation of ammonia by chlorine is thus an energy penalty reaction.
Before touching figure two which graphically obviates the thermodynamic penalties for recycling these putative energy storage devices, let me offer the cartoon of the "flowsheet" which is nice art:

The caption:
The thermodynamics, reactions being viable when the Gibbs free energy, ?G, is below the zero line:

The caption:
A few more graphics:

The caption:

The caption:

The caption:

The caption:
Verification of the process is described:
From the conclusion of the paper:
There is very little discussion of the electrolytes and what to do with them in this paper, but no matter. This process seems fairly sustainable with the use of clean heat, readily accessible with nuclear energy.
To the extent we can close materials cycles, even given the logistics and energy requirements of recovering distributed materials, the better we can do at ameliorating the contempt in which history will hold us.
Have a nice evening.
The Toxicity of Soy Biodiesel Combustion Waste and Petroleum Diesel Combustion Waste Compared.
The paper from the primary scientific journal I'll discuss in this post is this one: Soy Biodiesel Exhaust is More Toxic than Mineral Diesel Exhaust in Primary Human Airway Epithelial Cells (Katherine Landwehr et al, Environ. Sci. Technol. 2019 53 19 11437-11446)
In general, I am a critic of so called "renewable energy" - although, albeit some ago, I supported it - since it didn't work, isn't working and won't work to address climate change or the other massive environmental and health consequences of fossil fuels. To me, betting the future of humanity on this unworkable, & failed strategy is nothing more than a de fact acceptance of the death toll associated with dangerous fossil fuels.
This said, since we have destroyed the planet with our wishful thinking about so called renewable energy, I try to ameliorate my knowledge of the disgrace that my generation has brought on itself, by imagining ways that future generations might restore anything left to restore, in particular, the atmosphere. The energy requirements, if only because of the entropy of mixing, of removing carbon dioxide from the air are enormous, and so I turn a less jaundiced eye on biomass than I do on say, wind or solar energy, both of which are useless in any case, and both of which will involve the destruction of huge amounts of the already vanishing wilderness for mines and industrial parks.
The use of biomass, of course, extends way back. Humanity only abandoned biomass as its primary source of energy beginning in the early 19th century, because most people lived short, dire, lives in poverty, even more so than today.
The current use of biomass is still killing people as it did back then, although the death toll associated with it is slightly superseded by the death toll associated with dangerous fossil fuel waste.
Dangerous fossil fuel waste and dangerous biomass combustion waste are responsible for about 7 million deaths per year, something I often state when confronted with an ignoramus chanting his or her ignorance about so called "nuclear waste."
Some biofuels are better than others, of course. Back in the 1970's, when I was a dumb-assed anti-nuke,with effectively no education (and no access to the primary scientific literature) - when as dumb as the assholes here who chant about so called "nuclear waste" (about which they know zero since they are spectacularly unacquainted with the contents of science books) - I thought Jimmy Carter's ethanol program was a great idea.
It lead, of course, to the complete destruction of the Mississippi River Delta's ecosystem, because of phosphorous and nitrogen run-off, and it placed responsibility for selecting the candidates for Presidents of the United States in the hands of Iowans, a group of people who do stuff like vote for an orange racist pervert chanting, similar to dumb anti-nuke chants in their depth of thought - about "Making American 'Great' Again" by turning it over to the kind considerations of Vladimir the Giggler, the imperialist fascist running Russia.
So much for corn ethanol.
In the past, I've thought better of biodiesel, and once even gave serious thought to making some myself. As is well known, at least by people who give a shit, "renewable energy portfolio standards" - many addressed by biodiesel in Germany, has lead to the destruction of huge swathes of the South East Asian rainforest to make palm oil plantations.
Biodiesel, of course, is the esters of plant lipids (although animal fat has also be used) produced by transesterification of the glycerol found in natural lipids with methanol (usually) and more rarely ethanol. Methanol is usually produced by the partial oxidation of dangerous natural gas.
At least, I thought, somewhat as a consolation to this reality is that at least biodiesel burned cleaner than petroleum diesel and at least, I thought, it was something of a closed carbon cycle. The latter point of course, needs consideration of the carbon content of a rain forest in comparison to a palm oil plantation, but the former, which I assumed to be the case until I came across this paper last night, also turns out to be questionable.
From the paper's introduction:
Most previous studies comparing mineral diesel and biodiesel combustion have found that biodiesel exhaust contains more toxic gases such as nitrogen oxides and a greater proportion of smaller particles which, when inhaled, penetrate deeper into the lungs.(3,4,8,9) Despite the potentially more toxic effects of biodiesel exhaust, most studies comparing biodiesel with commercial mineral diesel rather focus on fuel economy and engine wear or the physicochemical differences between the exhausts.(4,9) Few studies compare the health effects with exhaust exposure.(7,10,11) Such studies primarily use the Ames mutagenic assay(12,13) or immortalized cell lines(8,14) and the majority of the studies only focus on the cytotoxic and mutagenic potential of the particulate matter, ignoring the effects of the gaseous components of the exhaust entirely.(7,15) Particle concentrations are also rarely relevant to real-world exposure levels, often being far too concentrated to simulate a realistic dosage.(15) In addition, in in vitro-based studies, the cell lines used are not always human, or even derived from respiratory tissues.(3,16) This brings into question their relevance in human exposure studies where the main exposure route through inhalation of the exhaust means that the respiratory epithelium is among the first tissue exposed and thus likely to be among the most effected. Immortalized cell lines also negate genetic variability and are limited in how accurately they can model normal human tissues.(17)
If exhaust is typically inhaled, health complications can occur in the respiratory,(18,19) circulatory,(20) and immune systems.(21) Of concern, inhalation of ultrafine exhaust particles has been correlated with exacerbation of childhood asthma,(22) and associations between air pollution from major roads and decreased lung function in children have been identified.(23,24) This suggests that children may be at greater risk from adverse health effects caused by exhaust exposure. This is unsurprising as children breathe faster than adults and have higher ventilation to lung surface area/body weight ratios,(25) meaning that over the same period of time, they are exposed to a larger dosage of exhaust than adults.(25,26) In addition, the respiratory and immune systems of children are still developing and insults, such as exposure to large concentrations of exhaust, are known to have lifelong consequences.(23,27,28) Despite this, the effect of exposure to biodiesel exhaust has not yet been studied in children.
Because of the paucity of information in this setting, we tested the hypothesis that the soy biodiesel exhaust would contain a greater proportion of ultrafine particles and more oxides of nitrogen and thus exposure would result in more pronounced effects on the airway epithelium. To test this, we exposed primary human airway epithelial cells from young healthy volunteers to whole exhaust from a diesel engine fueled by either pure mineral diesel, a 20% blend of soy biodiesel with mineral diesel, or pure soy biodiesel. Physicochemical exhaust properties were recorded and 24 h post exposure, cells were analyzed for a variety of health effect end points.
The authors obtained epithelial cells from children, cultured the cells, and exposed the cells (not the children) to the exhaust of petroleum diesel and biodiesel.
The fuels were burned in a test engine to produce the exhaust. The test engine was a Yanmar L100V engine, a single cylinder small diesel engine for industrial use.
The exhausts were tested using standard equipment like for which the Volkwagen company programmed defeating software into its "green" cars.
These graphics show the results:

The caption:
The caption:


The caption:

The caption:
A little on cytokines, since this topic may be somewhat obscure:
Cytokines are small signalling proteins, very much involved with the immune system. Under certain conditions, they can be pathological in the sense of producing inflammation and (as implied here) cell death.
Not necessarily, good news, this paper, I think.
It is possible, still, I think, to utilize biomass safely, particularly fast growing biomass like algae. This approach can capture carbon dioxide because of the inherent ability of life forms to replicate and expand surface area. The use of such biomass were it to be done safely, however, in contrast to simple chemical modifications like transesterification, would involve supercritical water oxidation (SWO) or pyrolysis, subjects about which I've written here and elsewhere.
This paper, nevertheless, suggests that in the case of a particular biofuel, soy biodiesel, operating in a particular type of diesel engine, a one cylinder portable diesel, the "renewable case" is actually worse than the dangerous fossil fuel case, which is not to excuse the dangerous fossil fuel case.
The current issue of Environmental Science and Technology, a scientific journal I read almost religiously, and have been reading for many, many years is pretty focused - it's nice to see this at long last - on some questioning of the common "renewable energy" assumptions, and myths one being whether "renewable energy" is actually "renewable." I especially enjoyed the paper I found yesterday about which I posted. It was about how a tiny country, an offshore oil and gas drilling hellhole, that likes to put "renewable energy" lipstick on its fossil fuel pig, will most likely not be able to sustain its wind energy program because of material considerations. The same Danish research group published in the same issue, a detailed analysis of the platinum mass flows associated with so called "renewable energy" and the "100% renewable by 2050" bullshit we hand out with our continuing contempt for future generations.
Nevertheless, the nice thing about reading scientific journals is that, even if they go off on a trend that is less than fruitful or even wise, reality ultimately leads to self correction.
Published science can be wrong, or more mildly, mistaken, but science that is either, is self correcting, because in science, facts matter. More and more, I'm seeing questions rising about so called "renewable energy," and this is a good thing, because a process which cannot stand questioning does not deserve to proceed, particularly at risk to all humanity.
It is, by the way, no matter how much chanting and sloganeering goes on, a fact that the death toll from dangerous fossil fuel and biomass waste - about which many people here (I'm referring to rote anti-nukes of the type populating my ignore list) couldn't care less - is enormous, while the death toll from so called "nuclear waste" (about which they chant in a phenomenally ignorant fashion) is trivial, despite all the coal and oil burned to run computers to complain about "nuclear waste." So called "nuclear waste" hasn't killed anyone in this country in half a century. Air pollution, by contrast, never stops killing.
Betting the planet on so called "renewable energy" which hasn't worked, isn't working, and won't work, is the equivalent of announcing that one accepts the death toll associated with air pollution (not to mention climate change) and thinks it trivial and also that one thinks that destroying the entire planetary atmosphere, the climate, and all the ecosystems dependent on the climate and the atmosphere is acceptable because one is mindless enough to engage fetishes involving the dopey selective attention that thinks that Fukushima was the end of the world. It wasn't. This is a fact.
One of the interesting facets if one is to ponder this quality of thinking, which is Trumpian the depth of its delusion and the inherent gaslit (literally) lies such thinking involves, is the amusing fact that it is easy to insert one's head very far up one's ass if one's brains are soft, small, and largely empty.
All joking aside, dangerous fossil fuels must be banned. It can be done, but not so long as we surrender to the application of deliberate ignorance. Fuels based on food products won't do it any more than wind turbines, electric cars and solar cells will do it.
Have a nice day tomorrow.
Resourcing the Fairytale Country with Wind Power: A Dynamic Material Flow Analysis
Given my hostility to the wind industry, said hostility stemming from the belief that it is not only ineffective, but also unsustainable, let me state that the title for this post is identical to the title of the paper I will discuss in it, and that three of the authors of this scientific paper work in academic institutions in that offshore oil and gas drilling hellhole, Denmark, despite having names with Chinese origins.
The paper in question is this one: Resourcing the Fairytale Country with Wind Power: A Dynamic Material Flow Analysis (Liu et al, Environ. Sci. Technol. 2019, 53, 19, 11313-11322)
The introduction, indicating that it focuses on the Danish case, which I hold up as an indicator that so called "renewable energy" isn't working and won't work, particularly because Denmark is a small country jutting into the North Sea, which it has laced with wind turbines and offshore oil and gas rigs:
For example, Denmark, a pioneer in developing commercial wind power since the 1970s’ oil crisis, has built up an energy system of which already about 48% of electricity is from wind in 2017.(14,15) The intermittent yet abundant wind energy in Denmark will continue to play a major role for achieving the Danish government’s ambition to have a “100% renewable” energy system by 2050.(16,17) Understanding potential resource supply bottlenecks, reliance on foreign mineral resources, and secondary materials provision is, therefore, an important and timely topic for both the Danish wind energy sector and Denmark’s energy and climate policy.
Construction and maintenance of wind power systems needs large quantities of raw materials mainly due to large-scale deployment of wind turbines and infrastructure on land or at sea.(18) In particular, two rare earth elements (neodymium and dysprosium) mainly used in permanent magnets have raised special concerns in the wind energy sector(10,19,20) due to overconcentration of rare earth’s supply in China,(21) sustainability of upstream mining and production processes,(22) and complexity of wind turbines’ supply chain.(23) Moreover, the wind energy sector also faces increasing challenges in both meeting future demands for several base metals (e.g., copper used in transmission(18)) and managing mounting end-of-life (EoL) materials (e.g., glass fiber in blades(24?26)) arising from decommissioned wind turbines.
A variety of methods have been used to translate wind energy scenarios into material demand. If the annual newly installed capacity of wind turbines is given, its associated material demand is often directly determined by material intensity per capacity unit.(5,8,9,27?30) If annual installed capacity is not given, its associated material demand can be derived from a life cycle assessment (LCA)-based input–output method,(31) economic model,(32) or dynamic material flow analysis (MFA) model.(6,11,20,25,30,33?36) The dynamic MFA model has been increasingly used to explore material requirements of wind energy provisioning on a global scale,(6,11,30,33,34) country scale (e.g., the US,(20) France,(25) and Germany(35)), or country scale with a regional resolution.(36) The principle of mass balance constitutes the foundation of any MFA, so that the annual newly installed capacity (“inflow”) and annual decommissioned capacity (“outflow”) of wind turbines are driven by their lifetime and the expansion and replacement of the installed wind power capacity (“stock”),(20,36) which has also been widely used in other anthropogenic stock studies.(37)
However, the current practice of modeling raw material requirement or secondary material availability in different wind energy technologies generally overlooks the hierarchical, layered characteristics of wind power systems. This is important because materials embedded in a technology system are usually distributed in its subsystem or subcomponents with varying compositions and recycling potentials.(38,39) In the case of wind power systems, materials employed in a wind turbine are distributed in its subcomponents such as rotor, tower, and nacelle, and their mass is largely determined by the turbine size (e.g., rotor diameter or hub height) and capacity.(13,40) These constraining factors and their leverages on the sustainability and resilience of the wind energy provisioning should be fully examined. Such information would enable wind turbine manufacturers, material suppliers, recyclers, end users, and policy makers to plan their material-related policies with a comprehensive understanding on a range of important aspects related to wind energy provisioning, such as secondary material supply, technological development, and material efficiency.
Here, we developed a component-by-component and stock-driven prospective MFA model to characterize material requirements and secondary material potentials of different Danish wind energy development scenarios. Based on two datasets that cover a range of microengineering parameters (e.g., capacity, rotor diameter, hub height, rotor weight, nacelle weight, and tower weight) of wind turbines installed in Denmark and worldwide, we established empirical regressions among these parameters in order to address the size scaling effects of wind turbines.
Some graphics:

The caption:

The caption:

The graphic refers to the Danish Master Register of Wind Turbines, which I have often appealed to in this space, at least in the E&E forum where I used to write from time to time.
The caption:
This graphic cleanly draws out the number of wind turbines that will become landfill as the wind industry, um, "expands."

The caption:
By the way, the "hydrogen" scenario has been under discussion with tons and tons and tons of wishful thinking applied to it. A pilot program on the Norwegian island of Utsira, which generated a huge internet hoopla, and was designed to power ten homes, was finally reduced to "lessons learned." The entire project generated many orders of magnitude of hype as opposed to, um, hydrogen.
Some useful text from the paper before examining the dysprosium and neodymium cases in graphics:
Figure 5 assembles the results of material requirements (inflows) and potential secondary materials supply (outflows) during 2018–2050 under the six scenarios. Several key observations on the trends of inflows and outflows are detailed below.
•The inflows of bulk materials (concrete, steel, cast iron, nonferrous metals, polymer materials, and fiberglass) under the hydrogen, IDA, and wind scenarios will increase by 413.31, 211.91, and 328.83%, respectively. Meanwhile, the outflows of bulk materials will increase by 52.90, 49.86, and 33.15%, respectively. On the contrary, the inflows of bulk materials will increase at a slower rate under the fossil and biomass scenarios or fall slightly under the biomass+ scenario. Meanwhile, the outflows of bulk materials will decrease by 23.71, 15.98, and 37.76%, respectively.
•The inflow of neodymium under the hydrogen, IDA, and wind scenarios will climb to 14.50, 12.36, and 11.15 tonne year–1, respectively. Meanwhile, the outflow of neodymium will swell to 5.64, 5.71, and 4.98 tonne year–1, respectively. On the contrary, the inflow of neodymium will decrease at first and increase to 3.78 and 4.28 tonne year–1 under the fossil and biomass scenarios, respectively, or decrease to 2.46 tonne year–1 under the biomass+ scenario; meanwhile, the outflow of neodymium will climb up and stabilize at a certain level under the fossil (3.07 tonne year–1), biomass (3.34 tonne year–1), and biomass+ (2.60 tonne year–1) scenarios.
•A similar trend is observed in the inflow and outflow of dysprosium. The inflow of dysprosium under the hydrogen, IDA, and wind scenarios will eventually climb to 1.73, 1.48, and 1.33 tonne year–1, respectively. Meanwhile, the outflow of dysprosium will simultaneously grow to 0.67, 0.68, and 0.59 tonne year–1, respectively. On the contrary, the inflow of dysprosium will decrease at first and increase to 0.451 and 0.51 tonne year–1 under the fossil and biomass scenarios, respectively, or decrease to 0.29 tonne year–1 under the biomass+ scenario; meanwhile, the outflow of dysprosium will climb up and stabilize at a certain level under the fossil (0.37 tonne year–1), biomass (0.40 tonne year–1), and biomass+ (0.31 tonne year–1) scenarios.
•The aforementioned observations indicate that, in the case of both bulk materials and critical materials, the gap between their inflow and outflow will be enlarged under the hydrogen, IDA, and wind scenarios, and it will still be enlarged but to a lesser degree under the fossil, biomass, and biomass+ scenarios.
Nowhere mentioned here is the nuclear case, since we're in fairy tale land and there's no purpose to discussing things that might actually work.
Some mass flows under the scenarios explored in this paper:

The caption:
From the text:
Of course this depends on Denmark changing the way it currently handles it's waste, which is to ship it to countries including those with lower standards of living than Danes:
And of course, there's no indication that circularity will be economically or technologically viable, but of course, it's a good idea to demand that future generations do what we are clearly incapable of doing ourselves, the old "by 2050" scam that's applicable in this paper because of the Danes claim that they will be 100% renewable "by 2050" - when most of the government administrators making this claim will be dead.
One last graphic:

The caption:
From the conclusion to the paper:
If any of this remotely troubles you, don't worry, be happy. It's not your problem; it's the problem of every living thing that will come after us.
History will not forgive us; nor should it.
Have a nice evening.
Steel Flows in the United States.
The paper I'll discuss in this brief post is this one: Mapping the Annual Flow of Steel in the United States (Yongxian Zhu, Kyle Syndergaard and Daniel R. Cooper, Environ. Sci. Technol.2019, 53, 19, 11260-11268)
The production of steel is coal dependent, and all the hand waving and fantasies in the world about the death of coal will not change this fact in the immediate future. Personally I believe that it is technologically feasible to displace coal in steel making, but not using steel intensive industries like, say, the wind industry, although the effort to make it significant - which will fail because of the simple laws of physics - will uselessly consume a lot of steel for no good purpose.
From the paper's introduction, verifying the fact of the GHG intensity of steel:
Realization that steel production must decrease if emission targets are to be achieved has helped lead to new research areas under the banners of “material efficiency”(5) and “circular economy”,(6) both aimed at reducing emission-intensive material production. Researchers in these new areas require a detailed material map in order to identify opportunities.
Unlike in the developing world, U.S. per capita steel stocks plateaued around 1980. The stock saturation level has been estimated at 9.1–14.3 t/capita.(7?9) Per capita stocks are expected to saturate in much of the developing world to a level similar to those in the U.S. by the late 21st century.(10,11) Therefore, the derived U.S. consumption pattern may represent a population-scaled surrogate model of the future global state.
I'll just cut to two of the informative graphics, one of which is a Sankey diagram of US steel flows, which, to utilize, one may need to utilize expanded views and rotation tools:

The caption:

The caption:
It is notable that the United States throws away more steel than it produces from pig iron and that amount of steel consumed for transportation is double that of the rest of the world, even if we love to declare ourselves "green" in contrast to say, China:
In a closed carbon cycle world, which I freely admit would be energy intensive, one can imagine the separation of impurities like copper might be conceivable.
Interesting paper, I think.
I trust you're having a wonderful afternoon.
Speciation of Recovered Yttrium from the Remediation of Acid Mine Drainage.
The paper I'll discuss in this paper is this one: Solid and Aqueous Speciation of Yttrium in Passive Remediation Systems of Acid Mine Drainage (Lozano et al Environ. Sci. Technol. 2019, 53, 19, 11153-11161).
Besides consuming, as an accelerating rate, dangerous fossil fuels and deliberately dumping dangerous fossil fuel waste in the atmosphere, the seas, and the land, we are also consuming workable resources of many of the important elements in the periodic table. Thus future generations will have very low quality ores - which will require ever larger quantities of energy to refine per unit mass - with which to remediate the environmental disaster that this current generation of human beings represent. This will have implications on our glib predictions, all of which are contemptible nonsense, of so called "renewable energy" nirvanas "by 2050," or "by 2030," or "by 2075" or "by 2100." These nirvanas have not appeared, are not present and will not appear.
The insurmountable fact about so called "renewable energy" is its low energy to mass ratios, which requires massive amounts of materials to produce systems which economically, technologically and most importantly environmentally require redundant systems working at reduced thermodynamic and economic efficiency. (This is why the highest household electricity prices among the OECD nations belong to Germany and Denmark.)
One type of low grade ore which elements may be recovered is water, particularly polluted water, which is often polluted precisely because of the elements in it. If the water flows naturally, such recovery can involve lower expenditures of energy, and thus future generations may wish to exploit this fact since in our contempt for them we have doomed to live on our garbage, while we flatter ourselves for owning useless solar cells, electric cars, and what have you.
That brings me to the current paper. From the introduction:
Similarly to the REE uptake by basaluminite in DAS treatments, Gammons et al. reported the precipitation of hydrous aluminum oxides accompanied by a decrease in REE concentration from AMD when mixed with natural water.(16) Recently, the scavenging of REEs by basaluminite precipitates has been described as a sorption mechanism.(17) AMD is characterized to contain high loads of dissolved sulfate and the affinity of REEs to form aqueous species with sulfate is very high, the MSO4+ aqueous complex being more abundant in AMD solutions.(18) Sorption of dissolved REEs from sulfate-rich waters onto basaluminite is thus described as the sorption of the MSO4+ aqueous complex via ligand exchange with a surface site of basaluminite, forming a monodentate surface complex with the Al-octahedron as one proton is released.(17) Here, a structural description of the aqueous YSO4+ complex and of the local environment of the surface complex formed upon adsorption onto basaluminite are reported...
...The objective of this study is to elucidate the structure of Y adsorbed onto basaluminite. Its chemical similarities with HREEs allow us to assume similar structural configuration for this subgroup. Moreover, this element was one of the most concentrated in waste samples allowing performing X-ray absorption spectroscopy experiments. Since the YSO4+ aqueous complex is adsorbed onto the mineral,(17) a previous characterization of the geometry of the aqueous complex has been carried out. Finally, a quantification of Y-species in basaluminite solids precipitated from AMD treatments has been performed. Structural studies were performed using EXAFS and pair distribution function (PDF) analyses of aqueous and solid samples combined with ab initio molecular dynamics (AIMD) simulations of the aqueous YSO4+ complexes.
Two hypotheses are used to investigate the local structure of the aqueous YSO4+ ion pair: (1) an outer-sphere complex, with water located between Y3+ and SO42–, and (2) an inner-sphere complex. In the latter case, two more hypotheses must be considered: (a) a monodentate complex, with one oxygen atom shared between the sulfate and the first coordination sphere of Y3+, and (b) a bidentate complex, with two oxygen atoms shared between the yttrium hydration sphere and the sulfate group.
Once the structure of the aqueous solution is fully described, different hypotheses have been considered to interpret the YSO4+ surface complexation onto the Al-oxyhydroxysulfate:
Pair distribution analysis and EXAFS techniques are analytical methods that depend on the absorption and scattering of x-rays.
A reference in this text indicates that a calculated quantity of yttrium (and perhaps other lanthanide (rare earth) elements would be on the order of a few hundred kg per year from remediating acid mine drainage that pollutes two Iberian rivers.
Some pictures from the text:

The caption:

The caption:

The caption:
Perhaps these technical graphics don't mean much to the average person, but may stimulate some thinking for those interested in analytical techniques, but this cartoon shows how to yttrium bonds to the surface of the aluminate mineral being utilized to remediate the acid mine dicharges:

The caption:
These results suggest that the monodentate structure is most important:

The caption:
The authors propose the following environmental implications:
The description of the local structure of yttrium sorbed onto the basaluminite surface provided here complements the atomic configuration studies of other trace metals, such as As and Se elements in this mineral.(44) The chemical similarity between yttrium and other HREEs (from Tb to Lu) suggests that similar environments could be present for the other elements of the same group. This fact has important environmental consequences, as the HREE would be strongly sorbed, forming inner sphere complexes, which could result in their long-term immobilization at least until the host phase is dissolved or re-precipitated. A key question emerges about the long-term stability of the complex, particularly with an increase in the solution pH.
I feel for future generations, I really do.
It's nice that, despite our obvious contempt for them, as evidenced by our focus on our own wishful thinking (on the left) and denial (on the right), that we may leave them with some knowledge that may be useful.
Enjoy the remainder of your Sunday afternoon.
Impact of Common Plastics on Cellulose Pyrolysis
The brief communication I'll discuss in this post is this one: Impact of Common Plastics on Cellulose Pyrolysis (Shogo Kumagai et al Energy Fuels, 2019, 33, 6837?6841)
Recently, in considering the options that future generations might have to address our willful destruction of our planet's biological infrastructure, in particular its land and seas, with the land thrown in for good measure, I have been considering the case of supercritical water oxidation of seawater driven by nuclear heat. Because salts are largely insoluble in supercritical water - water which is at a temperature greater than 373°C and a pressure over approximately 22 MPa - and because seawater, particularly in its upper layers, contains the bulk of its biomass, the bulk of microplastics, as well as a much higher concentration of carbon dioxide than is in the atmosphere, such oxidation has considerable appeal at addressing climate change and actually removing carbon dioxide from the atmosphere as well as providing clean and sustainable fresh water.
On an industrial scale over a period of a few generations, it might serve to restore the oceans while providing important materials, water hardly being the only one of interest. (Phosphorous and uranium are others.)
I've been catching up on some back reading and filing of scientific papers, and came across this interesting little communication that is somewhat relevant to the case, and thought I'd note it.
Note that the work described here is also relevant to the case of the use of land based destruction of municipal waste and the capture of CO2 from land based biomass including that which is not food.
From the paper's introduction:
Pyrolytic interactions, often called synergies, during the copyrolysis of lignocellulosic biomass and plastic are of widely recognized importance...
...Because these plastics decompose through radical chain mechanisms,12?14 radical interactions during copyrolysis have recently been studied by employing an electron spin resonance spectrometer featuring a novel heating unit.11 However, the hydrogen exchange ability and the radical interaction mechanism depend upon the plastic type, and the influence of various plastics on cellulose pyrolysis and vice versa remain unclear. The pyrolysis of other polymers, such as PVC and PET, progresses via radical and ionic reactions...
...Thus, herein, we investigated the impact of the five most commonly used plastics, viz., PE, PP, PS, PVC, and PET, on cellulose pyrolysis and vice versa by employing the yield difference factor (YD; eq 1) and the difference from the estimated weight fraction [Di (wt %); eq 2]. Pyrolysis of each sample and co-pyrolysis of binary mixtures of cellulose and each plastic (1:1 weight ratio) were carried out at 500 °C in a horizontal quartz tube reactor (Figure S1 of the Supporting Information). Detailed experimental information has been summarized in the Supporting Information...
The simple equations:
The supporting information of the paper is probably open sourced, should one be interested.
The table shows what they found:
PVC, unsurprisingly, produces a fair amount of HCl gas. This is problematic, although it may prove useful for the recovery of metals from municipal waste.
Note that these results are at 500 °C. Higher temperatures, accessible by nuclear means, may give a different distribution of products.
The chars may have many uses, particularly in the treatment of metal contaminated waters, and inasmuch they represent sequestered carbon, offer this and other advantages.
Have a nice weekend.
Corrosion Implications for Silicon Carbide in FLINAK in Contact with Hastelloy N
The paper I'll discuss in this post is this one: Corrosion of SiC induced by Hastelloy N alloy and its corrosion products in LiF–NaF–KF molten salt (Xia et al,Corrosion Science 109 (2016) 62–67)
I stumbled across this paper while looking into an anomalous result in polymer chemistry, of all things, as I had a sort of long shot idea that proved to be silly. Being wrong can be good for you, particularly if you go looking for literature evidence for a ridiculous idea only to stumble upon some truth you might have otherwise missed.
Among the enlightened who have understood the importance and environmental superiority of nuclear energy - which whether we like or not is the only practical approach to addressing climate change - the idea of the molten salt reactor, fueled by thorium, has generated a lot of attention in the last 10 or 15 years, especially in popular imagination. The general idea has been based on the commercial development MSRE (Molten Salt Reactor Experiment) conducted at Oak Ridge National Laboratory - a truly fascinating place as I learned this summer when my kid interned there - in the 1960's. Upon capturing a neutron, thorium-232, the prevalent isotope on Earth, decays to uranium-233, uranium-233 being essentially the only actinide isotope that can act as a breeder fuel on thermal conditions, thermal conditions being those under which the average speed of neutrons is taken to be roughly equivalent to the average speed of molecules in common gases, such as those in air at room temperature, generally taken to be 0.253 eV. A breeding fuel is, of course, a fissionable nuclide that can release enough neutrons to convert a fertile nuclide into a fissionable one.
I spent a lot of time looking into this type of reactor before concluding I liked other reactor concepts better; I'm a fast neutron kind of guy, because fast neutrons can breed, um, faster, than thermal (slow) neutrons, a happy parallelism in language for alternate meanings for homonyms. I think it important to phase out the expense, environmentally dubious work, and time for isotopic enrichment.
There are, however, proposals for fast molten salt reactors. Thermal molten salt reactors use a salt called "FLiBe" using the chemical symbols for fluorine, lithium and beryllium - light atoms that have the tendency to thermalize neutrons, although as a practical matter MSR's are moderated also with graphite - in a composition appropriate to produce a eutectic mixture. An alternative eutectic salt with less moderating ability is FLiNaK, composed of the symbols for fluorine, lithium, sodium and potassium. (A mixture of sodium and potassium metals has been widely used in breeder reactors running on plutonium; this metal coolant has been problematic, although no one ever seems to give up on it entirely.)
One proposal for a FLINAK cooled reactor is a sort of hybrid reactor, built around the concept of the helium cooled pebble bed reactor, which used something called TRISO fuel beads, immersed in a FLINAK molten salt. This reactor concept has been widely discussed by Charles Forsberg at MIT and Per Peterson at UC Berkeley.
TRISO (Tri-Structural Isotropic) fuel is a composite material which in part, consists of the refractory material silicon carbide, carbon and actinides in spherical layers.
Hastelloy is a "superalloy" which shows resistance to attack by fluoride (and inevitably fluorine generated in a radiation field) by virtue of being Nickel based. Superalloys also feature very high melting temperatures, in the case of Hastelloy N, this property is obtained by alloying nickel with molybdenum and chromium.
I'm not really a molten salt kind of guy anymore, considering that these salts have some major drawbacks. The first of these in both cases concerns lithium. Unless its two isomers are separated, 6 and 7, lithium under neutron bombardment tends to generate a lot of tritium. This would not be a problem in the case that someone someday builds a workable fusion reactor, something that's been 20 years off for well over half a century, and it might even be advisable as a source of light helium when the world supply of helium-4 runs out (it's definitively not "renewable" since tritium decays to the interesting isotope helium-3. Still it strikes me as a pain in the ass. FLIBE also contains beryllium, a toxic metal, which under neutron bombardment over long periods accumulates the long lived Beryllium-10 isotope which decays into the neutron poison boron-10.
This said, the most problematic nuclear reactor, even including the RBMK Chernobyl type reactor, is superior to the best dangerous fossil fuel plant in terms of risk, since dangerous fossil fuel plants kill people whenever they operate normally.
The FLiNaK fuel will tend to increase the concentration of the radioactive K-40 isotope, not terribly problematic inasmuch is this isotope occurs naturally, meaning human beings would die without ingesting a certain amount of radioactivity, but still is less than completely desirable to make potassium similar to that of a few billion years ago.
Both molten salts produce oxygen-18 as a result of certain nuclear reactions - 19F[n,2n]O18 - which might be of limited scientific utility for the study of chemical reaction mechanisms.
I don't think that any of these concerns are show stoppers, but for me, well, metallic fuels have the highest breeding ratios, and if I were to build a hybrid, it would involve liquid metals and certain types of interesting ceramics, perhaps with salts as coolants and heat transfer agents (which they are effectively in the TRISO/FLINAK hybrid) although I might choose different salts for different reasons.
Anyway, there are a number of ways in which silicon carbide can be utilized in nuclear technology besides TRISO. All this brings me to the paper referenced at the outset which discusses another application for SiC.
From the introductory text:
Molten salt Reactor (MSR) is one of six reactors proposed by the Generation IV International Forum [1]. There are graphite, molten fluoride salt, and Nickel-based alloy, such as Hastelloy N alloy, in MSR [2]. The Molten-Salt Reactor Experiment (MSRE) per-formed in the 1960s revealed that Hastelloy N alloy and graphite are compatible with molten fluoride salt [2]. However, the permeation of molten fluoride salt into porous graphite is a critical issue, which can create local hot spots where the damage rate would be increased [2]. Silicon carbide (SiC) coating can be used to protect graphite moderator against the permeation of molten fluoride salt [3]. SiC ceramic and SiC fiber reinforced SiC ceramic composite (SiCf/SiC) are potential materials for MSRs due to their superior high-temperature properties, corrosion resistance, and irradiation resistance. SiCf/SiC composite is also one of candidate materials for shut down rod channel liners, core support plates, ex-core control blade guides and wetted refueling mechanism in MSRs [4,5].Experiments performed at Oak Ridge National Laboratory revealed that SiC is not obviously corroded by molten FLiNaK (46.5 mol% LiF,11.5 mol% NaF, and 42 mol% KF) salt [6]. However, impurities may cause the corrosion of SiC in molten fluoride salt. There are intrinsic impurities from molten fluoride salt and impurities from the corrosion of Hastelloy N alloy. Oxygen is common impurity in molten fluoride salt. SiC may react with oxygen in salt to form oxide that can be corroded by molten fluoride salt [7,8]. Fluoride anions can cause the breakage of Si O Si bonds and the formation of Si F bonds [7]. Oxides of SiC may react with molten FLiNaK salt to formSiF4, K2SiF6, Na2SiF6, [SiO4]4?, [Si2O5]2?, [SiO3F]3?, [SiO2F2]2?, andSi4O7F2[7–9]. The corrosion of SiC may be aggravated because of an increase in the concentration of metal corrosion products in salts induced by the corrosion of Hastelloy N alloy. Hastelloy N alloy is nickel-based alloy and is composed of 15–17 wt% Mo, 6–8 wt% Cr, 4–6 wt% Fe...
...Molten FLiNaK salt is one of candidate coolants in MSR due to its chemical and radiolytic stability [28]. In the whole MSR system, the salt-containing piping and equipment are composed of Hastelloy N alloy. The corrosion of Hastelloy N alloy can increase the concentration of metal impurities in salt. The effect of corrosion products of Hastelloy N alloy on the corrosion of SiC should be investigated. Ni is the base element of Hastelloy N alloy. Cr in Hastelloy N alloy can be easily corroded. Therefore, we studied the effect of Hastelloy N alloy and its corresponding corrosion products, CrF2and NiF2...
The pictures should give a feel for the ways they investigated these effects.


The effect of Hastelloy N alloy and its corresponding corrosion products on the corrosion of SiC in molten FLiNaK salt was investigated by SEM/EDS, GI–XRD, and GD–MS. Results reveal that Hastelloy N alloy and the corresponding corrosion products can induce the corrosion of SiC in FLiNaK salt. Three factors affect the corrosion of SiC.
(1) Ni in Hastelloy N alloy can trigger the corrosion of SiC. Ni can react with Si in salt to form NiSi and Ni31Si12on the surface of Hastelloy N alloy. Silicide deposited on the surface of alloy can drive the dissolution of Si from SiC into salt and alloy.
(2) The corrosion product, NiF2can drive the corrosion of SiC. NiF2can make SiC with a thickness of ?50 _m almost disappear after experiment for 45 days. Thus, the Si content in salt increased up to 0.5 wt%. Raman spectrum indicates that Si in salt is in the form of [SiF6]2?.
(3) The corrosion product, CrF2, can induce the corrosion of SiC. CrF2 can react with SiC to form Cr7C3 and CrC on SiC, and then induce the dissolution of element Si from SiC into salt.
From my perspective, it might be useful to evaluate various types of nitride, as opposed to carbide, coatings, but that's just my opinion. I'm not really a FLiNaK kind of guy, although I have been interested in other, less studied, fluorides.
I wish you a pleasant Wednesday tomorrow.
Profile Information
Gender: MaleCurrent location: New Jersey
Member since: 2002
Number of posts: 33,509