Garrett78
Garrett78's JournalUtterly Unrealistic
I've asked many times for someone to use one of the delegate calculators to demonstrate how Sanders could acquire a majority of pledged delegates. Finally someone has done so, but it's nowhere close to realistic.
8-point victory in NY, 12-point victory in NJ, and a 16-point victory in both PA and CA? Only a 10-point loss in MD and only a 16-point loss in Wash. D.C.?
Could one of those things happen? I suppose. All of them? No.
And even then Sanders just barely takes the lead.
Why All the Posts About Superdelegates???
Clinton will likely end up with around 2200 pledged delegates (give or take 100) and Sanders will likely end up with around 1800 pledged delegates (give or take 100). With 2026 constituting a majority. Sure, it could possibly end up being closer than that, but I don't get why there is so much talk about superdelegates at this time.
If it does end up 2200-1850, is there really anyone here who thinks the person with 2200 should not be the nominee? Is there anyone here who thinks the superdelegates should make the 1850 person the nominee?
The Red State Meme: Which States are Actually the 'Reddest'?
Since there are so many posts about Clinton's reliance on "deep red" states in her race against Sanders, I thought I'd start a new thread to address this issue. So, to get a general idea of which states are the 'reddest', I'm going to post Romney's approximate margin of victory in each state he won in 2012. Where the margin is basically the same, I will look at the exact percentage difference and rank accordingly.
1) Utah: 48 points
2) Wyoming: 41 points
3) Oklahoma: 34 points
4) Idaho: 32 points
5) West Virginia: 27 points
6) Arkansas: 24 points
7) Nebraska: 23 points
8) Kentucky: 22 points (22.7)
9) Alabama: 22 points (22.3)
10) Kansas: 22 points (22.2)
11) Tennessee: 20 points (20.5)
12) North Dakota: 20 points (19.8)
13) South Dakota: 18 points
14) Louisiana: 17 points
15) Texas: 16 points
16) Alaska: 14 points (14.0)
17) Montana: 14 points (13.5)
18) Mississippi: 12 points
19) South Carolina: 11 points (10.6)
20) Indiana: 11 points (10.5)
21) Arizona: 10 points (10.1)
22) Missouri: 10 points (9.6)
23) Georgia: 8 points
24) North Carolina: 2 points
So, can the Red State Meme be put to rest now?
First Half of the Primary Season: What Patterns Can We Point To?
Rather than talk about each candidate's chances of winning the nomination in terms of percentages (e.g., so-and-so has a 99% chance of winning), let's consider some undeniable patterns.
Clinton does best in larger, more diverse states and "blue" areas (such as St. Louis and Atlanta). Sanders does best in smaller, less diverse states and "red" areas (such as rural Missouri and rural Georgia).
Clinton does better among registered Democrats. Sanders does better among independents.
Clinton does better in primaries. Sanders does better in caucuses.
Most of the remaining contests are closed and most are primaries. The remaining contests with 100+ delegates are WA, NY, MD, PA, CA and NJ. WA has a caucus and the rest have primaries.
So, is there any reason to believe those various patterns will get flipped upside down?
I was told by another poster that a thread I started isn't showing up on page 1...
...even though he/she just posted a comment. Here's the thread: http://www.democraticunderground.com/12511460282#post15
Map: What the U.S. Actually Looks Like Politically-Speaking
" target="_blank">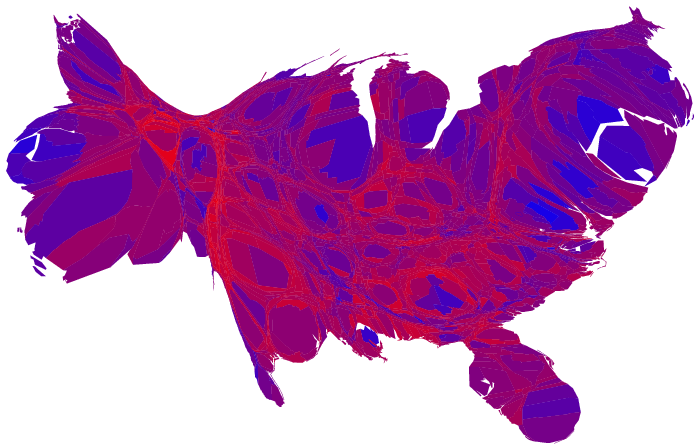
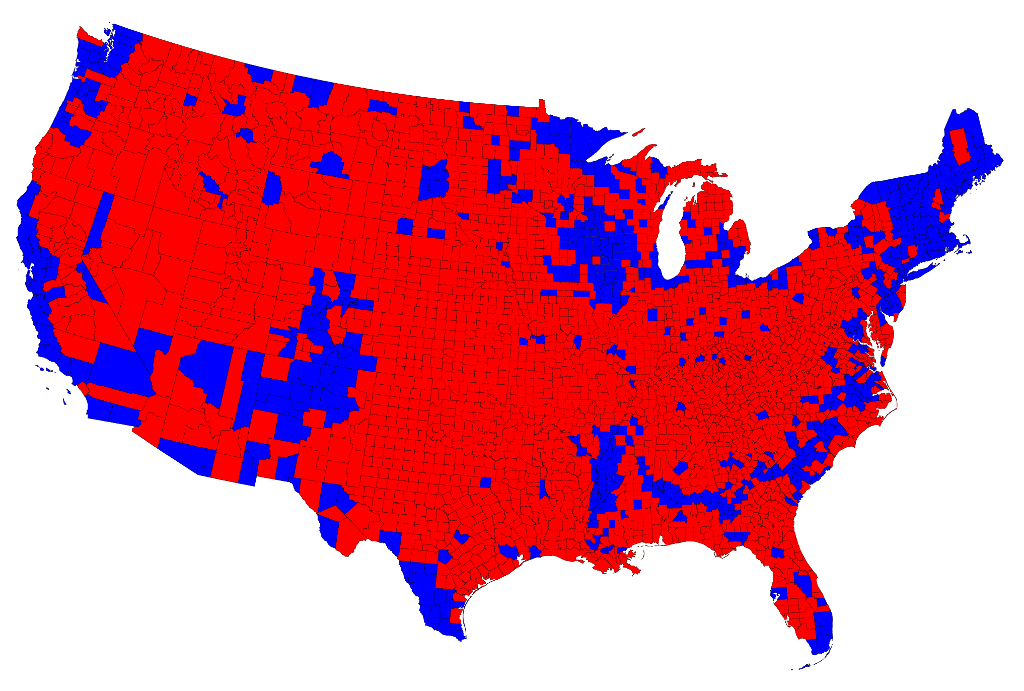
Following the 2000 Bush v Gore debacle, a map I recall Bush supporters promoting looked like the one below. Hopefully we can all understand why it's so misleading and why similar mapping of the 2016 Primary is equally misleading. Giving the impression that all counties are equal (as if 1000 people is the same as 1000000 people) and treating all margins of victory the same is an absurd way of trying to represent the US politically. Thus the need for maps like the one you see above.
Now, in the electoral college, margin of victory doesn't matter, but it's still good to have a proper understanding of what the US looks like politically, as well as an understanding of what areas may potentially shift/flip. Showing simple state-by-state blue-red maps (or, worse, county-by-county blue-red maps) does a disservice. It promotes misinformation. Let's not be like the 2000 Bush supporters who proudly displayed maps like the one below.
" target="_blank">
#1 rule of political real estate: demographics, demographics, demographics
I keep reading posts in which references are made to the number of states each Democratic candidate has won. Or posts referring to the likelihood that Sanders will win a majority of the states going forward, absent any useful context. I also see people posting a map that has Clinton-won states in one color and Sanders-won states in another color (used either to suggest one candidate is only popular in a certain area or to suggest that the race is closer than it is). And then there's the still-popular meme about "Dixieland/Confederacy/Evangelical South." Finally, there's the posts stating that not being able to win certain states in the primary means the candidate won't be able to win those states in the general election.
Such posts have become so pervasive that I felt compelled to start a thread. Without even getting into the delegate math and which candidate is most likely to win the nomination (there's plenty of that discussion elsewhere), I just want to address the aforementioned types of posts. Some will think I'm a Clinton supporter, but I'm not. I just don't like seeing so many people being illogical.
I've addressed the Dixie-Clinton meme before in a couple of threads, but I'm going to touch on it one more time and then move on. Demographically-speaking, each of the states of the Deep South are more reflective of the overall Democratic electorate than each of the states Sanders has won (with the exception of Michigan). As I wrote following the Michigan primary, Michigan represents the first diverse, populous "blue" state primary of this campaign. Some are claiming that Michigan proves Clinton can't win outside of the Deep South, but the sample size is way too small. And it's important to not conflate the Democratic electorate of the Deep South with the overall electorate of the Deep South. Time will tell how much Clinton struggles outside of the Deep South. Just as time will tell how successful Sanders can be outside of New England and small caucus states that lack diversity. For now, we have one -- ONE -- data point (Michigan) where the candidates were separated by a mere 18,400 votes (out of more than 1.1 million ballots), so we can't make any determinations one way or another (especially given that it was an open primary). We aren't going to learn much from Utah, Idaho, Wyoming, Delaware, etc. But March 15 (Ohio, Illinois, Missouri, Florida and North Carolina) and Arizona on the 22nd will offer more data points. In April, there's New York, Maryland and Pennsylvania. Those are the states that will determine which narrative is true (Clinton can't win outside of the Deep South vs. Sanders can't win delegate-rich states that are relatively diverse).
I would like to think most folks understand the obvious flaw in simply tallying the number of states won, yet numerous posters seem to think that's a perfectly valid form of comparison. Likewise, suggesting that Sanders being likely to win a majority of the remaining 29 states (a prediction that I think has merit) equates to him being likely to win the nomination is rather foolish. I shouldn't even have to point out that some states have *way* more people/delegates than other states--so, no, not all states are equal. Again, I'm not wanting in this thread to engage in a discussion about who is most likely to win the nomination. I'm just pointing out that one of the arguments I keep coming across is terribly flawed.
Lastly, I want to address the simplistic electoral map I've seen posted more than once. I don't think simplistic, black and white thinking is something to promote or aspire to. I vividly recall a map that was quite popular among Bush supporters following the 2000 election. It showed a map of the US in which each *county* was red or blue depending on which candidate (Bush or Gore) had won a majority (or plurality) of that county's votes. The map, of course, was overwhelmingly red. Hopefully you all can immediately understand the enormous flaw with this perspective. Counties with more cows than people are given the same weight as every other county, including Los Angeles County and Cook County (the 2 most populous counties in the US). Also, it treats a 0.1% margin of victory the same as a 40% margin of victory. This is why there are a variety of cartograms. Wikipedia defines a cartogram as "a map in which some thematic mapping variable – such as travel time, population, or Gross National Product – is substituted for land area or distance. The geometry or space of the map is distorted in order to convey the information of this alternate variable." In the case of the 2016 Democratic primaries, some states that have voted so far would be made much smaller and others would be made much bigger. And instead of showing a state in a single solid color, it would show the state in various shades/mixes of the 2 candidate colors. You can view some examples below. The map in the lower right is likely the most accurate representation of the 2004 presidential election results, but I suspect many are put off by the unfamiliarity of it ("That's not what the US looks like." .
.
" target="_blank">
As for candidates losing states in the primary and then winning them in the general election, it happens frequently. If Clinton is the nominee, I don't have much doubt that she'll win the New England states, for instance. Anyway, regardless of which candidate one supports, it would be nice if logic and critical thought prevailed.
If Iowa and Massachusetts were virtual ties...
...so was Michigan. And Michigan represents the first diverse, populous blue state primary of this campaign. Some are claiming that Michigan proves Clinton can't win outside of the Deep South, but the sample size is way too small. And it's important to not conflate the Democratic electorate of the Deep South with the overall electorate of the Deep South.
Time will tell how much Clinton struggles outside of the Deep South. Just as time will tell how successful Sanders can be outside of New England and small caucus states that lack diversity. For now, we have 1 data point (Michigan) where the candidates were separated by a mere 20,000 votes (out of more than 1 million ballots), so we can't make any determinations one way or another.
We aren't going to learn much from Utah, Idaho, Wyoming, Delaware, etc. But March 15 (Ohio, Illinois, Missouri, Florida and North Carolina) and Arizona on the 22nd will offer more data points. In April, there's New York, Maryland and Pennsylvania. Those are the states that will determine which narrative is true (Clinton can't win outside of the Deep South vs. Sanders can't win delegate-rich states that are relatively diverse).
Clinton is still a heavy favorite, but...
...there's now a glimmer of hope for Sanders. Winning MI suggests that Sanders can conceivably win OH, IL, MO, PA and states with similar demographics. Or it could prove to be a fluke--March 15th primaries (particularly OH, IL and MO) will provide a clue. Clinton is still a heavy favorite, as even today her delegate lead grew with her blowout victory in MS (and some really big states remain that favor Clinton). But the narrative will shift for the time being.
Harry Enten of 538 just published a good summary.
I said many months ago that the race will essentially be over by mid-March, and I still believe that (purely from a delegate math standpoint). But Sanders is making Clinton sweat, which is good for a Democratic Party that has shifted rightward over the years and has kowtowed to right wing ideologues.
Michigan: The First Bellwether
None of the Democratic primary/caucus results thus far have been very surprising. Michigan is the first state other than Texas and Georgia that has more than 100 pledged delegates. While Michigan's demographics don't mirror US demographics, Michigan is more representative than other states that have voted thus far (though you can make the case that some of the southern states are more representative of the Democratic electorate specifically).
A win by Sanders would change the narrative from "Clinton's got this" to "Clinton probably still has this but maybe not." A double digit win by Sanders would shift the narrative even more.
A narrow margin of victory for Clinton won't change the narrative, per se, but it would give the Sanders campaign a glimmer of hope.
A substantial margin of victory for Clinton will confirm what most already suspect, which is that the race is essentially over.
Profile Information
Member since: Wed Aug 19, 2015, 04:47 AMNumber of posts: 10,721