Welcome to DU! The truly grassroots left-of-center political community where regular people, not algorithms, drive the discussions and set the standards. Join the community: Create a free account Support DU (and get rid of ads!): Become a Star Member Latest Breaking News General Discussion The DU Lounge All Forums Issue Forums Culture Forums Alliance Forums Region Forums Support Forums Help & Search

Ocelot II

(115,526 posts)
23. All the graph tells you is that 67% of the hospitalized people
Fri Oct 29, 2021, 01:07 PM
Oct 2021

were not vaccinated, and that 33% were. What it doesn't tell you is the age or condition of the vaccinated people who were hospitalized, or what percentage of the total population is vaccinated. That's why the graph, while not false, can be mistakenly interpreted to suggest that the vaccines aren't working.

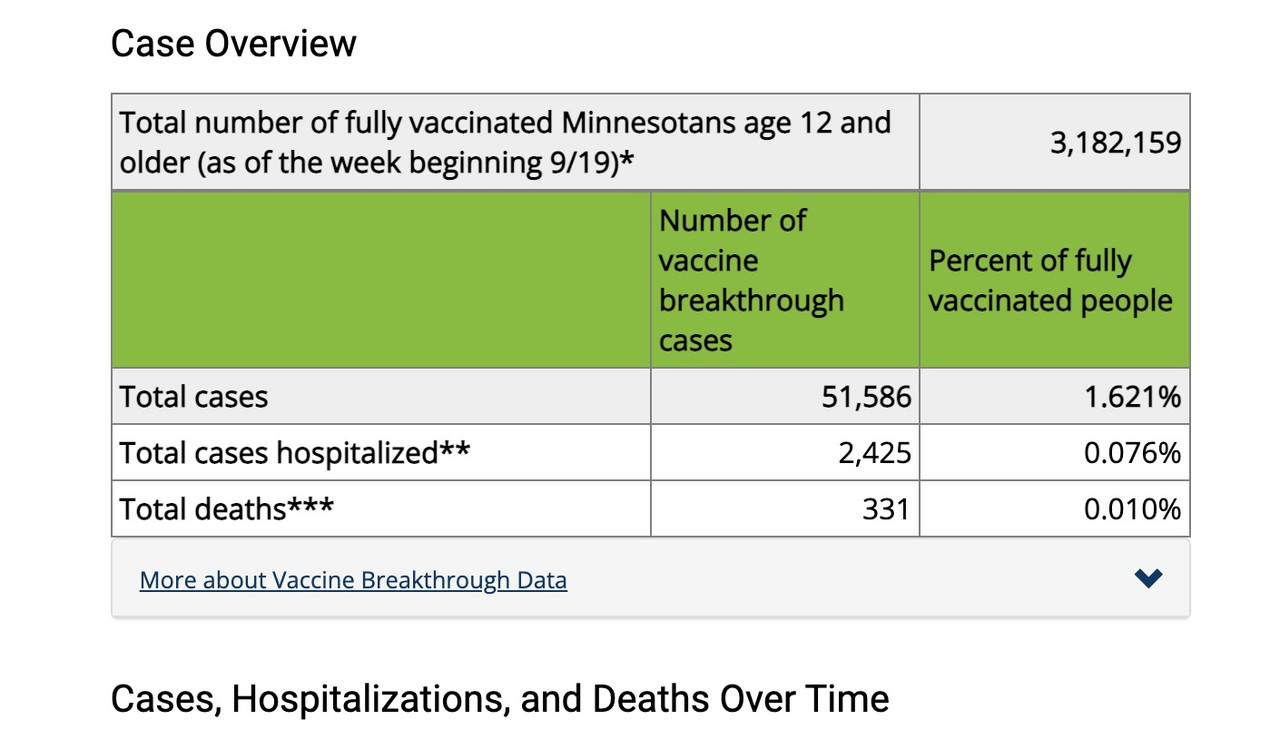
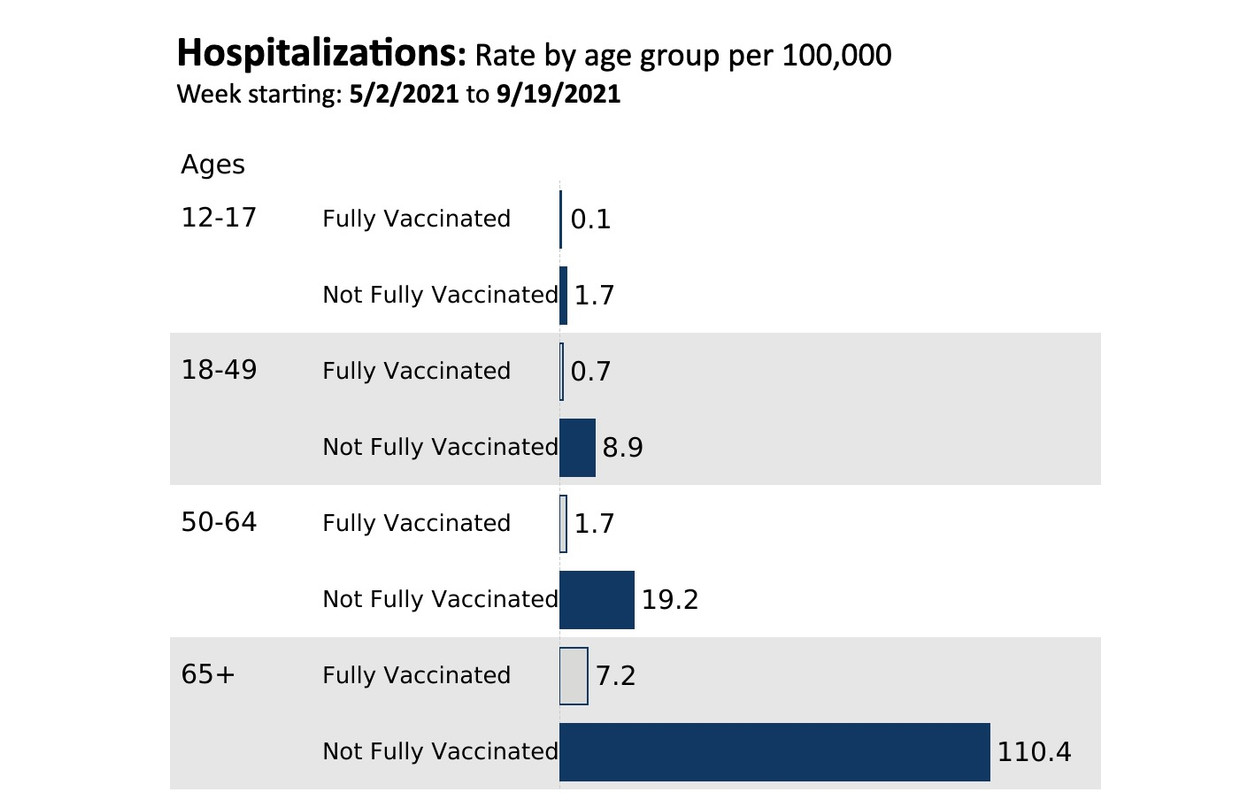
Here are a couple of graphs from my state health department, linked in my previous post, that offer a little better information about age and vaccination status. They won't reflect the exact situation in your area but they're at least an example of the efficacy of the vaccines and how they significantly reduce hospitalization rates in all age groups.


The higher the percentage of vaccinated people in a particular area, Ocelot II Oct 2021 #1
Good point but still curious about the high hospitalizations Laura PourMeADrink Oct 2021 #2
That's pretty obvious - if you don't get vaccinated you're more likely to get covid and Ocelot II Oct 2021 #6
It's amazing how many people don't get basic math. nt Phoenix61 Oct 2021 #3
Yeah well my husband and I both lost our fathers to covid Laura PourMeADrink Oct 2021 #13
I'm sorry for your loss. It wasn't meant as snark. Phoenix61 Oct 2021 #14
Thanks. All good. Laura PourMeADrink Oct 2021 #19
I don't think snark was intended (and my condolences for your loss), Ocelot II Oct 2021 #15
I must be one of those people. You are saying that you can't interpret the graph Laura PourMeADrink Oct 2021 #17
Yes, and that's because so many people in the total population were vaccinated. Ocelot II Oct 2021 #20
You are saying YES, you can NOT simply subtract 67% (unvaccinated) from 100% to get vaccinated Laura PourMeADrink Oct 2021 #21
All the graph tells you is that 67% of the hospitalized people Ocelot II Oct 2021 #23
Thanks, looked at this before. Headings were confusing but looking at it again, it sounds like MN Laura PourMeADrink Oct 2021 #24
Age trends here on hospitalizations Laura PourMeADrink Oct 2021 #5
That makes sense - older people are more likely to be vaccinated. Ocelot II Oct 2021 #9
What point do you want to make with that graph? Hav Oct 2021 #10
Austin has gone from stage 5 to stage 3. ananda Oct 2021 #4
Do businesses require masks? I don't know of any place here that does. Laura PourMeADrink Oct 2021 #7
I'd be mighty suspicious of any numbers in Texas. lagomorph777 Oct 2021 #8
I hear you. But surely, surely they aren't jacking up Laura PourMeADrink Oct 2021 #11
Oh, heavens no. lagomorph777 Oct 2021 #12
Really need more information to draw conclusions. Mariana Oct 2021 #16
Agree. Need age breakdown at least of the people hospitalized Laura PourMeADrink Oct 2021 #18
The numbers for here in Boulder County Colorado Ohio Joe Oct 2021 #22
thanks! Unless I missed it, didn't see any data on hospitalizations by vaccine status. did you? Laura PourMeADrink Oct 2021 #25
No, it is not there and I do not see it on the site at all Ohio Joe Oct 2021 #26
You are so lucky!!!! Sounds like heaven. Laura PourMeADrink Oct 2021 #27
Latest Discussions»General Discussion»Anyone from a highly vacc...»Reply #23