Ichingcarpenter
 (1000+ posts)
Send PM |
Profile |
Ignore
(1000+ posts)
Send PM |
Profile |
Ignore
|
Fri Oct-14-11 03:42 AM
Original message |
| This is a rather striking. tax income chart |
|
Edited on Fri Oct-14-11 03:44 AM by Ichingcarpenter
This is rather striking... only the top 5% highest earners (and mainly the top 1% earners) have seen their after-tax real income grow at a faster pace than real GDP per capital 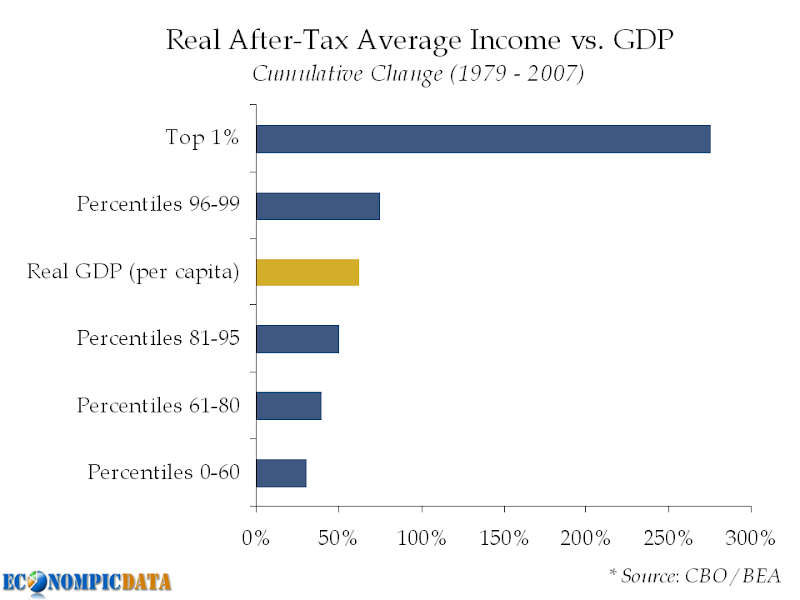 http://econompicdata.blogspot.com/2010/06/after-tax-income-distribution.html http://econompicdata.blogspot.com/2010/06/after-tax-income-distribution.html |
| sam11111
(638 posts)
Send PM |
Profile |
Ignore
|
Fri Oct-14-11 05:58 AM
Response to Original message |
| 1. needs redrawing for clarity - equal interval incomes, and incomes on X axis nt |
|
Edited on Fri Oct-14-11 06:00 AM by sam11111
Thanks for posting it - important info!
|
DU
AdBot (1000+ posts)     |
Sun Mar 01st 2026, 09:12 AM
Response to Original message |