| Latest | Greatest | Lobby | Journals | Search | Options | Help | Login |
|
|
|
This topic is archived. |
| Home » Discuss » General Discussion |
|
| liberal N proud
|
Thu Feb-24-11 07:23 AM Original message |
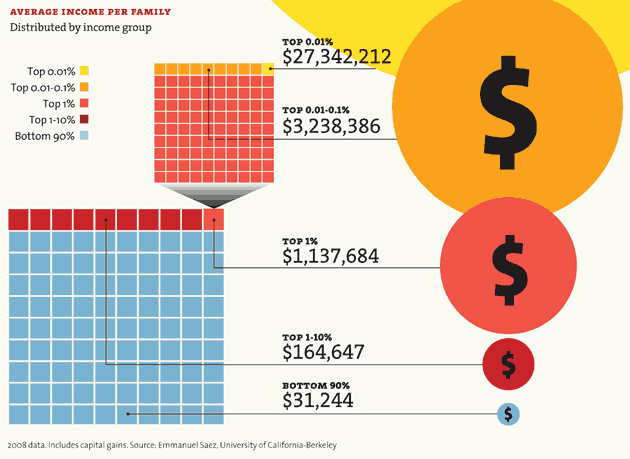
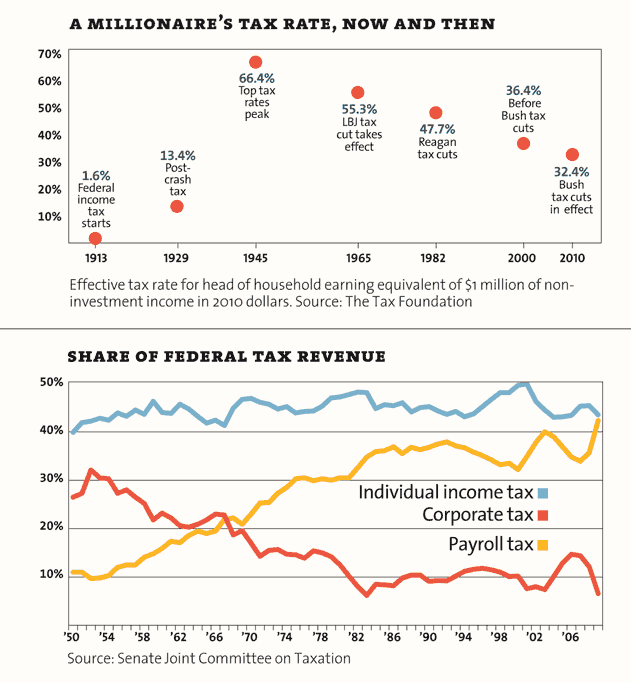
| How rich are the Super Rich? |
| Printer Friendly | Permalink | | Top |
| Warren Stupidity
|
Thu Feb-24-11 07:54 AM Response to Original message |
| 1. A shell of a democratic republic wrapped around a corrupt plutocracy |
| Printer Friendly | Permalink | | Top |
| vi5
|
Thu Feb-24-11 08:15 AM Response to Original message |
| 2. Seeing that literally makes me weep.... |
| Printer Friendly | Permalink | | Top |
| Bonhomme Richard
|
Thu Feb-24-11 09:06 AM Response to Original message |
| 3. A friend of mine is doing work for a guy that spent 25 million to buy |
| Printer Friendly | Permalink | | Top |
| DU
AdBot (1000+ posts) |
Sun Feb 22nd 2026, 03:50 AM Response to Original message |
| Advertisements [?] |
| Top |
| Home » Discuss » General Discussion |
|
Powered by DCForum+ Version 1.1 Copyright 1997-2002 DCScripts.com
Software has been extensively modified by the DU administrators
Important Notices: By participating on this discussion board, visitors agree to abide by the rules outlined on our Rules page. Messages posted on the Democratic Underground Discussion Forums are the opinions of the individuals who post them, and do not necessarily represent the opinions of Democratic Underground, LLC.
Home | Discussion Forums | Journals | Store | Donate
About DU | Contact Us | Privacy Policy
Got a message for Democratic Underground? Click here to send us a message.
© 2001 - 2011 Democratic Underground, LLC