| Latest | Greatest | Lobby | Journals | Search | Options | Help | Login |
|
|
|
This topic is archived. |
| Home » Discuss » Topic Forums » Election Reform |
|
| dzika
|
Sun Apr-10-05 01:10 PM Original message |
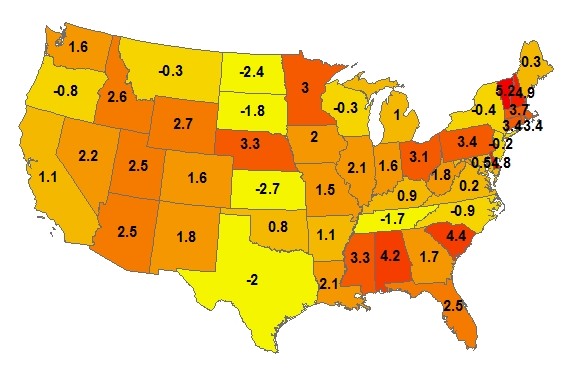
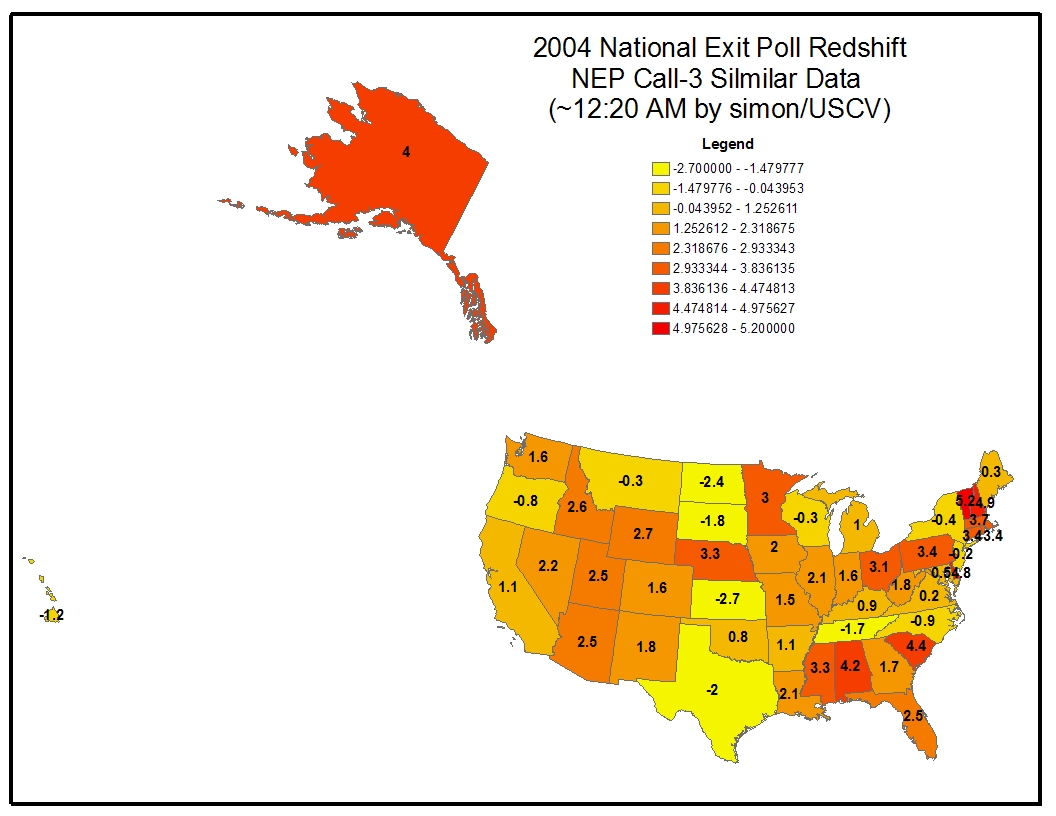
| Exit Poll Red Shift Geographical Map - using USCV's latest report |
| Printer Friendly | Permalink | | Top |
| smoogatz
|
Sun Apr-10-05 01:17 PM Response to Original message |
| 1. Could you explain it, please? |
| Printer Friendly | Permalink | | Top |
| dzika
|
Sun Apr-10-05 01:31 PM Response to Reply #1 |
| 4. US Count Votes defines it this way |
| Printer Friendly | Permalink | | Top |
| smoogatz
|
Sun Apr-10-05 02:09 PM Response to Reply #4 |
| 5. So, you'd expect any shift |
| Printer Friendly | Permalink | | Top |
| dzika
|
Sun Apr-10-05 02:29 PM Response to Reply #5 |
| 7. That is my understanding |
| Printer Friendly | Permalink | | Top |
| Nothing Without Hope
|
Sun Apr-10-05 01:24 PM Response to Original message |
| 2. And AK was 4 and HI was -1.2. There it all is. Chilling. |
| Printer Friendly | Permalink | | Top |
| dzika
|
Sun Apr-10-05 02:23 PM Response to Reply #2 |
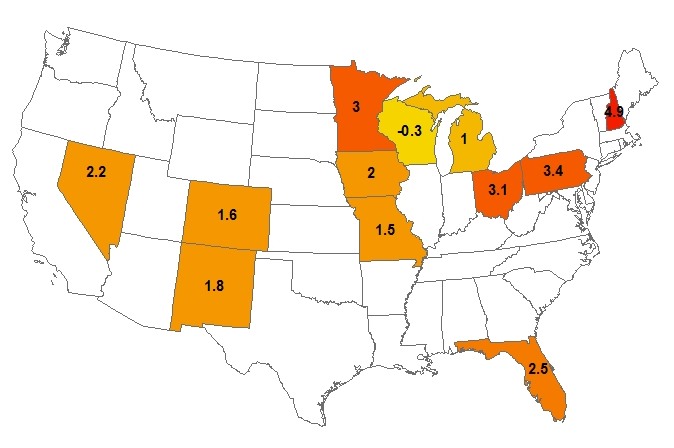
| 6. "Battleground" and "Critical" states |
| Printer Friendly | Permalink | | Top |
| Nothing Without Hope
|
Sun Apr-10-05 02:50 PM Response to Reply #6 |
| 10. Thanks! I hope we find what happened in each of those states |
| Printer Friendly | Permalink | | Top |
| ChiciB1
|
Sun Apr-10-05 01:29 PM Response to Original message |
| 3. I Haven't Seen This Yet.... |
| Printer Friendly | Permalink | | Top |
| TruthIsAll
|
Sun Apr-10-05 02:35 PM Response to Original message |
| 8. They are way off in NY. Check Freeman's numbers, based on Simon download |
| Printer Friendly | Permalink | | Top |
| TruthIsAll
|
Sun Apr-10-05 02:38 PM Response to Reply #8 |
| 9. Pre-election vs. exit polls vs. actuals. |
| Printer Friendly | Permalink | | Top |
| dzika
|
Sun Apr-10-05 03:10 PM Response to Reply #9 |
| 11. I noticed that too |
| Printer Friendly | Permalink | | Top |
| kster
|
Sun Apr-10-05 06:36 PM Response to Reply #11 |
| 15. Are there any maps |
| Printer Friendly | Permalink | | Top |
| dzika
|
Sun Apr-10-05 07:06 PM Response to Reply #15 |
| 17. I don't think so |
| Printer Friendly | Permalink | | Top |
| dzika
|
Mon Apr-11-05 10:01 AM Response to Reply #8 |
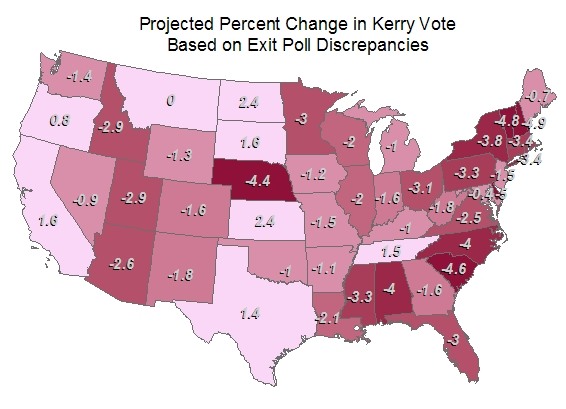
| 20. Kerry Percent Changed |
| Printer Friendly | Permalink | | Top |
| kansasblue
|
Sun Apr-10-05 04:41 PM Response to Original message |
| 12. how about added paper ballots vs unauditable voting states |
| Printer Friendly | Permalink | | Top |
| dzika
|
Sun Apr-10-05 07:04 PM Response to Reply #12 |
| 16. 47 states have some paper ballots |
| Printer Friendly | Permalink | | Top |
| msongs
|
Sun Apr-10-05 05:46 PM Response to Original message |
| 13. dems will do NOTHING to get meangful change, silly people..... |
| Printer Friendly | Permalink | | Top |
| Bill Bored
|
Sun Apr-10-05 06:02 PM Response to Original message |
| 14. This is nice, but I hope we can all agree on the numbers! |
| Printer Friendly | Permalink | | Top |
| dzika
|
Sun Apr-10-05 07:16 PM Response to Reply #14 |
| 18. negative red shift is blue shift |
| Printer Friendly | Permalink | | Top |
| Melissa G
|
Sun Apr-10-05 09:49 PM Response to Original message |
| 19. Thanks Dzika! n/t |
| Printer Friendly | Permalink | | Top |
| FogerRox
|
Mon Apr-11-05 11:10 AM Response to Reply #19 |
| 21. Ditto- thanks- graphics like this are great tool-they enable some viewers |
| Printer Friendly | Permalink | | Top |
| DU
AdBot (1000+ posts) |
Sun May 05th 2024, 07:52 AM Response to Original message |
| Advertisements [?] |
| Top |
| Home » Discuss » Topic Forums » Election Reform |
|
Powered by DCForum+ Version 1.1 Copyright 1997-2002 DCScripts.com
Software has been extensively modified by the DU administrators
Important Notices: By participating on this discussion board, visitors agree to abide by the rules outlined on our Rules page. Messages posted on the Democratic Underground Discussion Forums are the opinions of the individuals who post them, and do not necessarily represent the opinions of Democratic Underground, LLC.
Home | Discussion Forums | Journals | Store | Donate
About DU | Contact Us | Privacy Policy
Got a message for Democratic Underground? Click here to send us a message.
© 2001 - 2011 Democratic Underground, LLC