General Discussion
Related: Editorials & Other Articles, Issue Forums, Alliance Forums, Region ForumsHow do I make a chart on tax rates?
I want to make a chart showing the reduction in tax rates over the last 30 years. I tried looking up the income tax rates but the language was confusing and there were about 15k different categories for income tax. What numbers does everyone use when they make their charts? I am confused by this but want to get the best info so I can make a great graphic.
 = new reply since forum marked as read
Highlight:
NoneDon't highlight anything
5 newestHighlight 5 most recent replies
= new reply since forum marked as read
Highlight:
NoneDon't highlight anything
5 newestHighlight 5 most recent replies

Angry Dragon
(36,693 posts)there has been a graphic posted at DU before
Firebirds01
(576 posts)that has that? Like a database? Sorry for not knowing.
Angry Dragon
(36,693 posts)
JHB
(38,368 posts)I can point you to some things that might help, but can't do it this moment.
Angry Dragon
(36,693 posts)JHB
(38,368 posts)It's probably not exactly what you're looking for, but it's a place to start, and like me, you might have to just wing some things.
It has the website where the historical tax rates are available (yes there are different categories. Pick a useful one like Married Filing Jointly or Single and use that, if only to orient yourself and then figure out how to add (or leave out) things in a manner useful to what you are trying to present.
As an example, the graphs I have on that page: I made those from the inflation-adjusted thresholds where one tax bracket shifted to the next. That was back when there were lots of arguments about raising taxes on income over 250K (e.g., "is $250K 'rich'?"
 , and I was trying to show how we handled different income levels historically. It's easy to find charts of the historical top rate, but not of where various rates have fallen, so I had to do it myself. For example, in 1955 there were 24 tax brackets, and 16 of them affected incomes over the equivalent of 250K. "So, Mr. Teabagger, by your definitions, WE were a 'marxist' country back under Eisenhower. I'm curious: What did that make the Soviets?"
Note that my graphs don't show the rates, which can be a separate issue, just the bracket breakpoints. You might need to do something similar: focus on something you can show clearly so that you don't end up with a muddle by trying to show everything. Maybe you'll need two charts to cover one aspect then cover another, a sort of one-two punch. In the end, it'll depend on what you're trying to show.

JaneyVee
(19,877 posts)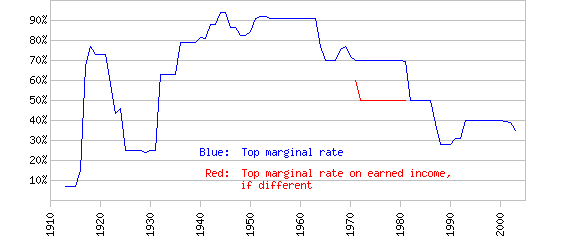
Firebirds01
(576 posts)I also found two sources based on the 'top marginal rate' mentioned above.
http://www.taxpolicycenter.org/taxfacts/displayafact.cfm?Docid=213
http://elsa.berkeley.edu/~saez/course/Labortaxes/taxableincome/taxableincome_attach.pdf
JHB
(38,368 posts)If you poke around that site some you should be able to find information on the standard deductions, but I don't have a URL handy.
Angry Dragon
(36,693 posts)how to get it to you
Firebirds01
(576 posts)the correct info once you mentioned the top marginal rate. If the links I listed below are no good, please let me know. Thanks so much.
Motown_Johnny
(22,308 posts)there are hundreds of them

Firebirds01
(576 posts)thanks