General Discussion
Related: Editorials & Other Articles, Issue Forums, Alliance Forums, Region ForumsInteractive GRAPH: Vaccine Hesitancy for COVID-19: State, County, and Local Estimates
Interactive graph at link--larger and has more details per counties in states.
Vaccine Hesitancy for COVID-19: State, County, and Local Estimates
https://aspe.hhs.gov/pdf-report/vaccine-hesitancy
04/06/2021
Home Vaccine Hesitancy for COVID-19...
Similar content
Vaccine Hesitancy for COVID-19: PUMA Estimates State, County, and Local Estimates of the Uninsured Population: Prevalence and Key Demographic Features Advisory Council January 2021 Meeting Presentation: COVID-19 Vaccine Implementation Characteristics of Homebound Older Adults: Potential Barriers to Accessing the COVID-19 Vaccine Issue Brief Advisory Council January 2021 Meeting Summary
To support state and local communication and outreach efforts, ASPE developed state, county, and sub-state level predictions of hesitancy rates using the most recently available federal survey data. This page includes an interactive map, a pdf file with a methodological description, and datasets for download.
The interactive map below shows estimates of the percent of the population in each county that may be vaccine hesitant. Additional data, including estimates of strong vaccine hesitancy and demographics can be viewed by clicking on an individual county. For estimates of vaccine hesitancy by PUMA, please click here. PUMAs are Public-Use Microdata Areas, local areas of roughly 100,000 people, as defined in the American Community Survey.
Link to tweet
?s=20
 = new reply since forum marked as read
Highlight:
NoneDon't highlight anything
5 newestHighlight 5 most recent replies
= new reply since forum marked as read
Highlight:
NoneDon't highlight anything
5 newestHighlight 5 most recent replies

Skittles
(172,902 posts)yup

riversedge
(81,554 posts)JI7
(93,908 posts)
Chicago1980
(1,968 posts)These people are stupid beyond dumb-ass.

OhioChick
(23,218 posts)Since their "Messiah" already got his.
Skittles
(172,902 posts)then, because he doesn't follow BASIC PREVENTION GUIDELINES, *GETS* the virus, gets the best TAXPAYER-FUNDED HEALTH CARE to beat it, then later SNEAKS OFF AND GETS THE VACCINE- the stupidity and hypocrisy of him and his brain--dead supporters is MIND-BOGGLING. 

Rhiannon12866
(258,910 posts)Did previous generations reject being vaccinated against smallpox or polio?? 

progree
(13,078 posts)https://minnesota.cbslocal.com/2021/04/14/police-man-drags-hutchinson-officer-with-car-hits-him-with-hammer-after-face-mask-dispute/
Hutchinson police say a 61-year-old man is in custody after allegedly dragging an officer with his vehicle while simultaneously striking him with a hammer following a dispute about face masks at a Menards store.
Police were called to the store just before 2 p.m. Wednesday after an employee was attacked by the suspect with a piece of lumber. The suspect left, and was soon spotted by an officer in the parking lot of a nearby Walmart.
The suspect led the officer on a slow-speed chase that ended near the Hutchinson Mall off Highway 15 and Freemont Avenue Southwest. The officer approached the car, then became stuck in the driver’s side window. The suspect sped off with the officer hanging on, and then struck him on the head with a hammer.
The officer is in stable condition at an area hospital. The McLeod County Sheriff’s Office is leading the investigation.
It's getting more and more kooky around here.
I live well under 10 miles from all five of these police killings: Daunte Wright, George Floyd, Justine Ruszczyk Damond, Philando Castille, and Jamar Clark. I could probably add to the list. Not that the above Hutchinson story has anything to do with a cop killing someone, but it reminded me of these somehow, and I sure get weary of the riots and lootings that go with some of these too ... we had some beloved neighborhoods largely destroyed and lots of places still partly boarded up and reboarded up and and it just is so chaotic and it didn't used to be that way.
Edited to add - I don't blame POC being mad as hell, it's just not fun for anyone living here.

Victor_c3
(3,557 posts)The areas I would have guessed would have been hesitant are the same ones that vote republican.
Klaralven
(7,510 posts)Especially the one between North and South Dakota. Or the one between Utah and southeast Idaho?
Are Moorhead and Fargo that different?
progree
(13,078 posts)These should be taken with a pretty big grain of salt, given the layers of abstraction between these models and the actual views of the population. (You've got two different surveys, a model to connect the two, and then further statistical tricks to get county-level approximations.) One warning sign: the map of county-level hesitancy estimates shows pretty big differences on state lines. The idea that Minnesota as a whole might have different levels of vaccine hesitancy than North Dakota as a whole is plausible. But eastern North Dakota having hesitancy rates two to three times higher than similarly rural counties just over the Red River? That suggests something's up with the data.
...
(Though this data is by county, you might notice lots of big blocks that are the same color. That's because this data really exists at the level of the Public Use Microdata Area, or PUMA, an under-used piece of Census geography with no fewer than 100,000 people; in rural areas PUMAs are made up of blocks of counties, while in urban areas they follow city or neighborhood boundaries. The county-level data is extrapolated from the PUMAs.)
blah blah blah snore
Klaralven
(7,510 posts)versus being connected to public sewer and water.
Response to progree (Reply #11)
Klaralven This message was self-deleted by its author.
dalton99a
(95,350 posts)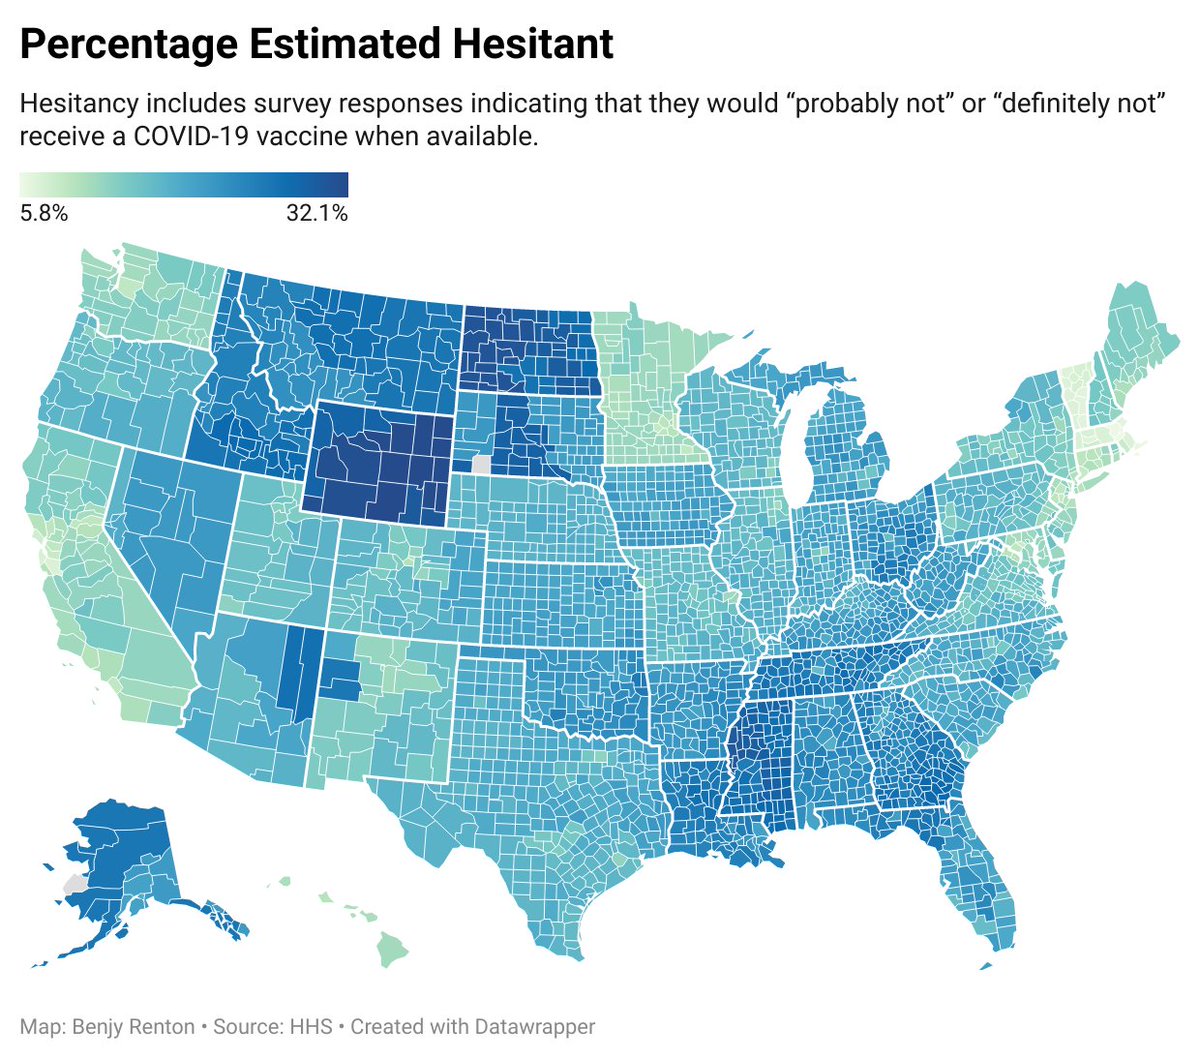
Response to riversedge (Original post)
brooklynite This message was self-deleted by its author.
yardwork
(69,648 posts)bullwinkle428
(20,663 posts)progree
(13,078 posts)

Kick in to the DU tip jar?
This week we're running a special pop-up mini fund drive. From Monday through Friday we're going ad-free for all registered members, and we're asking you to kick in to the DU tip jar to support the site and keep us financially healthy.
As a bonus, making a contribution will allow you to leave kudos for another DU member, and at the end of the week we'll recognize the DUers who you think make this community great.