General Discussion
Related: Editorials & Other Articles, Issue Forums, Alliance Forums, Region ForumsStates ranked by % of COVID-19 vaccines administered: May 7
Last edited Sat May 8, 2021, 08:46 AM - Edit history (1)
https://www.beckershospitalreview.com/public-health/states-ranked-by-percentage-of-covid-19-vaccines-administered.htmlVirginia is 14th!

 = new reply since forum marked as read
Highlight:
NoneDon't highlight anything
5 newestHighlight 5 most recent replies
= new reply since forum marked as read
Highlight:
NoneDon't highlight anything
5 newestHighlight 5 most recent replies

Sanity Claws
(22,422 posts)Don't they usually rank last in educational attainment too?

Buckeye_Democrat
(15,527 posts)Seems to happen a lot.
jimfields33
(19,382 posts)It show me that all 50 states will be over 80 percent in 3 months if not more. I think this has been pretty successful. Congratulations President Biden.
Buckeye_Democrat
(15,527 posts)... in each state, not the percentage of vaccinated people.
There's often a correlation, though.
Edit: "Percentage of distributed vaccines that have been administered" is the phrase used.
jimfields33
(19,382 posts)I still think president Biden is doing great. We’re a huge country and working to get everyone vaccinated is a huge undertaking.
Buckeye_Democrat
(15,527 posts)I'm so pleased with Joe!!

ratchiweenie
(8,225 posts)Buckeye_Democrat
(15,527 posts)... there's still progress!
I hope more medical doctors will contact their patients. My PCP (who I haven't seen for many months) was recently authorized to administer them, and her office was leaving messages with me multiple times a day about it! At least until I called them back to inform them that I was already vaccinated at a nearby pharmacy.
With full FDA approval soon, I hope we'll get more of an uptick.
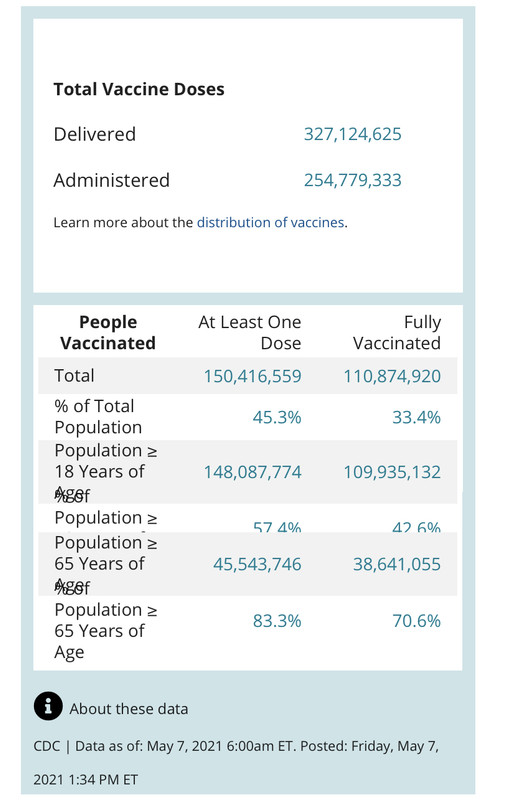
The numbers aren't too bad among adults, the only demographic eligible for them at this point. That will change soon too.
Adults: 57.4% at one dose, 42.6% fully vaccinated.
Adults, 65+ years old: 83.3% at one dose, 70.6% fully vaccinated.
https://covid.cdc.gov/covid-data-tracker/#vaccinations
ratchiweenie
(8,225 posts)around.
Buckeye_Democrat
(15,527 posts)Might never reach it, really, but every new vaccination will help lower the infection rates. And hospitalizations/deaths by a lot!
I don't like the slowdowns, but I'm still pretty optimistic with our more competent leadership now!
Sanity Claws
(22,422 posts)If I understand it correctly, the percentages refer to doses distributed to the state that have been used, not the percentage of the population actually vaccinated. These numbers show that a lot of vaccine has been wasted. Sigh!
I've been following the vaccination rate in NYS and I think about 35% have been fully vaccinated and around 45% have had at least one dose. The rate in NYC is slightly higher than in NYS as a whole.

littlemissmartypants
(34,100 posts)I was told that some of those who have scheduled to get the jab haven't shown up and the vaccine is then wasted. I wish people knew that particular. I don't know if it would influence the no shows but it does make us all more educated about the process.
❤

Delphinus
(12,534 posts)I will keep this reference.
texasfiddler
(2,199 posts)
Liberal In Texas
(16,330 posts)delivered to the states.
I would like to know the % of people walking around unvaccinated.
Duppers
(28,470 posts)Last edited Sat May 8, 2021, 09:25 AM - Edit history (1)
Thank you so much!


Scrivener7
(59,846 posts)Big difference.

JanMichael
(25,725 posts)This ranking (same site) is closer related to sanity of population:
https://www.beckershospitalreview.com/public-health/states-ranked-by-percentage-of-population-vaccinated-march-15.html
The other ranking just shows, maybe, the effectiveness of the state agency responsible for distribution of available doses.
Scrivener7
(59,846 posts)vaccinating adults. 22% of the population is under 18.
Buckeye_Democrat
(15,527 posts)... like nearly every other state ranking that I've ever seen.
And there's MS and AL at the bottom, which is also a common occurrence in various rankings.

ProfessorGAC
(77,019 posts)Right around 50% of people vaxxed. About the same as the US as a whole.
HUAJIAO
(2,730 posts)It means 50% of the vaccines that have been distributed SO FAR have been used. That is a huge difference.
ProfessorGAC
(77,019 posts)I live in Illinois. I check the vax numbers every few days.
As of Thursday night, about 9.5 million doses had been administered.
About 6 million people have gotten at least one dose.
We have a little over 12 million people. So, about 50%.
My numbers had nothing to do with the OP data.
HUAJIAO
(2,730 posts)
ProfessorGAC
(77,019 posts)Back at ya!
Buckeye_Democrat
(15,527 posts)... I'll expect to finally see Ohio at the top! 
It was still near the top for "manufacturing", in one recent list that I saw.
I know that I've seen Illinois near the top in some state rankings, but I can't remember the details of them now!
CottonBear
(21,615 posts)
https://www.beckershospitalreview.com/public-health/states-ranked-by-percentage-of-covid-19-vaccines-administered.html
States ranked by percentage of COVID-19 vaccines administered: May 7
Maia Anderson - Updated 23 hours ago
New Mexico has administered the highest percentage of COVID-19 vaccines it has received, according to the CDC's COVID-19 vaccine distribution and administration data tracker.
The CDC's data tracker compiles data from healthcare facilities and public health authorities. It updates daily to report the total number of COVID-19 vaccines that have been distributed to each state and the total number each state has administered.
As of 6 a.m. EDT May 6, a total of 324,610,185 vaccine doses had been distributed in the U.S., and 251,973,752 had been administered, or 77.62 percent. Additionally, 149,462,265 people had received at least one dose of the vaccine, and 108,926,627 had been fully vaccinated. That means 45 percent of the U.S. population had received at least one dose of the vaccine, and 32.8 percent had been fully vaccinated.
Below are the states and Washington, D.C., ranked by the percentage of COVID-19 vaccines they've administered of those that have been distributed to them. Some numbers may not reflect the actual number of vaccines administered, as coding problems and data lags have hindered efforts to accurately count and publicly report how many doses are administered daily in some states.
more...
Here’s the info for Georgia (I’m going to assume that Moderna and Pfizer would be counted as two vaccines, but a number of people are not returning for the second dose, thus further driving down the percentage of vaccine doses administered.)
49. Georgia
Doses distributed to state: 9,888,925
Doses administered: 6,552,673
Percentage of distributed vaccines that have been administered: 66.26
Duppers
(28,470 posts)Corrected it.
CottonBear
(21,615 posts)Duppers
(28,470 posts)Thanks again. 
Lovie777
(23,284 posts)California at 25 yippee!
Distributed - 41,020,990
Administered - 31,997,303
Previous population - approximately 40 million
Population republican's census 2020 - 39.9 million
great immigration from California - 185,000
Buckeye_Democrat
(15,527 posts)... of infection per population in the entire country. That's the state's most impressive Covid-related accomplishment right now.

Unless the guidelines are later changed in my state, Ohio won't ease restrictions until we're below about 3.57 new daily cases per 100,000 population (50 new cases over a two-week period per 100k) ... which not even California has reached yet. But California is close!

Johonny
(26,389 posts)So the difference in the two numbers is not a useful number. It implies incompetency in the government not to be using the resources given them. But there's a reason for the difference not due to incompetence. It's not going to near each other so long as a state keeps giving out a large amount of number first shots.
California has done 63% of the eligible population now with one dose. And 43% both doses. Which is much more useful information.
Buckeye_Democrat
(15,527 posts)Not just because even one dose is helpful, but it also gives an indication of future "fully vaccinated" numbers.

malaise
(297,012 posts)K&R

alittlelark
(19,142 posts)


Duppers
(28,470 posts) 
marmar
(79,872 posts)https://www.beckershospitalreview.com/public-health/states-ranked-by-percentage-of-population-vaccinated-march-15.html
As of 6 a.m. EDT May 6, a total of 108,926,627 Americans had been fully vaccinated, or 32.8 percent of the country's population, according to the CDC's data.
Below are the states and Washington, D.C., ranked by the percentage of their population that has been fully vaccinated against COVID-19, according to the CDC. To view the states ranked by percentage of the population who've received at least one dose, click here.
1. Maine
Number of people fully vaccinated: 573,346
Percentage of population fully vaccinated: 42.65
2. Connecticut
Number of people fully vaccinated: 1,493,571
Percentage of population fully vaccinated: 41.89
3. Vermont
Number of people fully vaccinated: 253,677
Percentage of population fully vaccinated: 40.65
4. New Mexico
Number of people fully vaccinated: 835,272
Percentage of population fully vaccinated: 39.84
5. Massachusetts
Number of people fully vaccinated: 2,745,439
Percentage of population fully vaccinated: 39.83
6. Rhode Island
Number of people fully vaccinated: 415,637
Percentage of population fully vaccinated: 39.23
7. New Jersey
Number of people fully vaccinated: 3,462,111
Percentage of population fully vaccinated: 38.98
8. South Dakota
Number of people fully vaccinated: 341,966
Percentage of population fully vaccinated: 38.66
9. New York
Number of people fully vaccinated: 7,324,286
Percentage of population fully vaccinated: 37.65
10. Wisconsin
Number of people fully vaccinated: 2,183,603
Percentage of population fully vaccinated: 37.5
11. Hawaii
Number of people fully vaccinated: 524,415
Percentage of population fully vaccinated: 37.04
12. Minnesota
Number of people fully vaccinated: 2,064,938
Percentage of population fully vaccinated: 36.61
13. Iowa
Number of people fully vaccinated: 1,153,092
Percentage of population fully vaccinated: 36.55
14. Alaska
Number of people fully vaccinated: 265,869
Percentage of population fully vaccinated: 36.34
15. Maryland
Number of people fully vaccinated: 2,188,349
Percentage of population fully vaccinated: 36.2
16. Virginia
Number of people fully vaccinated: 3,048,290
Percentage of population fully vaccinated: 35.71
17. Colorado
Number of people fully vaccinated: 2,045,903
Percentage of population fully vaccinated: 35.53
18. Nebraska
Number of people fully vaccinated: 681,718
Percentage of population fully vaccinated: 35.24
19. Delaware
Number of people fully vaccinated: 338,973
Percentage of population fully vaccinated: 34.81
20. Pennsylvania
Number of people fully vaccinated: 4,433,300
Percentage of population fully vaccinated: 34.63
21. Washington
Number of people fully vaccinated: 2,635,610
Percentage of population fully vaccinated: 34.61
22. Michigan
Number of people fully vaccinated: 3,413,191
Percentage of population fully vaccinated: 34.18
23. Ohio
Number of people fully vaccinated: 3,990,903
Percentage of population fully vaccinated: 34.14
24. Montana
Number of people fully vaccinated: 359,511
Percentage of population fully vaccinated: 33.64
25. North Dakota
Number of people fully vaccinated: 255,367
Percentage of population fully vaccinated: 33.51
26. Kansas
Number of people fully vaccinated: 970,096
Percentage of population fully vaccinated: 33.3
27. Kentucky
Number of people fully vaccinated: 1,487,289
Percentage of population fully vaccinated: 33.29
28. Oregon
Number of people fully vaccinated: 1,391,319
Percentage of population fully vaccinated: 32.99
29. California
Number of people fully vaccinated: 13,017,480
Percentage of population fully vaccinated: 32.95
30. Illinois
Number of people fully vaccinated: 4,097,876
Percentage of population fully vaccinated: 32.34
31. District of Columbia
Number of people fully vaccinated: 227,589
Percentage of population fully vaccinated: 32.25
32. West Virginia
Number of people fully vaccinated: 561,952
Percentage of population fully vaccinated: 31.36
33. North Carolina
Number of people fully vaccinated: 3,281,376
Percentage of population fully vaccinated: 31.29
34. Florida
Number of people fully vaccinated: 6,664,283
Percentage of population fully vaccinated: 31.03
35. Oklahoma
Number of people fully vaccinated: 1,218,612
Percentage of population fully vaccinated: 30.8
36. Arizona
Number of people fully vaccinated: 2,222,457
Percentage of population fully vaccinated: 30.53
37. New Hampshire
Number of people fully vaccinated: 411,500
Percentage of population fully vaccinated: 30.26
38. Nevada
Number of people fully vaccinated: 922,995
Percentage of population fully vaccinated: 29.97
39. Missouri
Number of people fully vaccinated: 1,796,371
Percentage of population fully vaccinated: 29.27
40. South Carolina
Number of people fully vaccinated: 1,488,726
Percentage of population fully vaccinated: 28.91
41. Texas
Number of people fully vaccinated: 8,365,487
Percentage of population fully vaccinated: 28.85
42. Indiana
Number of people fully vaccinated: 1,940,977
Percentage of population fully vaccinated: 28.83
43. Wyoming
Number of people fully vaccinated: 165,555
Percentage of population fully vaccinated: 28.61
44. Idaho
Number of people fully vaccinated: 508,582
Percentage of population fully vaccinated: 28.46
45. Louisiana
Number of people fully vaccinated: 1,303,293
Percentage of population fully vaccinated: 28.04
46. Arkansas
Number of people fully vaccinated: 813,144
Percentage of population fully vaccinated: 26.94
47. Tennessee
Number of people fully vaccinated: 1,802,156
Percentage of population fully vaccinated: 26.39
48. Georgia
Number of people fully vaccinated: 2,763,645
Percentage of population fully vaccinated: 26.03
49. Utah
Number of people fully vaccinated: 827,388
Percentage of population fully vaccinated: 25.81
50. Mississippi
Number of people fully vaccinated: 729,619
Percentage of population fully vaccinated: 24.52
51. Alabama
Number of people fully vaccinated: 1,201,303
Percentage of population fully vaccinated: 24.5
Buckeye_Democrat
(15,527 posts)... after states with higher percentages of Native Americans were in the lead initially. They were very fast to get vaccinated compared to other ethnic groups.
Johonny
(26,389 posts)As a large percentage of the population is not eligible to be vaccinated. The percentage of the eligible population should also be used to understand how a state is doing. States with younger populations appear worse in this type of table.
Duppers
(28,470 posts)Thanks for taking time to do this! Much appreciated.
A pattern is obvious there.
lindysalsagal
(22,972 posts)