Update: Recovery Measures (four charts)
Update: Recovery Measures
by Bill McBride
<...>
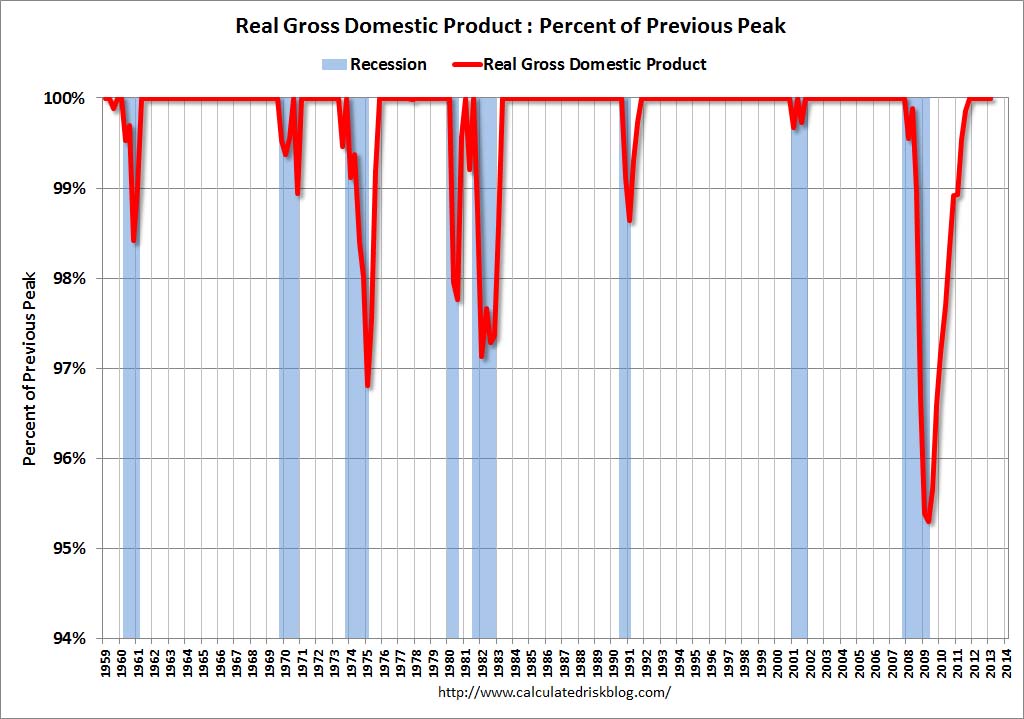
At the worst point - in Q2 2009 - real GDP was off 4.7% from the 2007 peak...Real GDP returned to the pre-recession peak in Q4 2011, and has hit new post-recession highs for six consecutive quarters.
<...>
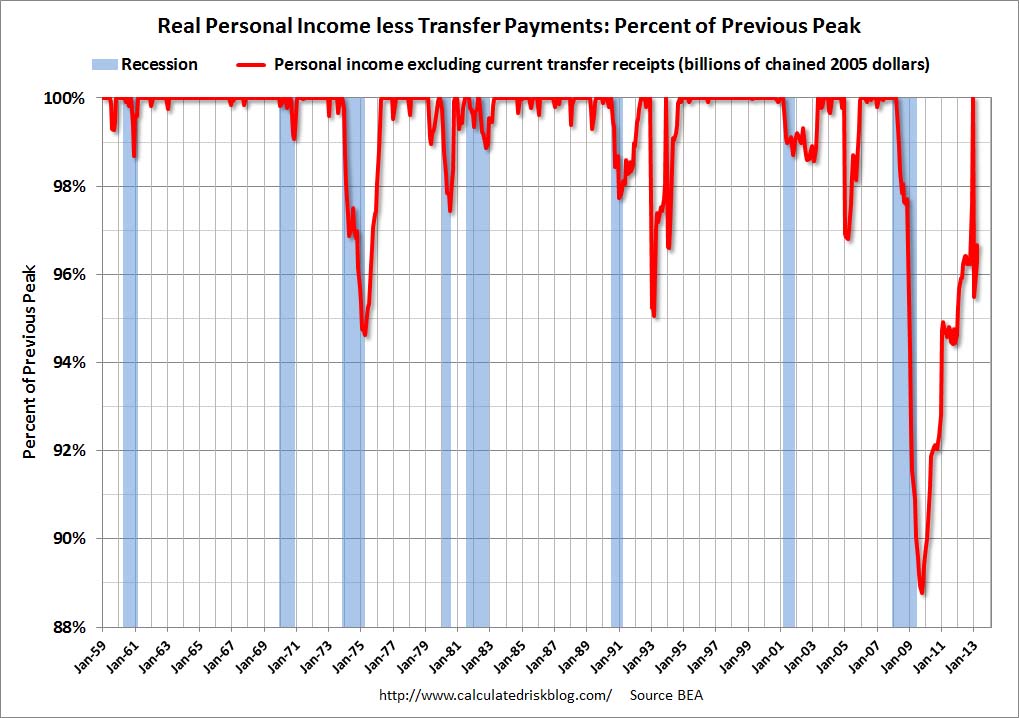
This graph shows real personal income less transfer payments...This measure was off 11.2% at the trough in October 2009...returned to the pre-recession peak in December, but that was due to a one time surge in income as some high income earners accelerated earnings to avoid higher taxes in 2013. Real personal income less transfer payments declined sharply in January, and were 3.3% below the previous peak in March.
<...>
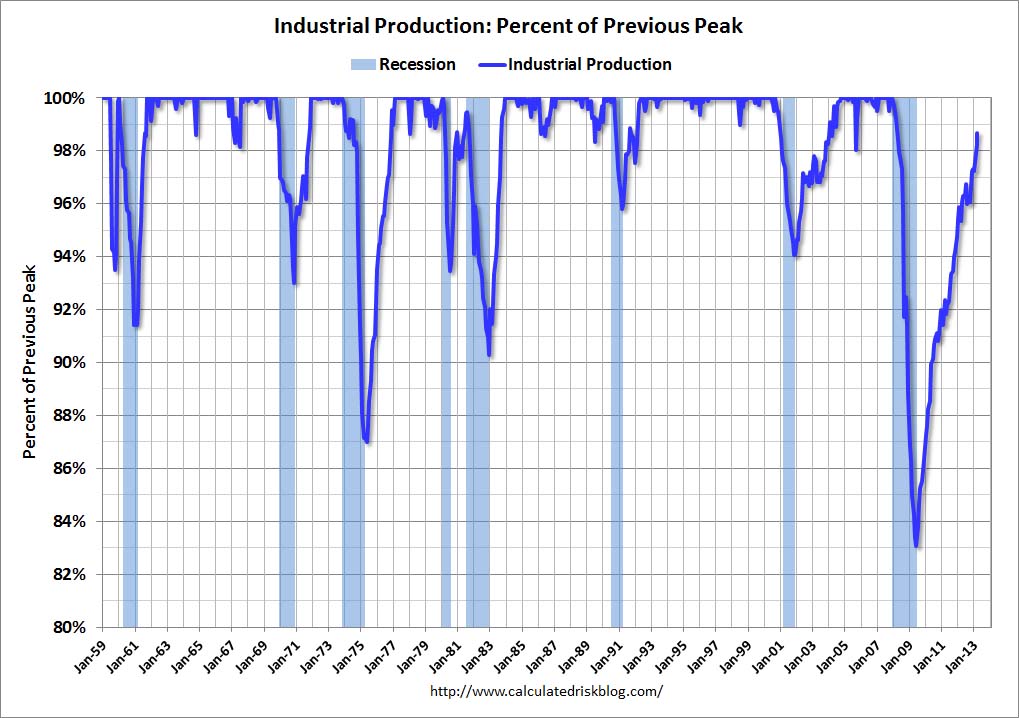
Industrial production was off over 17% at the trough in June 2009, and has been one of the stronger performing sectors during the recovery...industrial production is still 1.3% below the pre-recession peak. This indicator will probably return to the pre-recession peak in 2013.
<...>
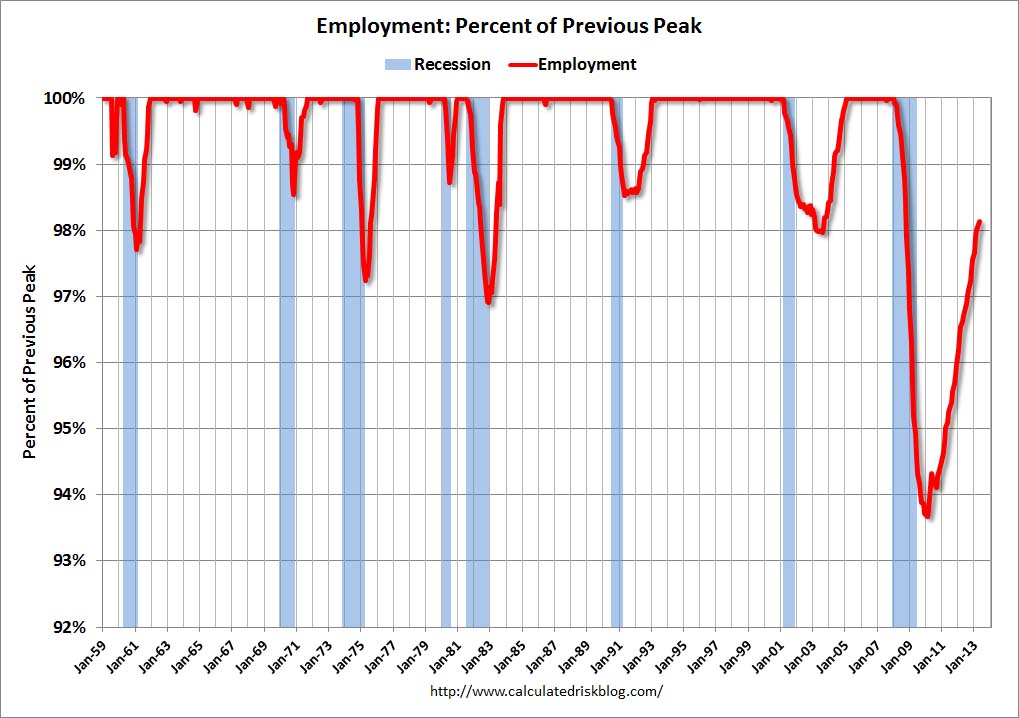
Payroll employment is still 1.9% below the pre-recession peak and will probably be back to pre-recession levels in 2014.
 http://www.calculatedriskblog.com/2013/05/update-recovery-measures.html
Members of Congress have the power to change the economic equation, but they're refusing to act.
http://www.democraticunderground.com/10022796943
 = new reply since forum marked as read
