General Discussion
Related: Editorials & Other Articles, Issue Forums, Alliance Forums, Region ForumsMost voters say the country is on the wrong track, & their situation & economy has not improved
Seven long years after the economy tanked, 70 percent of voters Tuesday said it’s still in bad shape. Seventy-eight percent said they’re worried about its direction in the year ahead. Only three in 10 said their own economic situation has improved in the last two years.
And nearly half of voters said they expect life for the next generation of Americans to be worse – by far the most to say so in exit polls asking the question back to 1996.
These results inform views of the country’s condition and the quality of its governance alike. Sixty-five percent said the nation is headed seriously off on the wrong track, the second most in available exit poll data back to 1990, trailing only its level in 2008. A mere 20 percent said they trust the government in Washington to do what’s right all or most of the time. Fifty-five percent disapproved of Barack Obama’s performance – up by 10 points vs. 2012, looking much like it did in his first midterm election in 2010, when his party lost 63 House seats.
Such views customarily slam the president’s party, and so they did again. Exit poll results, analyzed for ABC News by Langer Research Associates, found that government distrusters favored Republicans in the national House vote by 57-40 percent; “wrong track” voters by 69-29 percent; Obama disapprovers by 83-15 percent.
http://abcnews.go.com/blogs/politics/2014/11/a-fresh-blast-of-discontent-reshapes-the-political-order/
11/2014
 = new reply since forum marked as read
Highlight:
NoneDon't highlight anything
5 newestHighlight 5 most recent replies
= new reply since forum marked as read
Highlight:
NoneDon't highlight anything
5 newestHighlight 5 most recent replies
ND-Dem
(4,571 posts)When Barack Obama was pondering a run for the presidency Michelle asked him what he thought he could accomplish. He replied,“The day I take the oath of office, the world will look at us differently. And millions of kids across this country will look at themselves differently. That alone is something.” His victory was indeed something. The world certainly looked at America differently, though this had as much to do with who he wasn’t—George W. Bush—as what he was, black, among other things.
Polls show that African-Americans indeed look at themselves differently. A January 2010 Pew survey revealed huge optimism. The percentage of black Americans who thought blacks were better off than they were five years before had almost doubled since 2007. There were also significant increases in the percentages who believed the standard-of-living gap between whites and blacks was decreasing.
But for all the ways black America has felt better about itself and looked better to others, it has not actually fared better. In fact, it has been doing worse. The economic gap between black and white has grown since Obama took power. Under his tenure black unemployment, poverty and foreclosures are at their highest levels for at least a decade.
Millions of black kids may well aspire to the presidency now that a black man is in the White House. But such a trajectory is less likely for them now than it was under Bush. Herein lies what is at best a paradox and at worst a contradiction within Obama’s core base of support. The very group most likely to support him—black Americans—is the same group that is doing worse under him.
This condition was best exemplified by Velma Hart, the black chief financial officer for a Maryland veterans organization, who backed Obama in 2008. She told Obama at a town hall meeting in September, “I’m exhausted of defending you…. My husband and I have joked for years that we thought we were well beyond the hot-dogs-and-beans era of our lives. But, quite frankly, it is starting to knock on our door and ring true that that might be where we are headed again.” In November Velma Hart was laid off.
If it were white Americans who remained this loyal to a Republican president under whom they were doing this badly, the left would be claiming false consciousness. If a Republican president were behind statistics like these, few liberals would be offering that president the benefit of the doubt.
So, how do we explain this apparent inconsistency? There would appear to be three main reasons. The first is white people. Not all of them. But enough. Half of white Americans in a Pew survey shared the birthers’ doubt that Obama was born in this country. After the president produced his long-form birth certificate, Donald Trump demanded his college transcripts (claiming he was not smart enough to get into the Ivy League), and Newt Gingrich branded him the “food stamp president.” In the face of such brazenly racist attacks, defending Obama’s right to the office becomes easily blurred with defending his record.
Second, the post–civil rights era concept of corporate diversity, which many black people have embraced, is central to his symbolism. Racial advancement is increasingly understood not as a process of social change but of individual promotion—the elevation of black faces to high places. Instead of equal opportunities, we have photo opportunities. “We have more black people in more visible and powerful positions,” Angela Davis told me before Obama’s nomination. “But then we have far more black people who have been pushed down to the bottom of the ladder….There’s a model of diversity as the difference that makes no difference, the change that brings about no change.”
Third and perhaps most important, the discrepancy reflects a mixture of realism and low expectations. That black Americans are doing worse than everyone else, and that the man they elected to turn that around has not done so, does not fundamentally change their view of how American politics works; almost every other Democratic president has failed in a similar way. Conversely the fact that a black man might be elected president, that enough white people might vote for him, that nobody has shot him, really has changed their assumptions.
http://www.thenation.com/article/160782/obama-and-black-americans-paradox-hope#

Downwinder
(12,869 posts)ND-Dem
(4,571 posts)Last edited Sun Feb 8, 2015, 02:04 AM - Edit history (1)
Downwinder
(12,869 posts)Or perhaps fallen off the rails.
BlueJazz
(25,348 posts)You poor, idiotic , ignorant fools. You drag down the whole country with your stupidity and then cry when the people you vote for treat you like trash.
You're pathetic.
ND-Dem
(4,571 posts)The group that’s seen the slowest unemployment recovery under Obama? Black Americans.
http://www.washingtonpost.com/blogs/the-fix/wp/2015/02/06/the-group-thats-seen-the-slowest-unemployment-recovery-under-obama-black-americans/
BlueJazz
(25,348 posts)ND-Dem
(4,571 posts)and then proceeded to stiff his base.
his strongest supporters are doing worse than any other groups. as are other demographics he did well with.
BlueJazz
(25,348 posts)
jwirr
(39,215 posts)country feels if this is when it was taken. Other polls cited here on DU have put the president at higher than 50% approval.
ND-Dem
(4,571 posts)http://abcnews.go.com/blogs/politics/2014/11/a-fresh-blast-of-discontent-reshapes-the-political-order/
11/2014 (= 2.5 months ago)
I'd say that people who show up to vote in an off year are more politically committed and knowledgeable than average.
jwirr
(39,215 posts)99th_Monkey
(19,326 posts)
bhikkhu
(10,789 posts)I went through the link and found lots of analysis, but no details on the questions.
Which, to me, is like someone making sweeping statements, then saying "just trust me" when you want to know the bases for those statements. I'm not that trusting, so this OP goes in the dustbin of unverifiable potential BS for me.
ND-Dem
(4,571 posts)bhikkhu
(10,789 posts)...and the analysis in the OP has no information about what questions were asked. If you look at the more recent information, it looks like there is marked shift toward the good, rather than "A Fresh Blast of Discontent". The anaysis at the link you provided is titled, rather, "An Improving Economy Gives Obama His Game Back".
I hope you see the problem I have with the OP - on top of being a bit old (as those things go), and perhaps irrelevant because of that, without seeing the questions asked it's worthless.
One thing that immediately stands out is that it gives Obama an 83% disapprove result. The national polls have never gone above 54%, and most recently are at 44%. The discrepancy is likely the result of a skewed sample, a very small sample, or a very skewed question - which puts the whole analysis in question. The simplest conclusion is that its more of the same old RW BS, easy to find anywhere.
ND-Dem
(4,571 posts)Full results follow.
* in data columns = less than 0.5 percent
2b, 28d, 30-31 previously released; 6-7, 22-27, 28a-c, 28e, 29 held for release.
1. Do you approve or disapprove of the way Barack Obama is handling his job as
president? Do you approve/disapprove strongly or somewhat?
-------- Approve -------- ------- Disapprove ------ No
6
NET Strongly Somewhat NET Somewhat Strongly opinion
1/15/15 50 24 26 44 9 35 6
12/14/14 41 21 20 54 13 41 5
10/26/14 43 21 22 51 12 39 6
10/12/14 40 20 20 51 12 39 8
9/7/14 42 24 18 51 12 39 6 (the date in question)
6/1/14 46 23 23 51 14 37 3
etc.
Sorry I can't get them to display well here, but it starts at the bottom of page 5.
http://www.langerresearch.com/uploads/1166a32015Politics.pdf
bhikkhu
(10,789 posts)I still didn't find that in the methodology notes to the earlier poll - it all relates to phone and online surveys. Actual exit polling is done at the voting booth. How did they do that, and where? Those are both important questions, as locations tend to be relatively homogenous in political orientation, and responses will be skewed one way or another depending on where you ask. Did they go to every polling station? How did they get exit poll data for Oregon, for instance, where we use vote-by-mail? Did they do a phone survey afterwards, and ask people if they voted first? Valid as a sample of voters, but then its not an exit poll.
I'd still say any analysis of data worth reading would include the questions asked and the methodology; this one didn't do either.
ND-Dem
(4,571 posts)for the same information.
here, let me link that for you.
http://www.langerresearch.com/uploads/1166a32015Politics.pdf
http://www.democraticunderground.com/?com=view_post&forum=1002&pid=6199097
bhikkhu
(10,789 posts)The article itself doesn't link to its methodology, and gives no information on how the data was collected. The link from 2015 gives no information on exit polling, which is (almost anecdotally, at this point) supposed to be the method used.
ND-Dem
(4,571 posts)page 5, which I've directed you to 5 or so times, it quite clearly gives the poll questions and the results for polls taken up to January 2015 -- including the poll taken in September 2014 I originally linked to.
You seemed quite happy to tout the results in another thread when they had a feel-good title (though they weren't that different from the results in the September poll).
bhikkhu
(10,789 posts)The link in the OP is to an article written in November of 2014. Going to that article, it has a side link to methodology, which fails to give either the questions asked, or the means by which they were collected. That information is also absent from the article itself. Sorry about all the back-and-forth if I wasn't clear, but that's the gist of my problem with it.
ND-Dem
(4,571 posts)that poll, which is one of their standard polls that's been done for years. It also contains all the poll results, dating from before 2012 up to Jan. 2015, including the results from the original link I gave you from November.
I can't help but think you're being a bit disingenuous, particularly as you took the 1/15 results to another thread that's nothing to do with this one, and talked them up.
Apparently you're not so suspicious when the results have a flattering title.
bhikkhu
(10,789 posts)but while the "questions asked" is resolved (plausibly), I'd still like to see the method behind the exit polling, if that's what it was. Any decent journalism reporting on poll results should include the questions asked, the method used in asking them, the sample size, etc. Its all basic stuff.
ND-Dem
(4,571 posts)bhikkhu
(10,789 posts)In the one link you gave me, the journalism is excellent ( http://www.langerresearch.com/uploads/1166a32015Politics.pdf ) - every point is supported by graphics of data it derives from. At the end, the methodology is described, the sample size is given, and the actual questions are listed, along with the detailed results. The analysis is useful and trustworthy.
If you deleted out the graphics, the description of the methodology, the information on the sample size and the questions, you could take that same analysis and just post the text - but then it becomes a useless unverifiable opinion piece. Same write-up, but no value. Good journalism is information, bad journalism is click-bait. Its important to be able to make that distinction, and readers should have standards. Typically its the RW that doesn't care what its fed, but we should all have standards.
What the link in the OP offers is analysis without the source of data, without the methodology, without information on sample size or any useful detail of results, without information on the questions asked. If wrote that in a college paper, I'd be skewered in peer review. You might think I'm motivated by the headlines, one upbeat, the other downbeat, but if the quality of the content was reversed I would reverse my argument. A pro-Obama puff-piece with spurious unverifiable data is useless, while a detailed and well written anti-Obama analysis of poll data would be worth taking some time to consider and digest.
and...not to dig in too much farther, but you say the Nov '14 poll asks the same questions detailed in the methodology at the second link you provided, dated Jan '15. What were the questions, then that led to the results listed in the first poll about abortion, same-sex marriage, etc? They are absent from the second poll methodology, which leads me to think that they were two different polls. If there were more questions on the first poll than the second, how can we be sure that the duplicate questions were the same? Why were they not published? Where can they be found? These are questions a reader shouldn't have to ask, leading me to think the piece was written for people who don't ask many questions, and who don't really care.

napi21
(45,806 posts)Certainly there are some people who have not felt any effect of the improved economy, but that is NOT the majority! For the wealthy, AND the middle class, their 401K's have improved significantly, and of course anyone who has any $$ invested in the stock market, they have NOTHING to complain about at all. Even the poor & lower middle class have gotten the benefit of Obamacare. SOMEBODY is taking those millions of jobs, and all the General motors employees should certainly be happy.
Who is this majority they reference?
ND-Dem
(4,571 posts)More Americans Now Consider Themselves Among Working Poor
http://www.rasmussenreports.com/public_content/business/jobs_employment/february_2015/more_americans_now_consider_themselves_among_working_poor
32% Consumers Rate Economy Positively
http://www.rasmussenreports.com/public_content/business/indexes/rasmussen_consumer_index/rasmussen_consumer_index
Right Direction or Wrong Track: 34% Say U.S. Heading in Right Direction
http://www.rasmussenreports.com/public_content/politics/mood_of_america/right_direction_or_wrong_track
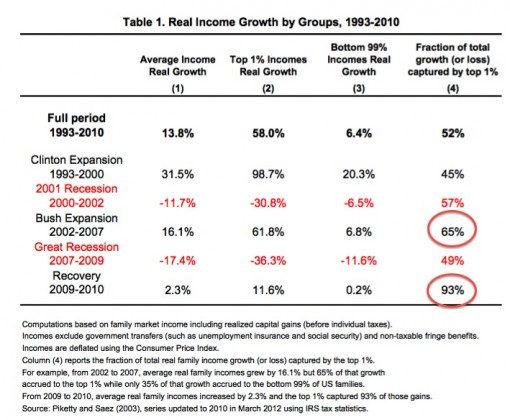
Voters Agree The Rich Get Richer
http://www.rasmussenreports.com/public_content/politics/general_politics/january_2015/voters_agree_the_rich_get_richer
Voters See Less Economic Fairness for Those Who Work Hard
http://www.rasmussenreports.com/public_content/archive/economic_fairness_archive/voters_see_less_economic_fairness_for_those_who_work_hard
msanthrope
(37,549 posts)ND-Dem
(4,571 posts)and those are the folks who think things are improving.
Those 'millions of jobs' are mostly poorly paid service jobs.
The revival of middle-class jobs has been one of Obama's mantras since he took office in 2009 fighting the worst economic crisis in generations. It was a major theme of his last State of the Union address and is expected to feature in the one scheduled for Tuesday.
In the six years through 2013, over the recession and recovery that have spanned Obama's tenure, jobs have been added at the top and bottom of the wage scale, a Reuters analysis of labor statistics shows. In the middle, the economy has shed positions - whether in traditional trades like machining or electrical work, white-collar jobs in human resources, or technical ones like computer operators...
http://www.reuters.com/article/2015/01/18/us-usa-obama-economy-idUSKBN0KR0HD20150118
VanillaRhapsody
(21,115 posts)Yeah...most who have middle class jobs have some kind of 401k...they don't have Retirement plans anymore...
ND-Dem
(4,571 posts)or 403(b) plan.
http://www.moneyinstructor.com/doc/401kparticipate.asp
VanillaRhapsody
(21,115 posts)More than just Upper Middle Class have 401k's ....you just contradicted yourself!
ND-Dem
(4,571 posts)Last edited Sun Feb 8, 2015, 07:10 PM - Edit history (2)

The percentage of households and individuals in each income bracket.
"Households vs Individuals Income". Licensed under CC BY-SA 3.0 via Wikipedia - http://en.wikipedia.org/wiki/File:Households_vs_Individuals_Income.png#mediaviewer/File:Households_vs_Individuals_Income.png
Per the census bureau (2006), the middle 20% of households are those making $35,000 to $55,000, and the middle third of households make $30,000 to $62,500. That's your "middle class".
http://en.wikipedia.org/wiki/Income_in_the_United_States
The income of the median U.S. household was $51,900 in 2013, the Census Bureau reported Tuesday. That's essentially unchanged from 2012 after adjusting for inflation, and is 8 percent lower than in 2007, before the recession began. Median income hasn’t shown a statistically significant increase since the recession ended in 2009.
http://fivethirtyeight.com/datalab/five-years-of-recovery-havent-boosted-the-median-household-income/
napi21
(45,806 posts)but my husband & I both have 401K'.s. He was a meat cutter at a supermarket chain, and I was an accountant for a small cosmetic mfg. Collectively we grossed $55,000 when we retired in 2010 We don't have a fortune in our 401K's. Somewhere around $35.000-$40,000. We did pay off our house while we were still working and now are living on SS and saving the 401k $$ for emergencies. When the Bush recession hit, we lost over 1/2 of our $$. The Obama economy has managed to gain bain back all our losses and even increased what we had.
I sure don't see us as upper-middle class, but the good stock market has helped us, and all those in similar circumstances.

Terra Alta
(5,158 posts)And I think the economy is improving. It definitely has for me, and I'm what most would consider the "working poor". Far from middle class.

woo me with science
(32,139 posts)An important recent thread by Teamster Jeff:
http://www.democraticunderground.com/10026192719
Much, much more at link.
ND-Dem
(4,571 posts)msanthrope
(37,549 posts)ND-Dem
(4,571 posts)msanthrope
(37,549 posts)bhikkhu
(10,789 posts)From the same polling outfit. Kind of makes you wonder how relevant the old data is, and why one would post the "Fresh Blast of Discontent" from months ago, while ignoring the more recent release.
ND-Dem
(4,571 posts)of the latest is because you wouldn't accept the earlier one and wanted to know how the questions were asked, blah blah, and when I provided you with it, you still wouldn't accept it (apparently didn't even look) -- but now you're prepared to accept that later poll from the same outfit, using the same questions...
not sure why, maybe because this later one talks of obama getting "his game back," though the data isn't that different.
http://www.langerresearch.com/uploads/1166a32015Politics.pdf
For example, a majority (56%) still feels the country is on the wrong track, as of 1/15/15, with 39% saying it's going in the right direction and 5% having no opinion.
v. the September poll from 4 months ago I linked in the op, which had 31% feeling the country was going in the right direction, 65% saying it was on the wrong track, and 5% with no opinion.
I wonder why you decided to respond here to our exchange from the other thread, too. I'll link it, in case you got confused.
It's very interesting to me that you decided to continue that conversation here while pretending you couldn't find the information over there.
http://www.democraticunderground.com/?com=view_post&forum=1002&pid=6199499

on point
(2,506 posts)ND-Dem
(4,571 posts)direction.
Egnever
(21,506 posts)Odd that
ND-Dem
(4,571 posts)is right-skewed toward wealth compared to 40-50 years ago?
or maybe it wasn't very high after all...
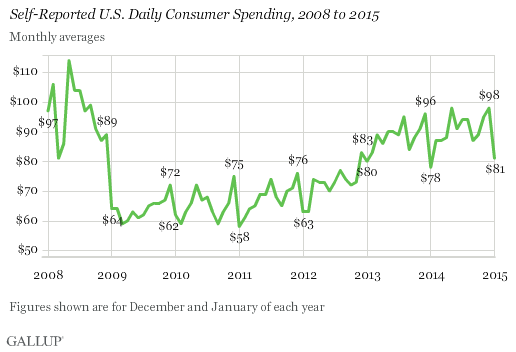
WASHINGTON, D.C. -- U.S. consumers' daily self-reports of spending fell to an average of $81 in January, down from $98 in December. Spending usually drops after the holiday season, falling an average of $15 each January since 2008. Despite this year's $17 drop, $81 is one of the highest self-reported averages in any January since 2008....
woo me with science
(32,139 posts)An important recent thread by Teamster Jeff:
http://www.democraticunderground.com/10026192719
Much, much more at link.
bhikkhu
(10,789 posts)Before taking any poll result at face value, I always like to read what questions were asked. Anyone here should know that its possible to phrase a question in a way to get the answer you want, called "push-polling".
Anyway, I looked through the link, methodology pages and so forth, and came up with squat - I don't see clearly who they are polling, when the poll was done exactly, and (most importantly) what questions were asked. So, whether I agreed with the results or not, the OP is just more worthless click-bait BS.
ND-Dem
(4,571 posts)heavily on your mind.
bhikkhu
(10,789 posts)If they can't be used to support an argument, I tend to think something is wrong with the argument. I like to see facts and evidence in the analysis of data, and I like to see where the data came from and how it was gathered. I live in a RW area, so I'm often confronted with absurd claims and opinions - one has to have a set of mental skills to cope with that sort of thing. If you live in North Dakota, you probably understand.
ND-Dem
(4,571 posts)bhikkhu
(10,789 posts)in the sense of a "trifling fault", a habit of being annoyed by something. Perhaps not an ideal use of the term (looking now at the full definition), but its how its been used in my extended family in conversation regularly over the years. For instance I have an aunt that can't bear rocking chairs, or people that sit and rock in a chair - that's one of her "pecadillos".
Ramses
(721 posts)When your job goes from 20 an hour with a pension and vacation and sick days to a contract job paying less than half that with no benefits under shit working conditions, people are going to rightly see that economy has not benefited them. This so called recovery enriched the 1% at the expense of everyone else.
And now its showing through

Kingofalldems
(40,278 posts)davidn3600
(6,342 posts)But the stock market is good and the rich are making money, so I guess it's all OK.
bhikkhu
(10,789 posts)though no argument over wages being stagnant. Statistically there was a good increase last month, after a decent increase over the last full year, but there's so much ground to make up that "stagnant" is still a fair description.
ND-Dem
(4,571 posts)
11/07: 121,875,000 full-time workers
1/15: 120,711 full-time workers
http://research.stlouisfed.org/fred2/series/LNS12500000
and you know there are more workers today than in 2007, so there should be more full time workers than in 2007, just to get to the same percentage of full time workers -- if the economy were on track.
bhikkhu
(10,789 posts)
http://data.bls.gov/pdq/SurveyOutputServlet?request_action=wh&graph_name=CE_cesbref1
There is some fudge-factor in there, as its all employees rather than specifically full-time. But the number of part-time workers who want to work full time has been steady around 6 million lately, while even at the best period of 2008 it stood at 5 million; not too much difference. An indication of the mix of full and part-time in the total is in the average workweek. At the height of 2008 the average was 33.7 hours, while its currently 34.6 hours - tending more toward full-time employment than 2008.
ND-Dem
(4,571 posts)The Fed Stats, which are January stats, say we're about 1.8 million short of where we were in November 2007.
Nov 2007: 121,875,000 full time workers
Jan 2015: 120,711,000 full time workers
which is identical to the BLS data here:
http://www.bls.gov/news.release/empsit.t09.htm
Scroll to the middle of the page until you see "Full-time workers" in the column "Jan 2015".
The number is 120,711,000. Same as the Fed data. No surprise.
bhikkhu
(10,789 posts)and I hadn't pulled up the right table to look at that number. I haven't heard the "record high" stated anywhere, but I did look at the table I posted in the context of the good recent jobs report, and I thought that was what it indicated. My mistake, and thanks for the correct information.
ND-Dem
(4,571 posts)disingenuousness is tiresome, so I'm going to end the exchange, thanks.
Terra Alta
(5,158 posts)If so, what do you think we should do to get back on the "right track"?
drray23
(8,759 posts)Honestly, who is going to say everything is fine and rosy ? Most people have issues in life, some minors and some not. Depending on how you construct your poll you are bound to get that kind of answer. Its natural for people to think they can always do better. As a matter of fact that is how the gop manages to stay afloat, by fooling their voters into thinking they too will be rich someday.
ND-Dem
(4,571 posts)way every time they ask it so such effects don't occur.
And contrary to what you claim, the results of such polls vary widely; usually it correlates to the shape of the economy, but sometimes with political events as well.
