Payroll employment rises by 223,000 in April; jobless rate essentially unchanged (5.4%)
Last edited Fri May 22, 2015, 09:58 AM - Edit history (8)
Source: U.S. Bureau of Labor Statistics
Economic News Release
Employment Situation Summary
USDL-15-0838
Transmission of material in this release is embargoed until 8:30 a.m. (EDT) Friday, May 8, 2015
Technical information:
Household data: (202) 691-6378 * cpsinfo@bls.gov * www.bls.gov/cps
Establishment data: (202) 691-6555 * cesinfo@bls.gov * www.bls.gov/ces
Media contact: (202) 691-5902 * PressOffice@bls.gov
THE EMPLOYMENT SITUATION -- APRIL 2015
Total nonfarm payroll employment increased by 223,000 in April, and the unemployment rate was essentially unchanged at 5.4 percent, the U.S. Bureau of Labor Statistics reported today. Job gains occurred in professional and business services, health care, and construction. Mining employment continued to decline.
Household Survey Data
In April, both the unemployment rate (5.4 percent) and the number of unemployed persons (8.5 million) were essentially unchanged. Over the year, the unemployment rate and the number of unemployed persons were down by 0.8 percentage point and 1.1 million, respectively. (See table A-1.)
The number of persons unemployed for less than 5 weeks increased by 241,000 to 2.7 million in April. The number of long-term unemployed (those jobless for 27 weeks or more) changed little at 2.5 million, accounting for 29.0 percent of the unemployed. Over the past 12 months, the number of long-term unemployed has decreased by 888,000. (See table A-12.)
In April, the civilian labor force participation rate (62.8 percent) changed little. Since April 2014, the participation rate has remained within a narrow range of 62.7 percent to 62.9 percent. The employment-population ratio held at 59.3 percent in April and has been at this level since January. (See table A-1.)
The number of persons employed part time for economic reasons (sometimes referred to as involuntary part-time workers) was little changed at 6.6 million in April, but is down by 880,000 from a year earlier. These individuals, who would have preferred full-time employment, were working part time because their hours had been cut back or because they were unable to find a full-time job. (See table A-8.)
....
Establishment Survey Data
....
The change in total nonfarm payroll employment for February was revised from +264,000 to +266,000, and the change for March was revised from +126,000 to +85,000. With these revisions, employment gains in February and March combined were 39,000 lower than previously reported. Over the past 3 months, job gains have averaged 191,000 per month.
_____________
The Employment Situation for May is scheduled to be released on Friday, June 5, 2015, at 8:30 a.m. (EDT).
Read more: http://www.bls.gov/news.release/empsit.nr0.htm
[center]Facilities for Sensory Impaired[/center]
Information from this release will be made available to sensory impaired individuals upon request. Voice phone: 202-691-5200, Federal Relay Services: 1-800-877-8339.
[center]Dedication[/center]
This month's thread is dedicated to the workers on what was called the First Transcontinental Railroad, even though, if you want to get technical about it, all it did was go from the Missouri River to Sacramento. Even when the rails extending from the east and from the west were joined at Promontory Summit, Utah, on May 10, 1869, you still had to leave the rail system to get across the Missouri River at Omaha and find a way to cross another river at Sacramento.
But who's counting? Anyway, it was then, and it still is, a grand project.

[center]Introduction[/center]
Good morning, Freepers and DUers alike. I especially welcome our good friends from across the aisle. You're paying for this information too, so I am absolutely delighted to have you participate in this thread. Please, everyone, put aside your differences long enough to digest the information. After that, you can engage in your usual donnybrook.
If you don't have the time to study the report thoroughly, here is the news in a nutshell:
Commissioner's Statement on The Employment Situation
It is easy to find one paragraph, or one sentence, or one datum in this report that will support the most outlandish of conclusions, from "the sky is falling" to "we'll have blue skies, nothing but blue skies, from now on." Easy, but disingenuous.
Every month, you can find something in the report that will cause you concern. One such nugget is the "labor force participation rate." Take the information in context. Consider not just this month’s data, but the trend.
Please take the time to look at progree's not-to-be-missed thread containing his thoughtful analysis, updated monthly. Here is the latest version:
Economy facts with links to official sources, rev 5/8/15.
Thank you so much for that, progree.
Let's begin with a couple of questions. Who is this Bureau of Labor Statistics, and why are they releasing all these numbers every month?
The Bureau of Labor Statistics (BLS) is a unit of the United States Department of Labor. It is the principal fact-finding agency for the U.S. government in the broad field of labor economics and statistics and serves as a principal agency of the U.S. Federal Statistical System. The BLS is a governmental statistical agency that collects, processes, analyzes, and disseminates essential statistical data to the American public, the U.S. Congress, other Federal agencies, State and local governments, business, and labor representatives. The BLS also serves as a statistical resource to the Department of Labor, and conducts research into how much families need to earn to be able to enjoy a decent standard of living.
The BLS data must satisfy a number of criteria, including relevance to current social and economic issues, timeliness in reflecting today’s rapidly changing economic conditions, accuracy and consistently high statistical quality, and impartiality in both subject matter and presentation. To avoid the appearance of partiality, the dates of major data releases are scheduled more than a year in advance, in coordination with the Office of Management and Budget.
Note carefully those words: "accuracy," "quality," and "impartiality."
Full disclosure: I do not work for BLS, nor am I friends with anyone over there. My sole connection with the agency is that I've been in the building to pick up some publications. I'm just someone who appreciates the work they do.
[center]Household Survey vs. Establishment Survey[/center]
From the February 10, 2011, DOL Newsletter:
Take Three
Secretary Solis answers three questions about how the Bureau of Labor Statistics calculates unemployment rates.
How does BLS determine the unemployment rate and the number of jobs that were added each month?
BLS uses two different surveys to get these numbers. The household survey, or Current Population Survey (CPS), involves asking people, from about 60,000 households, a series of questions to assess each person in the household's activities including work and searching for work. Their responses give us the unemployment rate. The establishment survey, or Current Employment Statistics (CES), surveys 140,000 employers about how many people they have on their payrolls. These results determine the number of jobs being added or lost.
[center]The Wall Street Journal. MoneyBeat Blog[/center]
April Jobs Report: Everything You Need to Know
8:00 am ET
May 8, 2015
Markets
—Associated Press
Yes, it’s that time again, folks. Jobs Friday, when for one ever-so-brief moment, the interests of Wall Street, Washington and Main Street are all aligned on one thing: jobs.
After a disappointing March report, economists are expecting improvement, with an estimate of 228,000 jobs added and an unemployment rate of 5.4%, down from March’s 5.5%.
Here at MoneyBeat HQ, we’ll crunch the numbers and compile the commentary before and after the data crosses the wires.

This is currently the first comment:
Nasty
by Erik Holm
Add a Comment
Wow. That revision is nasty.
8:33 am
Revisions
by Kristen Scholer
March’s initial print of 126,000 is revised to 85,000 — the worst read since June of 2012, the last time monthly payrolls were below 100,000.
-- -- -- -- -- -- -- -- -- -- -- -- -- -- -- -- -- -- --
You forgot to say "Enjoy the show." Also, "And while you’re here, why don’t you sign up to follow us on Twitter."
Before we do anything else, let's give credit to the workers behind the MoneyBeat blog:
The MoneyBeat Team:
Stephen Grocer
Editor
Phillipa Leighton-Jones
European Editor
Erik Holm
Deputy Editor
Maureen Farrell
Reporter, New York
Paul Vigna
Reporter, New York
David Cottle
Reporter, London
MoneyBeat Columnists
Ronald Barusch
Dealpolitik
Francesco Guerrera
Current Account
Alen Mattich
Alen Mattich
Jason Zweig
The Intelligent Investor
Michael J. Casey
Horizons
E. S. Browning
[center]The Large Print Giveth, and the Fine Print Taketh Away.[/center]
Long ago, a DU'er pointed out that, if I'm going to post the link to the press release, I should include the link to all the tables that provide additional ways of examining the data. Specifically, I should post a link to Table A-15. Alternative measures of labor underutilization. Table A-15 includes those who are not considered unemployed, on the grounds that they have become discouraged about the prospects of finding a job and have given up looking. Here is that link:
Table A-15. Alternative measures of labor underutilization
Also, hat tip, Recursion: How the Government Measures Unemployment
[center]Past Performance is Not a Guarantee of Future Results.[/center]
Nonetheless, what is important is not this month's results, but the trend. Let’s look at some earlier numbers:
ADP® (Automatic Data Processing), for employment in April 2015:
ADP National Employment Report: Private Sector Employment Increased by 169,000 Jobs in April
Bureau of Labor Statistics, for employment in March 2015:
Payroll employment increases by 126,000 in March; unemployment rate unchanged at 5.5%
ADP® (Automatic Data Processing), for employment in March 2015:
ADP National Employment Report: Private Sector Employment Increased by 189,000 Jobs in March
Bureau of Labor Statistics, for employment in February 2015:
Payroll employment increases in February (+295,000); unemployment rate edges down to 5.5%
ADP® (Automatic Data Processing), for employment in February 2015:
ADP National Employment Report: Private Sector Employment Increased by 212,000 Jobs in February
Bureau of Labor Statistics, for employment in January 2015:
Payroll employment rises in January (+257,000); unemployment rate changes little (5.7%)
ADP® (Automatic Data Processing), for employment in January 2015:
ADP National Employment Report: Private Sector Employment Increased by 213,000 Jobs in January
[center]Nattering Nabobs of Negativism[/center]
Here’s a grim thought:
Fed economists: America’s missing workers are not coming back
Let’s follow that with another grim thought:
Why wage growth disparity tells the story of America's half-formed economic recovery
By Chico Harlan November 21, 2014
@chicoharlan
chico.harlan@washpost.com
WILMINGTON, Del. — Thomas Gray says he was fortunate coming out of the recession: He took a job in one of the nation’s fastest-growing industries, food services, preparing meals for 500 students in a Head Start cafeteria.
But after two years of work, his salary had not budged, so his mother came out of retirement and took a job at United Way. Four more years have passed, and Gray is skipping bills to manage his expenses. During that time, his salary has risen 58 cents, to $11.70 per hour. But after taking into account the rising price of goods and services — inflation — he has taken a 6 percent pay cut.
....
With unemployment down to 5.8 percent, the country’s half-formed recovery is often described with a convenient shorthand: We have jobs but little wage growth. But stagnancy is just an average, and for many Americans, the years since the financial crisis have pushed them farther from the line, according to a detailed analysis of government labor statistics by The Washington Post.
....
Among the winners in this climate: Older workers, women and those with finance and technology jobs. ... Among the losers: Part-timers, the young, men, and those in the health, retail and food industries.
....
Chico Harlan covers personal economics as part of The Post's financial team.
@chicoharlan
chico.harlan@washpost.com
Dissenters, take note:
A New Reason to Question the Official Unemployment Rate
David Leonhardt
AUG. 26, 2014
The Labor Department’s monthly jobs report has been the subject of some wacky conspiracy theories. None was wackier than the suggestion from Jack Welch, the former General Electric chief executive, that government statisticians were exaggerating job growth during President Obama’s 2012 re-election campaign. Both Republican and Democratic economists dismissed those charges as silly.
But to call the people who compile the jobs report honest, nonpartisan civil servants is not to say that the jobs report is perfect. The report tries to estimate employment in a big country – and to do so quickly, to give policy makers, business executives and everyone else a sense of how the economy is performing. It’s a tough task.
And it has become tougher, because Americans are less willing to respond to surveys than they used to be.
A new academic paper suggests that the unemployment rate appears to have become less accurate over the last two decades, in part because of this rise in nonresponse. In particular, there seems to have been an increase in the number of people who once would have qualified as officially unemployed and today are considered out of the labor force, neither working nor looking for work.
[center]On the Road Again[/center]
The DOL Newsletter - October 6, 2011
DOL Data: There's an App for That
Have an iPhone, iPod Touch or Android phone? Now you can access the latest labor data and news from the department's Bureau of Labor Statistics and Employment and Training Administration in the palm of your hand. The latest free mobile app displays real-time updates to the unemployment rate, Unemployment Insurance initial claims, the Consumer Price Index, payroll employment, average hourly earnings, the Producer Price Index, the Employment Cost Index, productivity, the U.S. Import Price Index and the U.S. Export Price Index in real time, as they are published each week, month or quarter. News releases providing context for the data can also be accessed through the app and viewed within a mobile browser or as PDF documents.
US Labor Department launches economic and employment statistics app
Smartphone users gain mobile access to latest labor data and news
WASHINGTON — The most up-to-date employment data and economic news releases from the U.S. Department of Labor's Bureau of Labor Statistics and its Employment and Training Administration now can be viewed using a new mobile application.
....
The new app is currently available for the iPhone and iPod Touch as well as Android phones. The Labor Department is working to develop versions for BlackBerry and iPad devices. Visit http://m.dol.gov/apps/ to download this and other mobile apps.
Download the Data, Other Mobile Apps
[center]A Few More Things[/center]
Meet FRED, every wonk’s secret weapon
FRED stands for Federal Reserve Economic Data. It serves as an online clearinghouse for a wealth of numbers: unemployment rates, prices of goods, GDP and CPI, things common and obscure. Today, FRED is more than a little bit famous, thanks to the public’s fascination with economic data.
Federal Reserve Economic Data
So how many jobs must be created every month to have an effect on the unemployment rate? There's an app for that:
Federal Reserve Bank of Atlanta Jobs Calculator™
Monthly Employment Reports from BLS
The U.S. Census Bureau has its own releases:
U.S. Census Bureau Latest News
U.S. Census Bureau Economic Indicators
For people who need a daily fix:
BLS-Labor Statistics Twitter feed
Tomorrow's news before it happens. The schedule for all economic reports:
Economic Calendar

 = new reply since forum marked as read
Highlight:
NoneDon't highlight anything
5 newestHighlight 5 most recent replies
= new reply since forum marked as read
Highlight:
NoneDon't highlight anything
5 newestHighlight 5 most recent replies

Gothmog
(176,794 posts)
BumRushDaShow
(167,205 posts)
And thanks for posting!


mahatmakanejeeves
(68,821 posts)Please enjoy. Constant editing even as we speak....
mahatmakanejeeves
(68,821 posts)Jobless rate for black Americans finally in single digits
by Ben Leubsdorf
—AP
For the first time in nearly seven years, the unemployment rate for African Americans is in single digits–though it remains more than twice as high as the jobless rate for whites.
The seasonally adjusted unemployment rate for black workers was 9.6% in April, the Labor Department said Friday. That was down from 10.1% in March and the lowest reading since June 2008, when it was 9.4%.
For more on the trend, click here.
Jolts takes on added importance
by Kathleen Madigan
The downward revision in March payrolls to just 85,000 new jobs means March was the weakest hiring month since June 2012. What happened? To find out, we will have to wait for next Tuesday’s Job Openings and Labor Turnover survey. The Labor’s Jolts report details the churn in labor markets, the number of job openings, gross hirings, layoffs and other job separations. It is a report closely watched at the Fed–and consequently now watched by financial markets. Next week’s report will cover March and should offer some clues as to why that month’s payroll gain was so weak.
BumRushDaShow
(167,205 posts)I know too many friends - notably, the over 50 but under 60 crowd who are too young to retire, who have been looking for the past couple years.. And just this past week, a couple mentioned finally getting some call-backs.

Chicago1980
(1,968 posts)how this is bad for America.
whatthehey
(3,660 posts)the DU doomers just need time to pore through the details and find something negative.

JustABozoOnThisBus
(24,634 posts)... izzat negative enough?
Just being sarcastic. I am not a fan of increasing the H1B visa program.
whatthehey
(3,660 posts)there's probably some segment that lost a few thousand jobs in the 50+ age bracket that needs to be promoted as the real scale for good-paying jobs that shows a precipitous decline that's hidden by the "fake feel good headline rate" or something like that.
They'll find it soon enough.
whatthehey
(3,660 posts)whatthehey
(3,660 posts)I expected modest job growth and a CLFPR uptick sure enough, but my guess was that the latter would be enough to push u3 up a tick rather than down.
Still, it seems the days of ddrama are done and the new normal is this slow steady trickle of slight improvement. From an econ point of view that's preferable, but from a human one, more positive drama would help.
One potential fly in the ointment though, not to hijack your thread, is productivity and costs. If labor costs continue to rise quickly without productivity, companies are hardly likely to open up their bulging coffers and commit to hiring more labor...
http://www.bls.gov/news.release/prod2.nr0.htm
yellowcanine
(36,745 posts)Nevermind. Did you hear about Hillary's emails? Benghazi! Clinton Foundation!
mahatmakanejeeves
(68,821 posts)Last edited Fri May 8, 2015, 03:20 PM - Edit history (1)
The April Jobs Report in 13 ChartsHere are two of the thirteen.
May 8, 2015
Economy
By Nick Timiraos and Josh Zumbrun
The U.S. economy added 223,000 jobs in April, and a separate survey showed that the unemployment rate fell to 5.4%, near a seven-year low.
Unemployment is falling steadily across a range of measures.

Over the trailing three months, job growth in March and April has slowed a bit from its hot pace at the end of last year. The economy added just 85,000 jobs in March, down from an earlier estimate of 126,000.

progree
(12,805 posts)Last edited Fri May 8, 2015, 08:29 PM - Edit history (1)
In fact, the number of full time jobs peaked in Nov 2007 at 121,875,000. Thats right. We have yet to regain the number of full time jobs we had over seven years ago! We are over 1.1 MILLION jobs short of where we were in 2007. And there are 17 million more people now than there were then.
BLS full-time worker data series: http://data.bls.gov/timeseries/LNS12500000
http://www.democraticunderground.com/10026642259
Yes, most of the economic statistics suck when compared to the peak in 2007. This is one of the classic tricks of the right-wing polemicists and their DU allies -- something I mention on my EF-0 page (please see my sigline). It is classic trick #5 (excerpted below):
(5). Comparing the current statistics to 2007's statistics, as if 2007 was a normal economy we should get back to - I see this all the time. Yes, today's economic statistics just about across the board suck compared to 2007's. But keep in mind that 2007 was not a normal economy. It was a very sick bubble economy with a very high fever -- people using their houses as ATMs to the tune of hundreds of billions of dollars a year. Anybody could get a mortgage, virtually no questions asked. The belief that housing prices never go down, at least not on a national average scale (thus the theory that a geographically diversified bundle of mortgages was always a safe bet).
The same for comparisons to 2000 -- that too was a very sick economy -- astronomical price/earnings ratios in the stock market, day trading and momentum investing. The belief that Alan Greenspan had mastered the "Goldilocks" economy (not too cool, not too warm) and that, now that we understood how to use the Fed's powers to control the economy, we will never have a recession again. That tech companies with huge negative earnings and no business plan were great investments. That we were all going to the moon, and we were all going to the stars (speaking of the economy and the stock market).
Well, I'm extremely very sorry to have to tell you -- we don't want to get back to the very sick high-fever bubble economies of 2000 or 2007. So quit the whining about how things now are so much worse than back then -- no they aren't when you consider the sickness and unsustainability of those economies back then.
progree
(12,805 posts)The BIG HOO-HAH of the month is that:
Full-time workers: http://data.bls.gov/timeseries/LNS12500000
In the below, I highlight the part-time workers / full-time workers in blue:
5/8/15 - Good jobs report this month 223,000 net new payroll jobs in April. But February and March were revised downward by a combined 39,000 (February was revised up by 2,000 but March was revised down by 41,000). So we have 184,000 more payroll jobs than we did in last month's report (223 - 39 = 184).
The below paragraph is from https://www.whitehouse.gov/blog/2015/04/03/employment-situation-march
Our businesses and the economy as a whole created more than 200,000 jobs in thirteen of the past fourteen months—the first time that has happened since 1995. ... Our economy has added 3.0 million new jobs over the past twelve months, nearly the fastest pace in more than a decade.
Over the past 3 months, job gains have averaged 191,000 per month. Over the past year, payroll jobs have increased by 2,982,000 (an average of 248,000/month). And since the jobs recovery began in March 2010, payroll jobs increased by 11,718,000.
The numbers in the below paragraphs come from the Household Survey, which is different from the Establishment Survey that produces the payroll jobs number.
Table numbers, like Table A-8 and A-9, refer to the tables in http://www.bls.gov/news.release/pdf/empsit.pdf
Almost all numbers were good in April -- the labor force increased by 166,000 (raising the labor force participation rate by 0.1% to 62.8%, although that is barely above a multi-decade low). The unemployment rate fell 0.1% to 5.4% -- the lowest rate in nearly 7 years. The U-6 unemployment rate -- which counts as unemployed every jobless person who has looked for work sometime, anytime, even just once in the past YEAR, plus part-timers who want a full-time job -- decreased by 0.1% to 10.8%.
Or flat: The Employment to population ratio stayed unchanged at 59.3%.
[font color = blue]Or not good: part-time workers increased by 437,000 in April, while full-time workers fell by 252,000 (both numbers are from Table A-9). Our right-wing friends, and their DU allies, will no doubt make a big hoo-hah about this, making out this unfortunate one-month change in an extremely volatile data series as being the story of the Obama administration. And they will leave out a positive statistic: that the number of part-time workers who want full-time work fell by 125,000 in April (the "part-time for economic reasons" number in Table A-8, also known as involuntary part-time workers).
And they will leave out any longer term trend, such as over the past year:
* the number of part-time workers who want full-time work fell by 880,000
* the number of full-time workers went up by 2,314,000 (and the number of part-time workers went up by 487,000)
Or since the jobs recovery began in February 2010:
* the number of part-time workers who want full-time work fell by 2,356,000
* the number of full-time workers went up by 9,994,000 (and the number of part-time workers went up by 111,000)
Nor will they show a graph comparing part-time and full-time worker numbers (this is through the end of 2014)
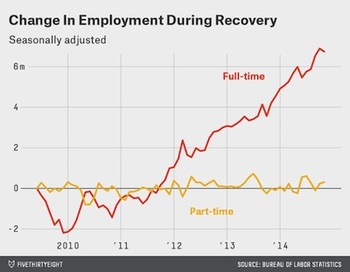
As for the number of full-time workers not being at their November 2007 peak, well that was an unsustainable bubble economy -- where people were using their houses as ATM machines to the tune of $ hundreds of billions a year -- that was already beginning to crash -- please see post#13 for more on that
[/font]
Some key numbers from the Household Survey (note the Household Survey is different from the Establishment Survey that produces the payroll jobs of the first paragraph). See below, and see Table A-1 for the main Household Survey numbers - http://www.bls.gov/news.release/empsit.t01.htm
Exception: the payroll jobs numbers and the inflation-adjusted weekly earnings come from the Establishment Survey. I don't include the over-the-last-month figure for inflation-adjusted weekly earnings, because the CPI data needed for the inflation adjustment is not available until later in the month; but I do include them for the longer periods (over the last year and since the payroll jobs recovery began)
In the below tables, all "%" ones are percentage point changes, not percent increases or decreases. FOR EXAMPLE, when you see something like this:
-1.7% U-6 unemployment rate
It means that the U-6 unemployment rate dropped by 1.7 percentage points (this EXAMPLE is for the one year from November 2013 to November 2014, when U-6 dropped from 13.1% to 11.4%. This is a drop of 13.1 - 11.4 = 1.7 percentage points, *not* a 1.7% decrease. The corresponding percent change is (11.4-13.1)/13.1 X 100% = -12.98%, i.e. a 12.98% decrease. So in summary, IN THIS EXAMPLE, U-6 dropped by 1.7 percentage points, and also decreased by 12.98%.
Over the last month:
+223,000 Payroll Jobs (Establishment Survey, CES0000000001 )
+166,000 Labor Force (employed + jobless people who have looked for work sometime in the last 4 weeks)
+192,000 Employed
-26,000 Unemployed (jobless people who have looked for work sometime in the last 4 weeks)
+0.0% Employment-To-Population Ratio aka Employment Rate (it's at 59.3%)
+0.1% LFPR (Labor Force Participation rate) (to 62.8%)
-0.1% Unemployment rate (at 5.4%, lowest in 7 years). Is Unemployed (as defined above) / Labor Force [N864.HM].
-0.1% U-6 unemployment rate (to 10.8%) http://data.bls.gov/timeseries/LNS13327709
-125,000 Part-Time Workers who want Full-Time Jobs (Table A-8's Part-Time For Economic Reasons)
+437,000 Part-Time Workers (Table A-9)
-252,000 Full-Time Workers (Table A-9)
Over the last year (last 12 months):
+2,982,000 Payroll Jobs (Establishment Survey, CES0000000001)
+1,652,000 Labor Force
+2,799,000 Employed
-1,147,000 Unemployed
+0.4% Employment-To-Population Ratio aka Employment Rate
+0.0% LFPR (Labor Force Participation rate) (ughh)
-0.8% Unemployment rate
-1.5% U-6 unemployment rate (fabulous. it includes anyone that looked for work even once in the past year)
-880,000 Part-Time Workers who want Full-Time Jobs (Table A-8's Part-Time For Economic Reasons)
+487,000 Part-Time Workers (Table A-9)
+2,314,000 Full-Time Workers (Table A-9)
+2.56% INFLATION ADJUSTED Weekly Earnings of Production and Non-Supervisory Workers ( CES0500000031 )
......... the weekly earnings percentage is 11 months thru March because no CPI data for April yet
The reason there's no data for April yet for the weekly earnings is because the CPI inflation adjustment number for April is not yet available. By the way, this and the payroll jobs numbers are the only numbers in the table above that comes from the Establishment Survey rather than the Household Survey.
All the "over the last year" numbers are really good numbers except the Labor Force Participation Rate shows no change. Interesting though that there was a 0.4% percentage point increase in the Employment To Population Ratio. The Population being talked about is the civilian non-institutional population age 16 and over, yes, including all elderly people, even centenarians.
Seems to me that there is too much discussion in the media of the Labor Force Participation Rate (the employed plus the jobless people who have looked for work in the last 4 weeks, all divided by the population) and not enough attention to what seemingly matters more -- the Employment to Population Ratio. Why aren't we celebrating the increase in the percentage of the population that is employed -- a figure that has been slowly moving up since the job market bottom, despite the growing wave of baby boomer retirements?
Part-Time Workers Who Want Full Time Jobs, as % of All Employed
[div style="display:inline; font-size:1.37em; font-family:monospace; white-space:pre;"]Apr'14 Jan'15 Mar'15 Apr'15
[div style="display:inline; font-size:1.37em; font-family:monospace; white-space:pre;"]5.1% 4.6% 4.5% 4.4%
Since the Payroll Job Recovery Began -- Last 62 months thru Apr 30, 2015: 4'15 - 2'10:
(This is the period from when continuous growth of payroll employment began, thru April 30, 2015)
+11,718,000 Payroll Jobs (Establishment Survey, CES0000000001)
+3,378,000 Labor Force
+9,942,000 Employed
-6,564,000 Unemployed
+0.8% Employment-To-Population Ratio aka Employment Rate (woo hoo!)
-2.1% LFPR (Labor Force Participation rate) (ughh)
-4.4% Unemployment rate
-6.2% U-6 unemployment rate
-2,356,000 Part-Time Workers who want Full-Time Jobs (Table A-8's Part-Time For Economic Reasons)
+111,000 Part-Time Workers (Table A-9)
+9,994,000 Full-Time Workers (Table A-9)
+3.89% INFLATION ADJUSTED Weekly Earnings of Production and Non-Supervisory Workers ( CES0500000031 )
......... the weekly earnings percentage is thru February 2015 because no CPI data for March yet
The links to the data above
# Payroll Jobs (Establishment Survey, http://data.bls.gov/timeseries/CES0000000001
# Labor Force http://data.bls.gov/timeseries/LNS11000000
# Employed http://data.bls.gov/timeseries/LNS12000000
# Unemployed http://data.bls.gov/timeseries/LNS13000000
# Employment-To-Population Ratio aka Employment Rate http://data.bls.gov/timeseries/LNS12300000
# LFPR (Labor Force Participation rate) http://data.bls.gov/timeseries/LNS11300000
# Unemployment rate http://data.bls.gov/timeseries/LNS14000000
# U-6 unemployment rate http://data.bls.gov/timeseries/LNS13327709
# Part-Time Workers who want Full-Time Jobs (Table A-8's Part-Time For Economic Reasons) http://data.bls.gov/timeseries/LNS12032194
# Part-Time Workers (Table A-9) http://data.bls.gov/timeseries/LNS12600000
# Full-Time Workers (Table A-9) http://data.bls.gov/timeseries/LNS12500000
# INFLATION ADJUSTED Weekly Earnings of Production and Non-Supervisory Workers http://data.bls.gov/timeseries/CES0500000031
########################################################################
FFI on the most recent jobs report, straight from the Bureau of Labor Statistics: http://www.bls.gov/news.release/empsit.nr0.htm
Table A-1. Employment status of the civilian population by sex and age (household survey) http://www.bls.gov/news.release/empsit.t01.htm
Several graphs of the key economic stats -- http://www.bls.gov/web/empsit/cps_charts.pdf
The whole enchilada -- including all 16 "A" tables (the household survey) and all 9 "B" tables (the establishment survey) http://www.bls.gov/news.release/pdf/empsit.pdf
BLS Commissioner's Statement on The Employment Situation http://www.bls.gov/news.release/jec.nr0.htm
The Council of Economic Advisors' Take on the Jobs Report
https://www.whitehouse.gov/blog/2015/05/08/employment-situation-april (find this at http://www.whitehouse.gov/administration/eop/cea and look for the last "The Employment Situation in" post)
Bureau of Labor Statistics Commissioner's Corner: http://beta.bls.gov/labs/blogs/ Twitter Account: https://twitter.com/BLS_gov
mahatmakanejeeves
(68,821 posts)One of these days, the BLS will run out of charts. I doubt that will happen in my lifetime.
Similarly, there must be some aspect of the employment picture that the BLS has not covered. Again, I can't imagine what that aspect is.
Here you go:
https://twitter.com/BLS_gov
Charts about the employed, the unemployed, and people not in the labor force from today’s Jobs Report:
Charting the labor market: Data from the Current Population Survey (CPS)
progree
(12,805 posts)Last edited Fri May 8, 2015, 08:35 PM - Edit history (1)
In response to:
We lost 252,000 full-time jobs in April
In fact, the number of full time jobs peaked in Nov 2007 at 121,875,000. Thats right. We have yet to regain the number of full time jobs we had over seven years ago! We are over 1.1 MILLION jobs short of where we were in 2007. And there are 17 million more people now than there were then.
I wrote this:
11. Full-time workers up 1,265,000 over last 5 months (253,000/month average)
Did you make a big HOO-HAH when fulltime workers went up by 552,000 in September, 427,000 in December, and 777,000 in January, for example?
Monthly changes in full-time workers (in thousands): http://data.bls.gov/timeseries/LNS12500000
` ` `` Jan Feb Mar Apr May Jun July Aug Sep Oct Nov Dec
2014) 410 209 203 396 332 -538 196 310 552 371 -174 427
2015) 777 123 190 -252

Note this is a highly volatile data series, as are most of the Household Survey numbers (in other words, most of the month to month changes is statistical noise)
I talk about this on my EF-0 page under the topic "Highlighting the adverse one-month or other short-term changes in some highly volatile component, and making it seem like it's the story of the whole Obama administration's job record". Also known as cherry-picking the bad statistic of the month
Should we perhaps look over the past 12 months:
-880,000 Part-Time Workers who want Full-Time Jobs (Table A-8's Part-Time For Economic Reasons)
+487,000 Part-Time Workers (Table A-9)
+2,314,000 Full-Time Workers (Table A-9)
Or since the jobs recovery began in March 2010?
-2,356,000 Part-Time Workers who want Full-Time Jobs (Table A-8's Part-Time For Economic Reasons)
+111,000 Part-Time Workers (Table A-9)
+9,994,000 Full-Time Workers (Table A-9)
(so much for the meme that all the new jobs are part-time)
########
I also posted something over there very similar to #13 in this thread -- that we don't really want to go back to the November 2007 economy because it was an unsustainable hyper-bubble fueled by houses-as-ATM-machines already beginning to crash
#########
Ooops. I meant to post this as a reply to the OP. Oh well. Close.