Labor market remained strong in November as U.S. economy added 266,000 jobs
Source: Washington Post
The United States added 266,000 jobs in November as the jobless rate decreased to 3.5 percent, the latest snapshot of an economy that appears to have slowed but stabilized in recent months.
The data, released by the Bureau of Labor Statistics, beat expectations. Analysts had forecast roughly 180,000 new jobs for the month. The 3.5 percent unemployment rate matches a 50-year low that the labor market had set in September.The tally was impacted by thousands of General Motors workers who returned to their jobs in late October after a lengthy strike.
The labor market has remained one of the brightest spots in the economy, and combined with the high stock market has contributed to high levels of consumer spending and a relatively rosy consumer sentiment.Many employers are still struggling to find qualified workers to fill jobs, but other companies have had to cut jobs because of a recent pullback in manufacturing demand.
The labor market’s health could have big implications for the 2020 elections. Concerns about a looming recession have waned, but the economy has still shown signs of cooling. Economists have warned the mounting toll of President Trump’s protracted trade war has strained global trade growth and slowed the creation of American jobs. Federal Reserve Chair Jerome H. Powell has said Trump’s tariffs have wrought so much uncertainty that companies are delaying investments and slowing the economy.
Read more: https://www.washingtonpost.com/business/2019/12/06/labor-market-remained-strong-november-us-economy-added-jobs-jobless-rate-fell-percent/
Full headline: Labor market remained strong in November as U.S. economy added 266,000 jobs and jobless rate fell to 3.5 percent
It's "that" Friday again
 and our DU economic analysts should be along today to give us the drill-down of this data!
 = new reply since forum marked as read
Highlight:
NoneDon't highlight anything
5 newestHighlight 5 most recent replies
= new reply since forum marked as read
Highlight:
NoneDon't highlight anything
5 newestHighlight 5 most recent replies
killaphill
(212 posts)They aren't even being subtle about it. Anyone who two eyes can see that things are contracting and that the American worker and consumer are being squeezed by a tougher job market and massive personal debt. These numbers are absurd.

BumRushDaShow
(167,250 posts)So almost 60,000 of that number were GM workers who returned to the payroll after their strike. So the "real" figure is actually much lower and this is an aberration.


FBaggins
(28,676 posts)There isn't any way to spin this as anything but a surprisingly good figure.
When those 60k subtracted from the monthly figure in September... did you say that the "real" figure is actually much higher?
BumRushDaShow
(167,250 posts)so am not putting all my eggs in their basket either.
I think what will be instructive to see are the revisions for what was originally reported over the past couple months (up or down) to get the net. That's why I noted that I await the DU folks who regularly post their analysis of the data in these monthly job reports threads, so we can get a fuller picture of what might be going on (I don't have time to dig into that data 'cause I'm digging into other data -non jobs related - at the moment )!

progree
(12,808 posts)Thus resulting in +266,000 + 41,000 = +307,000 more jobs than were in the jobs report that came out a month ago (+308,000 actually, thanks to rounding differences)
152,253,000 November from report that came out today
151,945,000 October from report that came out Nov. 1
--------------------------------------------------------
308,000 difference
(Yes, I report this information when there is a downward revision too).
Edited to add: the job gains over the last 3 months averaged 205,000/month
Year-to-date (1st 11 months) : 180,000/month average
2018: 223,000/month average
BumRushDaShow
(167,250 posts)Whenever I have time during these releases, I try to quickly scan through to see the revisions (but have been tied up this morning).
progree
(12,808 posts)There are a tons and tons of numbers to go through to look for interesting changes
So far what sticks out is how the two reports (Establishment Survey and Household Survey) are so different (again) in the job gains for the month
+266,000 nonfarm payroll jobs (Establishment Survey, the headline jobs number)
+83,000 Employed (Household Survey).
The former is considered much more reliable (much larger sample). But still... the Household Survey is what gives us the unemployment rate, labor force and labor force participation rate, and so much more -- pretty much all of the "jobs reports" numbers other than nonfarm payroll jobs and the average hourly earnings.
The Labor Force (Household Survey) went up by only 40,000
Not In Labor Force went up by 135,000 to 95,616,000 (during the 2016 campaign, Candidate Laughing Stock use to tout this number at the time -- 94 million -- as "94 million jobless Americans". Well, now it's closer to "96 million jobless Americans"
Well, its all fake anyway
Link to tweet
/photo/1
"We can rev up this economy like it should be, not with false numbers" 8/11/13
"... totally phony number." 5/31/14
"Nobody has jobs ... it is not a real economy. It is a phony set of numbers." 10/11/15
"The terrible jobs report that just came out... phony numbers" 11/4/16
BumRushDaShow
(167,250 posts)And I have seen those pages and pages in previous months and am not even going to attempt it considering how my poor burnt-out brain is functioning today. 
progree
(12,808 posts)(+62k jobs), but I don't think I'll find any. As I recall, in months like that, people believe the numbers and they "prove" that we're entering recession or at least in an existential slowdown. But when the numbers are good, it's "proof" that the numbers are cooked.
Edited to add: I found the October jobs report thread when only 128,000 jobs gain was reported -- no complaints there of cooked numbers.

Hugin
(37,624 posts)Merry Christmas! Happy Hanukkah! Joyous Kwanzaa! Festivus! Blessed Solstice! Season's Greetings! and whatever else... 
It's people out doing stuff they enjoy with those they love... Always, a good thing. (Plus, it stimulates the economy.)
Dang, I'm getting to be a real softy.
BumRushDaShow
(167,250 posts)although as I note, I defer to our specialists who will be digging into the pages of data!
Hugin
(37,624 posts)Up to an election where the GrOPpers are already putting the squeeze on desperate Presidents.
However, I also have a dedication to honesty. Which, I'm sure DU's in-house analysts will arrive at by their usual means. 

SoCalNative
(4,613 posts)wondering how many of these jobs are temporary, seasonal hiring for the holidays?

Backseat Driver
(4,671 posts)UPDATE: Still not scheduled for that PT gig at Lowe's nor was the job billed as seasonal. Was told the position discussed at interview isn't the one for which he was hired; that one should have been removed from their on-line job postings; furthermore, his availability (35 hrs) was inconsistent with the way in which workers were scheduled (4 hr shifts only) thus reducing availability to be a cashier in half Geesh, it's probably an hour before they realize any one cashier isn't coming in for whatever reason????? I remain suspicious of alternative hiring agendas like fudging statistics, identify theft from hiring documents, or age/vet status reporting discrimination (more fudging). He's a senior and a Vet. Well, he'll hold tight checking that schedule, but they probably won't even tell him to his face that he's been "unhired. "
https://democraticunderground.com/?com=forum&id=1119
evertonfc
(1,713 posts)In Nashville anyone can find a job. Now, many may be low wage buy there are so many openings, stores are scaling back hours due to the inability to fill positions. You could walk on to any, of many, construction sites in the city and start at $18 with zero experience. Its really robust here
bucolic_frolic
(54,516 posts)Look at the want ads. 40% must be Uber, UPS helper, and handyman. The rest are for skilled IT, experienced and skilled office personnel, and Safe-Serv restaurant managers.
progree
(12,808 posts)FBaggins
(28,676 posts)So that would only impact the figure to the extent that seasonal hiring was stronger than in past years (which would itself be a good sign... but which I doubt is true).
bucolic_frolic
(54,516 posts)just like a cost-benefit analysis. And we are being lied to. And no I don't believe a word they say.

Farmer-Rick
(12,533 posts)Of several administrative function on base. Each time my elaborate report would clearly show how privitization would increase the cost of doing that function (Here's a hint: extra layer of management to handle contracts and profits for the executives/owner.)
Each time, my report was edited and adjusted. They then tweaked the opposite conclusions and contracted it out.
Anyway the additional jobs being added are sales clerk jobs, not just because of the season. We are a nation of sales clerks. Reminds me of England in the 1800s when they were a nation of Servants to the filthy rich.
These small often part time jobs replaced once better paying, unionized jobs. These jobs will not give us a vibrant middle class like we use to have. But they will require a second and third job and little pay. Insuring the filthy rich keep even more of our national wealth as they borrow to buy back their stock.
bucolic_frolic
(54,516 posts)to suit their political agenda. Ain't no doubt about it. I was told that in college, by an economics professor: a cost-benefit analysis can be tweaked to be anything you want it to be. Just change the assumptions a little, and change the numbers until they arrive at your goal. Cost-benefit analyses are definitely NOT impartial when coming from the GOP.
oldsoftie
(13,538 posts)We must start focusing more on technical training instead of pushing college degrees on EVERY high school student. Technical colleges are a fraction of the cost of a university. One way to not have a crushing student debt is to not need to run it up to start with

IronLionZion
(51,017 posts)What is seasonal adjustment?
Seasonal adjustment is a statistical technique that attempts to measure and remove the influences of predictable seasonal patterns to reveal how employment and unemployment change from month to month.
Over the course of a year, the size of the labor force, the levels of employment and unemployment, and other measures of labor market activity undergo fluctuations due to seasonal events including changes in weather, harvests, major holidays, and school schedules. Because these seasonal events follow a more or less regular pattern each year, their influence on statistical trends can be eliminated by seasonally adjusting the statistics from month to month. These seasonal adjustments make it easier to observe the cyclical, underlying trend, and other nonseasonal movements in the series.
As a general rule, the monthly employment and unemployment numbers reported in the news are seasonally adjusted data. Seasonally adjusted data are useful when comparing several months of data. Annual average estimates are calculated from the not seasonally adjusted data series.
Some more on the math used https://en.wikipedia.org/wiki/Seasonal_adjustment
bucolic_frolic
(54,516 posts)Trust your gut, and trust your nose. Who cranked out the latest employment numbers? Wilbur Ross? Or Larry Kudlow? You know what I mean?
IronLionZion
(51,017 posts)since ADP actually processes payroll for companies they have more real data while BLS uses a survey.
All through the Obama presidency the GOP claimed the numbers were cooked, so they are probably cooking the numbers now since there is less transparency now.
ritapria
(1,812 posts)BumRushDaShow
(167,250 posts)
ritapria
(1,812 posts)I read that. economic growth is slowing in the current quarter . .. I feel like a bit of a bad person for wanting an economic slowdown but it's better in the long term for all of us to be done with Trump
BumRushDaShow
(167,250 posts)They always used to use the term "fundamentals of the economy" and there have been a number of financial analysts who have been looking at other signs outside of the unemployment figures, that point to some weaknesses that are starting to mirror what happened in 2007. And the trade wars (and I think on December 15, the increase in the Chinese goods tariff is supposed to kick in) are pounding at whatever firewalls had been put in place when we came out of the last big recession. The pinch hasn't been felt quite yet due to all the inventory that had been on hand and has been slowly released... But eventually those tariffs are going to get reflected at some point and that may lead to "shortages" (in a relative/psychological sense) for certain types of "inexpensive" products, that will feed price increases on them (supply/demand). The retailers (or even wholesalers) will only eat those price increases but for so long before that gets passed onto the consumer.
progree
(12,808 posts)i.e. they peak several months after the economy has entered a recession. And likewise they don't hit bottom until several months after the economy has started to turn up.
Which isn't good news for the 2020 election because people focus on the jobs numbers (which come out monthly), and less so the GDP numbers (which come out quarterly). And people are viscerally much more affected by changes in the number of jobs than they are by changes in GDP. And it takes about a year for the NBER to declare a recession's start or end (the NBER is the official arbiter / decider on this).
BumRushDaShow
(167,250 posts)That's why I have been peeping at the quarterly GDP when it comes out.
It literally is "just like the weather" - where although the first day of summer (in the northern hemisphere) might be ~June 21st (which would be around the time of the longest day of the year), the warmest temps of "summer" lag that solstice date and aren't reached until about August (sorry, am a weather hobbyist ).
progree
(12,808 posts)Last edited Fri Dec 6, 2019, 12:58 PM - Edit history (1)
December 9: earliest sunset (really sucks when sun sets at 431 pm, so glad that situation will start improving soon -- but it so so slowly improves -- for example it won't reach 500 pm until January 17). (On Edit: the December 9 date applies to Minneapolis, latitude 45 deg N.
https://www.timeanddate.com/sun/usa/minneapolis?month=12)
December 21: solstice
Last week in January: coldest week of the year on average.
BumRushDaShow
(167,250 posts)that "solstice" period usually lasts about a week where the hours of day/night don't vary much while the earth continues to swing around the sun. I usually "visually" start seeing a "change" in winter daylight around February (and any of my plants that I overwinter inside start responding then by starting a little growth cycle).
mahatmakanejeeves
(68,824 posts)BumRushDaShow
(167,250 posts)December 7 is the Day of Infamy!  My mother was 11 at the time and used to talk about people gathering around the radio to hear FDR's speech.
I have a weather station with a console that shows the sunrise/sunset times for my latitude and I know we will be moving out of this "shortest day" period imminently (but will barely notice it). And even then, there will be the 3 more months of winter temperatures to come, which I'm not looking forward to! 
rockfordfile
(8,742 posts)mahatmakanejeeves
(68,824 posts)Last edited Fri Dec 6, 2019, 12:51 PM - Edit history (1)
Edited from a post from Saturday, September 7, 2019: Links to earlier reports:
-- -- -- -- -- --
[center]Past Performance is Not a Guarantee of Future Results.[/center]
Nonetheless, what is important is not this month's results, but the trend. Let’s look at some earlier numbers:
ADP® (Automatic Data Processing), for employment in November 2019:
U.S. private sector job growth slows down sharply in November: ADP
Bureau of Labor Statistics, for employment in October 2019:
U.S. economy added 128,000 jobs in October as GM strike displaced workers; jobless rate ticks up
Bureau of Labor Statistics, for employment in September 2019:
U.S. economy added just 136,000 jobs in September, in fresh sign economy is cooling
ADP® (Automatic Data Processing), for employment in September 2019:
ADP National Employment Report: Private Sector Employment Increased by 135,000 Jobs in September
Bureau of Labor Statistics, for employment in August 2019:
U.S. economy adds just 130,000 jobs in August amid worries
ADP® (Automatic Data Processing), for employment in August 2019:
Survey: Businesses added a solid 195,000 jobs in August
Bureau of Labor Statistics, for employment in July 2019:
U.S. Added 164,000 Jobs in July; Unemployment Rate at 3.7 Percent
ADP® (Automatic Data Processing), for employment in July 2019:
ADP says 156,000 private-sector jobs added created in July
Bureau of Labor Statistics, for employment in June 2019:
Hiring rebounds as U.S. economy adds 224,000 jobs in June;unemployment rate inched up to 3.7 percent
ADP® (Automatic Data Processing), for employment in June 2019:
U.S. private sector hiring picks up less than expected in June: ADP
Bureau of Labor Statistics, for employment in May 2019:
The U.S. economy added only 75,000 jobs in May amid bite from Trump's trade war
ADP® (Automatic Data Processing), for employment in May 2019:
ADP private-sector job growth tumbles to a 9-year low in May
Bureau of Labor Statistics, for employment in April 2019:
UPDATE: U.S. unemployment fell to 3.6 percent, lowest since 1969
ADP® (Automatic Data Processing), for employment in April 2019:
ADP National Employment Report: Private Sector Employment Increased by 275,000 Jobs in April
Bureau of Labor Statistics, for employment in March 2019:
UPDATE: U.S. added 196,000 jobs in March as economy shows signs of spring bounce
ADP® (Automatic Data Processing), for employment in March 2019:
Private sector hiring falls to 18-month low, and manufacturing sheds jobs, ADP says
Bureau of Labor Statistics, for employment in February 2019:
U.S. adds meager 20,000 jobs in February to mark smallest increase in 17 months
ADP® (Automatic Data Processing), for employment in February 2019:
ADP National Employment Report: Private Sector Employment Increased by 183,000 Jobs in February
Bureau of Labor Statistics, for employment in January 2019:
U.S. creates 304,000 jobs in January, unemployment rises to 4%
ADP® (Automatic Data Processing), for employment in January 2019:
U.S. added 213,000 private-sector jobs in January, ADP says
Bureau of Labor Statistics, for employment in December 2018:
Payroll employment increases by 312,000 in December; unemployment rate rises to 3.9%
ADP® (Automatic Data Processing), for employment in December 2018:
U.S. adds most private-sector jobs in almost 2 years, says ADP
Bureau of Labor Statistics, for employment in November 2018:
Payroll employment increases by 155,000 in November; unemployment rate unchanged at 3.7%
ADP® (Automatic Data Processing), for employment in November 2018:
U.S. adds 179,000 private-sector jobs in November: ADP
Bureau of Labor Statistics, for employment in October 2018:
The U.S. economy added 250,000 jobs in October, unemployment stays at 3.7 percent
ADP® (Automatic Data Processing), for employment in October 2018:
ADP National Employment Report: Private Sector Employment Increased by 227,000 Jobs in October 2018:
Bureau of Labor Statistics, for employment in September 2018:
Unemployment rate declines to 3.7% in September; payroll employment increases by 134,000
ADP® (Automatic Data Processing), for employment in September 2018:
U.S. adds 230,000 private-sector jobs in September: ADP
BumRushDaShow
(167,250 posts) House of Roberts
(6,439 posts)Not buying the BLS numbers.

maddogesq
(1,248 posts)but a difference of 200K is staggering.
January will tell the tale, especially when retailers start laying off.
None of this jibes with contractions in the ISM and other numbers that came across recently.
progree
(12,808 posts)It's a smaller survey than the Establishment Survey that produced the +266,000 number, but still interesting.
As for January, that will be interesting too -- remembering that they seasonally adjust the numbers, so unless the January layoffs are worse than typical for January, they won't look bad after seasonal adjustment.
Job changes tend to lag the economy (economic activity, GDP) by a few months.
progree
(12,808 posts)so happens both ways.
https://fredblog.stlouisfed.org/2019/04/the-big-february-employment-miss/

RussBLib
(10,465 posts)And I am pretty damn skeptical of them now. Would not surprise me at all if we learn down the road that Trump's Chumps were intentionally cooking the data.

MichMan
(16,888 posts)RussBLib
(10,465 posts)a bit of a conundrum
progree
(12,808 posts)or did some creative number-mixing and math by e.g. taking the then 94 million Not In The Labor Force and called them all unemployed and then declared that the "real" unemployment rate was 23%. In other words, "everyone here" had our reasons.
Also, I don't know if you were talking about DU -- I remember a very very different DU when Obama was president, and there sure were a lot of people crapping on the economic numbers in the months that they were good -- especially in the few months before elections when crapping on Obama's job numbers reached frenzied levels. Slowest recovery in history, blah blah, McJobs, etc., and yes, cooked and faked (in months when the numbers were good, but never when the numbers were bad. In the months when the numbers were bad, suddenly the numbers "proved" how bad the economy was).
BumRushDaShow
(167,250 posts)I think in some cases, the upward revisions in later months helped.
progree
(12,808 posts)When there is a downward revision of a prior month's (months') number(s), this clearly shows that the initial report was highballed when the media spotlight is shining on it, and then "quietly" revised down in later month(s), when downward revisions are rarely mentioned in media reports unless they are really really long ones and then revisions are mentioned in the middle of the 27th paragraph.
Upward revisions of course show they're quietly prettying up the numbers when the media spotlight isn't shining -- but a few months down the road they will be ballyhooing about how great the job growth has been over the past 6 months or past year or since January 2017 or November 2016 or whatever. And/or the BLS worker-bees are knuckling under pressure from their bosses to jack up the job numbers
BumRushDaShow
(167,250 posts) 

Politicub
(12,327 posts)The sector is technically experiencing a recession.
I was hoping someone would wander by and point out the obvious.
progree
(12,808 posts)all jobs, so a percent or so decline in the number of manufacturing jobs during some month hardly makes a dent in the overall job numbers. (This month manufacturing jobs went up because of the one-time factor of striking auto workers returning to work)
Politicub
(12,327 posts)progree
(12,808 posts)be a contraction in the number of manufacturing jobs and/or manufacturing production, while at the same time the overall jobs numbers can show substantial gains.
mahatmakanejeeves
(68,824 posts)progree
(12,808 posts)Manufacturing employment rose by 54,000 in November, following a decline of 43,000 in the prior month. Within manufacturing, employment in motor vehicles and parts was up by 41,000 in November, reflecting the return of workers who were on strike in October
mathematic
(1,605 posts)It's higher now than it was before the summer/fall dip and higher than it was a year ago. There was a spring/early summer dip but it's essentially been stationary since then.
Note that october's big dip was due to the GM strike, which was the largest in decades and a sign of a strong bargaining position by labor. So none of this points to us being in a manufacturing recession right now. If you're basing your knowledge on the ISM reports, you shouldn't. They're not the arbiter of recessions and their reports are bad indicators.
Preliminary data, of course, since it comes from today's report:
CES3000000001 - all employees, manufacturing sector
12826 12834 12831 12834 12836 12846 12850 12852 12854 12811(P) 12865(P)
CES3000000006 - production and nonsupervisory, manufacturing sector
9001 9007 8997 8981 8977 8973 8968 8968 8967 8931(P) 8978(P)
We care about recessions because we care about employment, right? There are the figures saying manufacturing employment is fine.
mahatmakanejeeves
(68,824 posts)Economic News Release USDL-19-2105
Employment Situation Summary
Transmission of material in this news release is embargoed until 8:30 a.m. (EST) Friday, December 6, 2019
Technical information:
Household data: (202) 691-6378 * cpsinfo@bls.gov * www.bls.gov/cps
Establishment data: (202) 691-6555 * cesinfo@bls.gov * www.bls.gov/ces
Media contact: (202) 691-5902 * PressOffice@bls.gov
THE EMPLOYMENT SITUATION -- NOVEMBER 2019
Total nonfarm payroll employment rose by 266,000 in November, and the unemployment rate was little changed at 3.5 percent, the U.S. Bureau of Labor Statistics reported today. Notable job gains occurred in health care and in professional and technical services. Employment rose in manufacturing, reflecting the return of workers from a strike.
This news release presents statistics from two monthly surveys. The household survey measures labor force status, including unemployment, by demographic characteristics. The establishment survey measures nonfarm employment, hours, and earnings by industry. For more information about the concepts and statistical methodology used in these two surveys, see the Technical Note.
Household Survey Data
Both the unemployment rate, at 3.5 percent, and the number of unemployed persons, at 5.8 million, changed little in November. (See table A-1.)
Among the major worker groups, the unemployment rates for adult men (3.2 percent), adult women (3.2 percent), teenagers (12.0 percent), Whites (3.2 percent), Blacks (5.5 percent), Asians (2.6 percent), and Hispanics (4.2 percent) showed little or no change in November. (See tables A-1, A-2, and A-3.)
The number of long-term unemployed (those jobless for 27 weeks or more), at 1.2 million, was essentially unchanged in November and accounted for 20.8 percent of the unemployed. (See table A-12.)
The labor force participation rate was little changed at 63.2 percent in November. The employment-population ratio was 61.0 percent for the third consecutive month. (See table A-1.)
The number of persons employed part time for economic reasons, at 4.3 million, changed little in November. These individuals, who would have preferred full-time employment, were working part time because their hours had been reduced or they were unable to find full-time jobs. (See table A-8.)
In November, 1.2 million persons were marginally attached to the labor force, down by 432,000 from a year earlier. (Data are not seasonally adjusted.) These individuals were not in the labor force, wanted and were available for work, and had looked for a job sometime in the prior 12 months. They were not counted as unemployed because they had not searched for work in the 4 weeks preceding the survey. (See table A-16.)
Among the marginally attached, there were 325,000 discouraged workers in November, down by 128,000 from a year earlier. (Data are not seasonally adjusted.) Discouraged workers are persons not currently looking for work because they believe no jobs are available for them. The remaining 921,000 persons marginally attached to the labor force in November had not searched for work for reasons such as school attendance or family responsibilities. (See table A-16.)
Establishment Survey Data
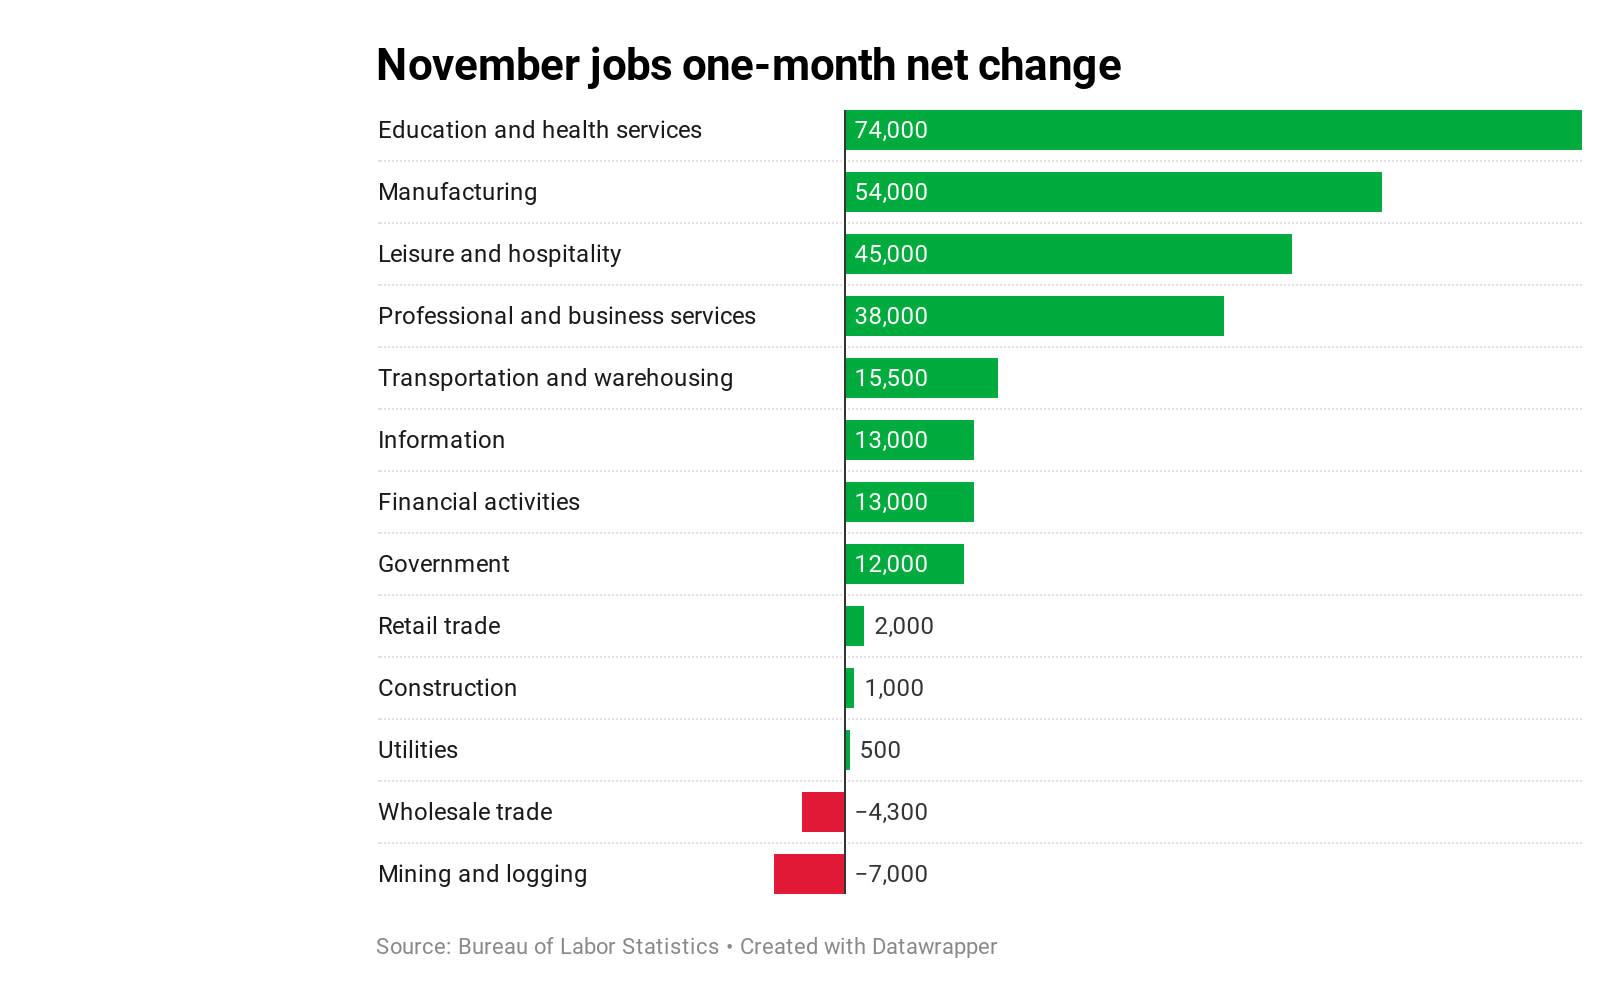
Total nonfarm payroll employment rose by 266,000 in November. Job growth has averaged 180,000 per month thus far in 2019, compared with an average monthly gain of 223,000 in 2018. In November, notable job gains occurred in health care and in professional and technical services. Employment also increased in manufacturing, reflecting the return of workers from a strike. Employment continued to trend up in leisure and hospitality, transportation and warehousing, and financial activities, while mining lost jobs. (See table B-1.)
In November, health care added 45,000 jobs, following little employment change in October (+12,000). The November job gains occurred in ambulatory health care services (+34,000) and in hospitals (+10,000). Health care has added 414,000 jobs over the last 12 months.
Employment in professional and technical services increased by 31,000 in November and by 278,000 over the last 12 months.
Manufacturing employment rose by 54,000 in November, following a decline of 43,000 in the prior month. Within manufacturing, employment in motor vehicles and parts was up by 41,000 in November, reflecting the return of workers who were on strike in October.
In November, employment in leisure and hospitality continued to trend up (+45,000). The industry has added 219,000 jobs over the last 4 months.
Employment in transportation and warehousing continued on an upward trend in November (+16,000). Within the industry, job gains occurred in warehousing and storage (+8,000) and in couriers and messengers (+5,000).
Financial activities employment also continued to trend up in November (+13,000), with a gain of 7,000 in credit intermediation and related activities. Financial activities has added 116,000 jobs over the last 12 months.
Mining lost jobs in November (-7,000), largely in support activities for mining (-6,000). Mining employment is down by 19,000 since a recent peak in May.
In November, employment in retail trade was about unchanged (+2,000). Within the industry, employment rose in general merchandise stores (+22,000) and in motor vehicle and parts dealers (+8,000), while clothing and clothing accessories stores lost jobs (-18,000).
Employment in other major industries--including construction, wholesale trade, information, and government--showed little change over the month.
In November, average hourly earnings for all employees on private nonfarm payrolls rose by 7 cents to $28.29. Over the last 12 months, average hourly earnings have increased by 3.1 percent. In November, average hourly earnings of private-sector production and nonsupervisory employees rose by 7 cents to $23.83. (See tables B-3 and B-8.)
The average workweek for all employees on private nonfarm payrolls was unchanged at 34.4 hours in November. In manufacturing, the average workweek increased by 0.1 hour to 40.5 hours, while overtime decreased by 0.1 hour to 3.1 hours. The average workweek of private-sector production and nonsupervisory employees held at 33.5 hours. (See tables B-2 and B-7.)
The change in total nonfarm payroll employment for September was revised up by 13,000 from +180,000 to +193,000, and the change for October was revised up by 28,000 from +128,000 to +156,000. With these revisions, employment gains in September and October combined were 41,000 more than previously reported. (Monthly revisions result from additional reports received from businesses and government agencies since the last published estimates and from the recalculation of seasonal factors.) After revisions, job gains have averaged 205,000 over the last 3 months.
_____________
The Employment Situation for December is scheduled to be released on Friday, January 10, 2020, at 8:30 a.m. (EST).
_____________________________________________________________________________________
Revision of Seasonally Adjusted Household Survey Data
In accordance with usual practice, The Employment Situation news release for December 2019, scheduled for January 10, 2020, will incorporate annual revisions to seasonally adjusted household survey data. Seasonally adjusted data for the most recent 5 years are subject to revision.
_____________________________________________________________________________________
_____________________________________________________________________________________
Upcoming Changes to Household Survey Data
With the publication of The Employment Situation for January 2020 on February 7, 2020, two not seasonally adjusted series currently displayed in Summary table A--persons marginally attached to the labor force and discouraged workers--will be replaced with new seasonally adjusted series. The new seasonally adjusted series will be available in the BLS online database back to 1994. Not seasonally adjusted data for persons marginally attached to the labor force and for discouraged workers will continue to be published in table A-16. These series will also be available in the BLS online database back to 1994.
Persons marginally attached to the labor force and discouraged workers are inputs into three alternative measures of labor underutilization displayed in table A-15. Therefore, with the publication of The Employment Situation for January 2020, data for U-4, U-5, and U-6 in table A-15 will reflect the new seasonally adjusted series. Revised data back to 1994 will be available in the BLS online database. Not seasonally adjusted series for the alternative measures will be unaffected.
Beginning with data for January 2020, occupation estimates in table A-13 will reflect the introduction of the 2018 Census occupation classification system into the household survey. This occupation classification system is derived from the 2018 Standard Occupational Classification (SOC) system. In addition, industry estimates in table A-14 will reflect the introduction of the 2017 Census industry classification system, which is derived from the 2017 North American Industry Classification System (NAICS). Historical data on occupation and industry will not be revised. Beginning with data for January 2020, estimates will not be strictly comparable with earlier years.
Also beginning with data for January 2020, estimates of married persons will include those in opposite-sex and same-sex marriages. Prior to January 2020, these estimates include only those in opposite-sex marriages. This will affect marital status estimates in tables A-9 and A-10. Historical data will not be revised.
_____________________________________________________________________________________
* * * * *
[center]Facilities for Sensory Impaired[/center]
Information from these releases will be made available to sensory impaired individuals upon request. Voice phone: 202-691-5200, Federal Relay Services: 1-800-877-8339.
progree
(12,808 posts)the economy is heading towards a recession.
Similarly, ADP numbers are more reliable when they are lower than the BLS numbers,
and less reliable when they are higher than the BLS numbers.
mahatmakanejeeves
(68,824 posts)Good afternoon.
mahatmakanejeeves
(68,824 posts)From BLS:
BumRushDaShow
(167,250 posts)They will have a fit!
mahatmakanejeeves
(68,824 posts)zzzzzzzzzzzz.
BumRushDaShow
(167,250 posts)
progree
(12,808 posts)

machoneman
(4,128 posts)2020 to be total lies to help Trump's campaign.
Hoyt
(54,770 posts)of other stuff that makes it clear he's the worst Prez of all time, but the economy is on his side. It's true that he's riding on Obama's accomplishments, but that won't sell to most people.
The jobs in this report appear pretty good --
 ?v=1575649296&w=630&h=354
https://www.cnbc.com/2019/12/06/heres-where-the-jobs-are-for-november-2019-in-one-chart.html
mahatmakanejeeves
(68,824 posts)Last edited Fri Jul 2, 2021, 05:42 PM - Edit history (2)
For everyone who thinks the BLS is just making this stuff up, there's contact information in here. You can write them and let them know you're on to them.
Last edited 4:40 p.m., Friday, October 4, 2019.
I used to run this every month in the commentary in the zeroeth post. It explains just about every aspect of the monthly report.
[center]Facilities for Sensory Impaired[/center]
Information from this release will be made available to sensory impaired individuals upon request. Voice phone: 202-691-5200, Federal Relay Services: 1-800-877-8339.
[center]Introduction[/center]
Good morning, Freepers and DUers alike. I especially welcome our good friends from across the aisle. You're paying for this information too, so I am absolutely delighted to have you participate in this thread. Please, everyone, put aside your differences long enough to digest the information. After that, you can engage in your usual donnybrook.
Full disclosure: I do not work for BLS, nor am I friends with anyone over there. I'm just someone who appreciates the work they do. My sole connection with the agency is that I've been in the building to pick up some publications.
Thank you for being a part of this thread.
If you don't have the time to study the report thoroughly, here is the news in a nutshell:
Commissioner's Statement on The Employment Situation
It is easy to find one paragraph, or one sentence, or one datum in this report that will support the most outlandish of conclusions, from "the sky is falling" to "we'll have blue skies, nothing but blue skies, from now on." Easy, but disingenuous.
Every month, you can find something in the report that will cause you concern. Take the information in context. Consider not just this month’s data, but the trend.
Please take the time to look at progree's thread. Here is the latest version:
EF-0. Economic Statistics with links to official sources
Also of interest is another one of his pages, last edited Sun Feb 9, 2020:
EF-5. National Debt. Deficits and Surpluses
Let's begin with a couple of questions:
[center]What Is the Bureau of Labor Statistics?
Why Does It Release All These Numbers Every Month?[/center]
The BLS data must satisfy a number of criteria, including relevance to current social and economic issues, timeliness in reflecting today’s rapidly changing economic conditions, accuracy and consistently high statistical quality, and impartiality in both subject matter and presentation. To avoid the appearance of partiality, the dates of major data releases are scheduled more than a year in advance, in coordination with the Office of Management and Budget.
[font color="red"]New material, added August 29, 2016:[/font] Print title, Washington Post, Saturday, March 10, 2012, front page, above the fold: "Watching the clock: Monthly data release is an economic, political obsession timed to the nanosecond"
By Eli Saslow
http://twitter.com/elisaslow
March 9, 2012
The release of employment numbers by the Bureau of Labor Statistics has long been a ritual in Washington, but lately it has turned into an obsession during an election year defined by economic instability. Once each month, a nondescript government agency compiles and releases 24 tables of economic data that have come to define the 2012 election and so much else. Republican presidential candidates turn the numbers into speeches. The president’s staff monitors how they affect his approval rating. The Federal Reserve reevaluates interest rates. Investors prepare for the stock market to rise or fall, sometimes swinging in value by $150 billion in the minutes after the report is released.
{snip}
The raw data had arrived at the Bureau of Labor Statistics (BLS), like always, on Wednesday the week before the report’s release: millions of characters representing survey information from 55,000 households; and then, a few days later, monthly payroll data from 486,000 businesses. Kosanovich’s boss posted a two-page schedule on the office wall, detailing the tasks ahead for a team of more than 20 economists. They would be required to make a series of six deadlines. Their work would undergo 15 fact checks and then 15 clearance reviews. They would sit together in a windowless conference room and read aloud from their eventual creation, a three-page news release and 24 data tables, debating commas and verbs for hours on end.
They would do it all with absolute discretion during an eight-day security lockdown, signing confidentiality agreements each morning, encrypting their computers and locking data into a safe every time they walked 10 yards away to use a bathroom. “Is your workstation secure?” asked a sign in the hallway. They all remembered the last security miscue, in November 2008 — the accidental transmission of some data to one wire service a full 25 seconds before the report’s scheduled release, an incident that had necessitated a series of internal investigations and revisions.
“We always tape paper over the windows of the conference room or draw the shades,” Kosanovich said about her typical routine during a lockdown. She made a habit of refraining from answering phone calls or e-mails from unknown numbers and never discussing data outside her office. For eight days, nobody visited her team’s floor at BLS without a security clearance. The custodial staff did not empty their trash until the report was released.
{snip}
[center]Household Survey vs. Establishment Survey[/center]
From the February 10, 2011, DOL Newsletter:
Secretary Solis answers three questions about how the Bureau of Labor Statistics calculates unemployment rates.
How does BLS determine the unemployment rate and the number of jobs that were added each month?
BLS uses two different surveys to get these numbers. The household survey, or Current Population Survey (CPS), involves asking people, from about 60,000 households, a series of questions to assess each person in the household's activities including work and searching for work. Their responses give us the unemployment rate. The establishment survey, or Current Employment Statistics (CES), surveys 140,000 employers about how many people they have on their payrolls. These results determine the number of jobs being added or lost.
[font color="red"]New material, added March 9, 2018:[/font]
People often wonder how in the world the BLS comes up with all this information. This article from two months ago will help explain things:
JANUARY 2018
The Current Population Survey—tracking unemployment in the United States for over 75 years
For more than three-quarters of a century, the Current Population Survey has been a vital tool for providing information on U.S. unemployment and other aspects of labor market performance. This article highlights major developments in the survey’s history.
The Current Population Survey (CPS) has been conducted for more than three-quarters of a century.1 From the outset, the main purpose of the survey has been to gather information on the employment status of the U.S. population, with an emphasis on the measurement of unemployment. CPS data have been used by policymakers and others to gauge both the degree of labor market weakness during recessions and the strength of the job market in economic expansions. More than 900 monthly reports on national employment and unemployment have been issued since the survey began in March 1940.
The survey also has been used to provide a wealth of information on a wide range of other subjects—some related to the labor market and some unrelated—through supplemental questions to the basic survey instrument. Over the years, supplements to the CPS have been used to collect data on topics ranging from income and worker displacement to tobacco use and participation in the arts.
The main objective of the CPS, however, has always been to measure unemployment and other aspects of labor market performance. This article summarizes some of the major developments in achieving this goal over the past three-quarters of a century.
....
[center]Complaint Department[/center]
I post this information on a nonpartisan basis. I am not here to make elected officials of any party or persuasion look good. I am certain that the people who compile these data are of the same outlook. They are civil servants. They do not work for a party; they work for you, the American people.
My only contribution is to cut and paste a few paragraphs from the BLS and then, in the commentary, link to some sources that I feel are trustworthy. I hope people come away with a better understanding of the data after reading this thread. Once again, I do not work for BLS, but I will nonetheless try to assist if I can.
If you feel the Bureau of Labor Statistics is handing out bunk, start here:
Point of Contact for Complaints Concerning Information Quality
Division of Management Systems
Bureau of Labor Statistics
U.S. Department of Labor
2 Massachusetts Avenue, N.E., Room 4080
Washington, D.C., 20212-0001
E-mail: dataqa@bls.gov
Fax: (202) 691-5111
Complainants should:
Identify themselves and indicate where and how they can be reached;
Identify, as specifically as possible, the information in question;
Indicate how they are affected by the information about which they are complaining;
Carefully describe the nature of the complaint, including an explanation of why they believe the information does not comply with OMB, Departmental, or agency-specific guidelines; and
Describe the change requested and the reason why the agency should make the change.
Failure to include this information may result in a complainant not receiving a response to the complaint or greatly reducing the usefulness or timeliness of any response. Complainants should be aware that they bear the burden of establishing that they are affected persons and showing the need and justification for the correction they are seeking, including why the information being complained about does not comply with applicable guidelines.
[center]How Do You Define Unemployment?
The Large Print Giveth, and the Fine Print Taketh Away.[/center]
Long ago, a DUer pointed out that, if I'm going to post the link to the press release, I should include the link to all the tables that provide additional ways of examining the data. Specifically, I should post a link to Table A-15. Alternative measures of labor underutilization. Table A-15 includes those who are not considered unemployed, on the grounds that they have become discouraged about the prospects of finding a job and have given up looking. Here is that link:
Table A-15. Alternative measures of labor underutilization
Also, hat tip, Recursion: How the Government Measures Unemployment
[center]What About Employment on Farms?[/center]
[font color="red"]New material, added May 4, 2018:[/font]
Note that the BLS establishment survey measures only "nonfarm payroll employment."
Nonfarm payrolls
I'm hoping the following link goes to an impartial site:
What is 'Nonfarm Payroll'
So who measures employment on farms? Hmmmmmm....
Economic Research Service
Farm Labor
ERS provides information on a range of farm labor issues, including:
• Size and composition of the U.S. agricultural workforce (self-employed versus hired)
• Recent trends in the employment of hired farmworkers
• Demographic characteristics of hired farmworkers, including age, sex, and nativity
• Geographic distribution of hired farmworkers (all occupations)
• Wages of hired farmworkers
• Labor cost share of total gross revenues
• H-2A temporary agricultural visa program
• Adverse Effect Wage Rate (AEWR)
• Legal status and migration practices of hired crop farmworkers
Finally, we provide links to key data sources with summaries.
[font color="red"]New material, added August 8, 2016:[/font]
This appeared at the top of page A2 in the Wednesday, July 27, 2016, print edition of The Wall Street Journal. as "Jobless Picture is Open to Interpretation."
Gauges used to measure unemployment vary in how they define who is out of work {print: "Political campaigns clash over different ways of measuring unemployment"}

By Josh Zumbrun
josh.zumbrun@wsj.com
@JoshZumbrun
July 26, 2016 7:56 p.m. ET
Because political campaigns can rise and fall on the health of the economy, spats often flare over the gauges used to measure growth and unemployment.
The latest dust-up, raised by the campaign of Republican presidential nominee Donald Trump, focuses on the monthly employment numbers. A long streak of hiring has nudged the jobless rate down to 4.9%. ... Donald Trump Jr., the nominee’s son, recently criticized the official statistics as “artificial numbers…massaged to make the existing economy look good.”
The nominee himself has said unemployment is far higher than the Labor Department’s headline 4.9% rate would suggest, part of his message that the economy is in a dire state. After he won the New Hampshire primary in February, Mr. Trump called the official jobless figures “phony” and said the real number could be as high as 42%.
This isn’t the first time people have cast aspersions on the jobs numbers in an election year, but the Trump claim is also part of a larger discussion over how best to assess the health of the labor market.
The following link to Barron's might not work for everyone. See progree's tips.[/font] From the July 20, 2015, issue of Barron's:
Refresher Course: Inside the Jobless Numbers
By Gene Epstein
July 18, 2015
The unemployment rate has never been the object of as much attention from the markets and the media as it is now, sparked by the keen interest taken in its monthly fluctuations by policy makers at the Federal Reserve.
Despite the heightened focus, there are a lot of misunderstandings and misconceptions about how the rate is calculated. Some people assume the Bureau of Labor Statistics compiles the rate from the unemployment-insurance rolls. On that basis, they fault the BLS for undercounting the unemployed. But that’s just one myth among many about this cornerstone measure of economic pain and labor-market slack.
To estimate the unemployment rate, the BLS actually relies on the monthly Current Population Survey conducted for it by the Census Bureau. While the data are highly imperfect in their own way, we think the Federal Reserve is right to view the official unemployment rate as the best available information, while also keeping its eye on ancillary measures of “labor underutilization.”
In fact, a close look at BLS methods suggests that, if anything, the official unemployment rate may be overcounting rather than undercounting the unemployed.

[font color="red"]New material:[/font] In August 2015, DUers whatthehey and progree got into a 1995 report from economists John E. Bregger and Steven E. Haugen. The .pdf is unfortunately an image and thus challenging as a source of quotes. Trying to find it in a format that does make for easy copying, I was led to this:
Alternative Unemployment Rates: Their Meaning and Their Measure March 12, 2014
[center]Why Won't You Talk About the Labor Force Participation Rate (LFPR)?[/center]
Every month in certain circles, someone will cite the labor force participation rate as a cause for concern. Let's look at that right now.
[font color="red"]New material, added September 30, 2016:[/font]
Labor force participation: what has happened since the peak?
The labor force participation rate is the percentage of the civilian noninstitutional population 16 years and older that is working or actively looking for work. It is an important labor market measure because it represents the relative amount of labor resources available for the production of goods and services. After rising for more than three decades, the overall labor force participation rate peaked in early 2000 and subsequently trended down. In recent years, the movement of the baby-boom population into age groups that generally exhibit low labor force participation has contributed to the decline in the overall participation rate. From 2000 to 2015, most of the major demographic groups saw a decrease in labor force participation. Teenagers experienced the largest drop in participation, which coincided with a rise in their school enrollment rate. Young adults 20 to 24 years also showed a decline in labor force participation, but the decrease was not as steep as that for teenagers. The labor force participation rate of women 25 to 54 years also fell, with the decrease more pronounced for women who did not attend college. The labor force participation rate of men 25 to 54 years continued its long-term decline. As in the past, the decrease in participation among men with less education was greater than that of men with more education. However, labor force participation rates of men and women 55 years and older rose from 2000 to 2009 and subsequently leveled off.
[font color="red"]New material, added July 31, 2016:[/font]
Title in the print edition of the Washington Post, page A17, Wednesday, July 27, 2016: "The unemployment-rate 'conspiracy' that isn't"
By Matt O'Brien July 26
matthew.obrien@washpost.com
@ObsoleteDogma
The unemployment rate is not a conspiracy. It is not manipulated by the Bureau of Labor Statistics. And anyone who suggests otherwise is either uninformed, or trying to misinform others.
Which is to say that you shouldn't listen to Donald Trump & Co. For a year now, the alleged billionaire has insisted that the "real" unemployment rate is something like 42 percent instead of the 4.9 percent it actually is. He hasn't said how he's gotten this — maybe it's from the same "extremely credible source" who told him President Obama's birth certificate was fake? (1) — but the simplest explanation is that he's just ballparking how many adults don't work. That's 40.4 percent right now. The problem with using that number, though, is that it counts college students and stay-at-home parents and retirees as being equally "unemployed" as people who are actively looking for work but can't find any. So it doesn't tell us too much, at least not on its own, unless you think it's a problem that we have more 70-year-olds than we used to.
(1)
Link to tweet
Or unless conspiracy theories are one of your favorite accessories, as seems to be the case with the father, and now the son, Donald Trump Jr. On Sunday, he told CNN's Jake Tapper that the official unemployment numbers are "artificial" ones that are "massaged to make the existing economy look good" and "this administration look good."
....

Source: BLS
....
The boring truth is that the economy is in a lot better shape than it was when Obama took office, but that it could be in better shape still. The recovery, in other words, still has a ways to go. But that's a lot different from saying that we have 40 percent unemployment and that the government is trying to cover it up. That just suggests you don't understand — or don't want to accurately describe — how stats work and you don't know how to look up the ones you think the BLS is hiding. ... It's not what you'd expect from a major party presidential candidate.
[font color="red"]New material, added June 27, 2016:[/font]
https://www.washingtonpost.com/news/wonk/wp/2016/06/20/why-americas-men-arent-working/
Why America’s men aren’t working]
By Ylan Q. Mui June 20
The national unemployment rate has fallen by more than half since the nation emerged from the worst economic crisis since the Great Depression. It peaked at 10 percent in 2010 and stood at just 4.7 percent last month.
That’s mostly good news: Private employers have added more than 14 million jobs. About 2 million people have been out of a job for six months or longer, far too many but only about a quarter of the number of long-term unemployed people seven years ago. By almost every measure, the labor market has made incredible progress.
But there’s one statistic that has been vexing economists. The size of the nation’s workforce -- known as the labor force participation rate -- continues to fall. Since the start of the downturn, the percentage of that population that has a job or is looking for one has dropped more than 3 percentage points, to 62.6 percent, a level not seen since the 1970s.
{America’s jobs market has had a great 2016. Will it last?}
The problem is particularly pronounced among men between the ages of 25 and 54, traditionally considered the prime working years. Their participation rate has been declining for decades, but the drop-off accelerated during the recession. The high mark was 98 percent in 1954, and it now stands at 88 percent. A new analysis from the White House’s Council of Economic Advisers, slated for release Monday, found that the United States now has the third-lowest participation rate for “prime-age men” among the world’s developed countries.
....

....
People in prison are not counted as part of the population for the purposes of labor market statistics. At first blush, that would actually boost the participation rate: A smaller population means the share in the workforce is larger. But in reality, there are immense and well-documented barriers to the job market for workers once they leave prison. And the gloomy prospects of the formerly incarcerated outweigh the statistical benefit of having a large prison population.

....
Ylan Q. Mui is a financial reporter at The Washington Post covering the Federal Reserve and the economy. Follow @ylanmui
[font color="red"]New material, added January 2016:[/font] People who are not in the labor force: why aren't they working?
December 2015 | Vol. 4 / No. 15
EMPLOYMENT & UNEMPLOYMENT
People who are not in the labor force: why aren't they working?
By Steven F. Hipple
People who are neither working nor looking for work are counted as “not in the labor force,” according to the U.S. Bureau of Labor Statistics. Since 2000, the percentage of people in this group has increased. Data from the Current Population Survey (CPS) and its Annual Social and Economic Supplement (ASEC) provide some insight into why people are not in the labor force. The ASEC is conducted in the months of February through April and includes questions about work and other activities in the previous calendar year. For example, data collected in 2015 are for the 2014 calendar year, and data collected in 2005 are for the 2004 calendar year.1 In the ASEC, people who did not work at all in the previous year are asked to give the main reason they did not work. Interviewers categorize survey participants’ verbatim responses into the following categories: ill health or disabled; retired;2 home responsibilities; going to school; could not find work;3 and other reasons.
This Beyond the Numbers article examines data on those who were not in the labor force during 2004 and 2014 and the reasons they gave for not working. The data are limited to people who neither worked nor looked for work during the previous year.
This July 2014 report from the Council of Economic Advisers addresses the LFPR:
THE LABOR FORCE PARTICIPATION RATE SINCE 2007: CAUSES AND POLICY IMPLICATIONS
(Hat tip, Adrahil: Look deeper.)
[font color="red"]New material:[/font] Here's a Power Point (or equivalent) presentation given by Jason Furman, Chairman of the Council of Economic Advisers, before the National Press Club on August 6, 2015. If you go to the next-to-the-last slide, you'll see that the long-term projected trend is down:
"Trends in Labor Force Participation", 8/6/15
(Hat tip, progree: Over the past month, over the past year, and since February 2010)
[font color="red"]New material:[/font] Paul Vigna had a comment about the LFPR in the December 4, 2015, MoneyBeat column about the November figures:
Breaking down the participation rate
by Paul Vigna
Here’s what we mean when we talk about the participation rate and employment-population ratio.
There are 251.7 million people in the “civilian noninstitutional population,” according to the BLS (this is all contained in this chart). This is the number of people over age 16 who are not in jail or health-care facilities or the military.
Of that group, 157.3 million comprise the civilian labor force. The ratio of the second group to the first is 62.5%. This is the labor force participation rate, the number of people who could be in the labor force – either working or looking for a job – who are in the labor force.
There are 149.3 million people working. The ratio of that group to the overall civilian population is 59.3%. This the employment-population ratio, the number of people who could be working who actually are working.
Why do these number matter? Well, if you just looked at the raw data, you’d see the numbers rising, more or less, month after month. That’s not because the economy’s so rip-roaring, but because the number of people in the nation keeps rising. So you need the ratios to get a sense of how strong the labor force really is.
The labor-force participation rate remains near multi-decade lows, and whether that’s due to demographics, as in people retiring, or weak job opportunities, or whatever, it points to one sort of unavoidable problem: the economy cannot grow at its full potential if you simply don’t have enough people contributing.
Oh, and for the record, there are 94.4 million people not in the labor force.
[font color="red"]New material, added December 2015:[/font]
Dec 8, 2015
economics
As America’s Workforce Ages, Here’s Where the Jobs Will Be
By Jeffrey Sparshott
Jeffrey.Sparshott@wsj.com
@jeffsparshott
The U.S. labor force is expected to expand only slowly over the coming decade as the country ages and more Americans give up on holding a job, a potential drag on broader economic growth.
The economy is expected to generate 9.8 million new jobs, a 6.5% increase, from 2014 to 2024, the Labor Department said in new projections released Tuesday. While steady, that is a historically slow pace. By comparison, 10-year job creation averaged almost 14% during the 2001-07 expansion and close to 17% during the 1990s.
The slowdown highlights declining participation as baby boomers retire and younger Americans opt out of the workforce. Those two trends are expected to continue to push the labor-force participation rate lower, to 60.9% in 2024 from 62.9% in 2014, Labor estimates. If realized, that would be the lowest level since 1973, when Richard Nixon was president.
Federal Reserve Chairwoman Janet Yellen at a congressional hearing last week held out hope the participation rate would hold near current levels as people came off the sidelines and into jobs.
[center]Nattering Nabobs of Negativism[/center]
[font color="red"]New material, added February 26, 2016:[/font] More High-Wage Employment Doesn't Mean the Job Market's Out of the Woods
That's the print edition title.
The recovery is generating more high-wage jobs — but does that matter?
The U.S. is still digging out of a big hole, and isn't creating new opportunities for those whose jobs disappeared.
By Lydia DePillis February 24
@lydiadepillis
A couple of weeks ago, some economists from Goldman Sachs came out with a rosy pronouncement: "Millions of new jobs and plenty of good ones," read the headline on a note to investors. High-wage employment appeared to pick up from 2013 to the present, a change from the early years of the economic recovery, which generated a disproportionate number of low-wage jobs.

And you don’t have to just take it from an investment bank. The Department of Labor has run its own numbers, and saw similar growth back in October, rendered in absolute numbers rather than growth rates (which Labor’s Chief Economist Heidi Shierholz says held through the end of 2015 in an analysis the department completed last week).
The green bars in the graph below show changes in actual employment, and the orange line shows what it would have been if the growth had been evenly distributed. Shierholz says the loss of low-wage jobs is likely a result of workers in those categories having their wages bumped up above $10 an hour, as the huge growth in low-wage sectors from 2009-2013 led to competition for people in restaurants and retail, or finding better jobs.

That renewed growth in high-wage jobs, which started to show up in 2014, is typical of recoveries from recessions: Low-wage retail and restaurant jobs come back first, as consumers start to buy small-ticket items and go out to eat again. Later on, the profitability trickles up, leading firms to make more expensive hires. Overall, the trend could be responsible for the small uptick in wages that's become evident in recent months, as well.
[font color="red"]Revised material:[/font] Here’s a grim thought:
Fed economists: America’s missing workers are not coming back
By Max Ehrenfreund September 12 {2014}
A paper by Federal Reserve staff that will be discussed at the Brookings Institution on Friday {September 12, 2014} possibly hints at the central bank's thinking on interest rates and employment in advance of a consequential Fed meeting next week. The findings support [links:http://online.wsj.com/articles/fed-minutes-rate-hike-debate-heating-up-1408557628|hawks] on the Federal Open Market Committee, who feel that the Fed needs to prepare to raise rates sooner than expected, although the results are still being debated and might not persuade the committee's more dovish members.
The paper discusses the number of people who consider themselves part of the workforce -- including both people who have a job and those who are looking for work. It is a measure of the total manpower available in the U.S. economy. This number, the labor force participation rate, has been decreasing steadily since 2000. Americans who can't find work have been leaving the workforce, as have more and more retirees as the population ages.
Let’s follow that with another grim thought:
Why wage growth disparity tells the story of America's half-formed economic recovery
chico.harlan@washpost.com
@chicoharlan
....
With unemployment down to 5.8 percent, the country’s half-formed recovery is often described with a convenient shorthand: We have jobs but little wage growth. But stagnancy is just an average, and for many Americans, the years since the financial crisis have pushed them farther from the line, according to a detailed analysis of government labor statistics by The Washington Post.
....
Among the winners in this climate: Older workers, women and those with finance and technology jobs. ... Among the losers: Part-timers, the young, men, and those in the health, retail and food industries.
....
Chico Harlan covers personal economics as part of The Post's financial team.
Dissenters, take note:
A New Reason to Question the Official Unemployment Rate
AUG. 26, 2014
The Labor Department’s monthly jobs report has been the subject of some wacky conspiracy theories. None was wackier than the suggestion from Jack Welch, the former General Electric chief executive, that government statisticians were exaggerating job growth during President Obama’s 2012 re-election campaign. Both Republican and Democratic economists dismissed those charges as silly.
But to call the people who compile the jobs report honest, nonpartisan civil servants is not to say that the jobs report is perfect. The report tries to estimate employment in a big country – and to do so quickly, to give policy makers, business executives and everyone else a sense of how the economy is performing. It’s a tough task.
And it has become tougher, because Americans are less willing to respond to surveys than they used to be.
A new academic paper suggests that the unemployment rate appears to have become less accurate over the last two decades, in part because of this rise in nonresponse. In particular, there seems to have been an increase in the number of people who once would have qualified as officially unemployed and today are considered out of the labor force, neither working nor looking for work.
[font color="red"]New material, added January 2016:[/font] From July 2013:
Mort Zuckerman: A Jobless Recovery Is a Phony Recovery
Mort Zuckerman: A Jobless Recovery Is a Phony Recovery
More people have left the workforce than got a new job during the recovery—by a factor of nearly three.
By Mortimer Zuckerman
July 15, 2013 7:09 p.m. ET
In recent months, Americans have heard reports out of Washington and in the media that the economy is looking up—that recovery from the Great Recession is gathering steam. If only it were true. The longest and worst recession since the end of World War II has been marked by the weakest recovery from any U.S. recession in that same period.
The jobless nature of the recovery is particularly unsettling. In June, the government's Household Survey reported that since the start of the year, the number of people with jobs increased by 753,000—but there are jobs and then there are "jobs." No fewer than 557,000 of these positions were only part-time. The survey also reported that in June full-time jobs declined by 240,000, while part-time jobs soared by 360,000 and have now reached an all-time high of 28,059,000—three million more part-time positions than when the recession began at the end of 2007.
That's just for starters. The survey includes part-time workers who want full-time work but can't get it, as well as those who want to work but have stopped looking. That puts the real unemployment rate for June at 14.3%, up from 13.8% in May.
The 7.6% unemployment figure so common in headlines these days is utterly misleading. An estimated 22 million Americans are unemployed or underemployed; they are virtually invisible and mostly excluded from unemployment calculations that garner headlines.
....
Mr. Zuckerman is chairman and editor in chief of U.S. News & World Report.
[center]On the Road Again[/center]
The DOL Newsletter - October 6, 2011
Have an iPhone, iPod Touch or Android phone? Now you can access the latest labor data and news from the department's Bureau of Labor Statistics and Employment and Training Administration in the palm of your hand. The latest free mobile app displays real-time updates to the unemployment rate, Unemployment Insurance initial claims, the Consumer Price Index, payroll employment, average hourly earnings, the Producer Price Index, the Employment Cost Index, productivity, the U.S. Import Price Index and the U.S. Export Price Index in real time, as they are published each week, month or quarter. News releases providing context for the data can also be accessed through the app and viewed within a mobile browser or as PDF documents.
US Labor Department launches economic and employment statistics app
WASHINGTON — The most up-to-date employment data and economic news releases from the U.S. Department of Labor's Bureau of Labor Statistics and its Employment and Training Administration now can be viewed using a new mobile application.
....
The new app is currently available for the iPhone and iPod Touch as well as Android phones. The Labor Department is working to develop versions for BlackBerry and iPad devices. Visit https://m.dol.gov/apps/ to download this and other mobile apps.
Download the Data, Other Mobile Apps
[center]A Few More Things[/center]
[font color="red"]New material, added July 8, 2017:[/font]
By Ezra Klein January 13, 2012
....
But it would be even better if voters had a consistent benchmark for judging a president’s performance. The question — and it’s a tough one — is how to separate the very real influence the president has on the economy from the myriad other factors that weigh on whether consumers spend and businesses hire. So I put the issue to an exclusive club of economists who have an unusually fine-grained understanding of what the president can and can’t do: the former chairs of the president’s Council of Economic Advisers. And I asked each the same question: How much of national job creation during a presidency can we properly attribute to the president?
“Very little,” wrote Harvard’s Martin Feldstein in an e-mail. Feldstein led the CEA under Reagan, and he didn’t see much role for the president in normal economic times. “The key is growth of population and labor force participation. Policy — primarily monetary policy — affects cyclical conditions and therefore the unemployment rate. Fiscal policy is usually irrelevant but with interest rates at the current level there has been a role for fiscal policy.”
Laura D’Andrea Tyson, a Berkeley economist who served under President Clinton, emphasized the need to consider timing in our evaluations. “There are significant lags between the time a President proposes a policy, the time it is enacted by Congress and the time necessary for it to take effect,” she wrote to me. “These lags should be taken into account in measuring the economy’s job performance under a President. The first year probably should not count at all in terms of assessing the effects of a new Administration’s policies.”
Greg Mankiw, a Harvard economist who served as CEA chair under George W. Bush, directed me to a blog post he had written on the subject. “Randomness is a fact of economic life,” Mankiw wrote, “and it would be a mistake to judge a president by the economic outcome during his administration. It is better to look at the decisions the president made, and to acknowledge that the outcome is a function of those decisions and many other factors not under his control. As an economist, I have views about what best practices are for economic policy, and I judge presidents by how closely they adhere to those principles.” ... “Unfortunately,” he concluded, “that evaluation process is not quite as simple and objective as the reader might have hoped for. But I don’t think there is a better alternative.”
....
kleine@washpost.com
https://twitter.com/ezraklein
[font color="red"]New material, added February 4, 2016:[/font] This article appeared as "Stocks vs. the Economy: Which Ruins Which?"on page C2 of the print edition of The Wall Street Journal. on Tuesday, February 2, 2016.
2:49 pm ET
Feb 1, 2016
Markets
By John Carney
Don’t confuse the market for the economy. Markets have overshot fundamentals. There are no signs of contagion into the real economy. ... Anyone paying attention has heard some version of these sentiments lately. Paul Samuelson’s famous quip that the market has predicted nine of the past five recessions is once again on the lips of the wise men and women of Wall Street.
But what if the stock market is more than just an indicator? What if a stock selloff can actually cause unemployment and recessions? ... That’s exactly what historical data on the stock market and the unemployment rate running back to 1929 seem to suggest. A persistent 10% decline in the stock market pushes unemployment up three percentage points.
That, at least, is the finding of University of California Los Angeles economist Roger Farmer. Currently a Distinguished Professor of Economics at UCLA and a Visiting Scholar at the Federal Reserve Bank of San Francisco, Mr. Farmer has been a fellow at the Bank of England and has won awards for his work on inefficiency in financial markets and self-fullfilling prophecies.
In a pair of academic papers written in the wake of the financial crisis, the first published in 2012 and the second published this year, Mr. Farmer has argued that changes in the value of the stock market cause changes in the unemployment rate. The idea will be expanded upon in Mr. Farmer’s forthcoming book, Prosperity for All.
[font color="red"]Moved here, February 6, 2016:[/font] The Federal Reserve looks at, among many other things, the BLS employment reports when it decides what to do with "the interest rate." The interest rate in question is the federal funds target rate. Here is some information about that:
Federal funds rate
Meet FRED, every wonk’s secret weapon
By Todd C. Frankel August 1, 2014
FRED stands for Federal Reserve Economic Data. It serves as an online clearinghouse for a wealth of numbers: unemployment rates, prices of goods, GDP and CPI, things common and obscure. Today, FRED is more than a little bit famous, thanks to the public’s fascination with economic data.
Federal Reserve Economic Data
So how many jobs must be created every month to have an effect on the unemployment rate? There's an app for that:
Federal Reserve Bank of Atlanta Jobs Calculator™
(Note new link for Jobs Calculator™. Hat tip, progree.)
Monthly Employment Reports from BLS
The U.S. Department of Commerce releases economic data too. Some of its releases come from the U.S. Census Bureau:
U.S. Census Bureau Latest News
U.S. Census Bureau Economic Indicators
Other Department of Commerce releases come from the Bureau of Economic Analysis:
Bureau of Economic Analysis
For people who need a daily fix:
BLS-Labor Statistics Twitter feed
Read tomorrow's news before it happens. Here's the schedule for all economic reports:
MarketWatch Economic Calendar
and for BLS reports only:
Bureau of Labor Statistics Release Calendar

JonLP24
(29,883 posts)How do they factor in job numbers?
BumRushDaShow
(167,250 posts)"no longer in the workforce / not seeking" although I have never seen what the survey form looks like and had wondered if they ever asked such a question. I know that I retired almost 3 years ago and am not "seeking" any work so I really don't consider myself "unemployed" (I get a federal retirement annuity).