'Very troubling:' Wisconsin surpasses 3k daily cases of COVID-19
Source: fox6now.com
Published 3 hours ago
A new daily record, over 3,000 positive cases of coronavirus. A record Wisconsin health officials did not want to break. As temperatures have dropped, health experts say people are partaking in more activities indoors — contributing to the uptick in cases.
MILWAUKEE - A new daily record, over 3,000 positive cases of coronavirus. A record Wisconsin health officials did not want to break.
As temperatures have dropped, health experts say people are partaking in more activities indoors — contributing to the uptick in cases.
..............
Officials are reminding us, that every person we see outside our household increases our risk and that of others.
"It's a tough time here in Wisconsin," said Julie Willems Van Dijk of the Wisconsin Health Department.
.............................
Read more: https://www.fox6now.com/news/very-troubling-wisconsin-surpasses-3k-daily-cases-of-covid-19
Alternate care facility opens at Wisconsin State Fair.
https://www.fox6now.com/news/gov-evers-activates-field-hospital-as-covid-19-keeps-surging

 = new reply since forum marked as read
Highlight:
NoneDon't highlight anything
5 newestHighlight 5 most recent replies
= new reply since forum marked as read
Highlight:
NoneDon't highlight anything
5 newestHighlight 5 most recent replies

SheltieLover
(78,341 posts)

BumRushDaShow
(167,253 posts)
Here in PA, we had some 1,300 cases yesterday after having gotten down into the 600s - 800s/day just a month or so ago. Even here in Philly, we have more than doubled are daily counts.
progree
(12,809 posts)Daily new cases, 7 day moving average
04/10: 1673 first wave peak
07/29: 962 2nd wave peak
08/23: 623 low point following 2nd wave peak
10/08: 1128 latest
https://www.nytimes.com/interactive/2020/us/pennsylvania-coronavirus-cases.html
But still most states worse on a per-capita daily new case basis (7 day moving average)
PA is 38th worst, meaning only 12 states are better
https://www.nytimes.com/interactive/2020/us/coronavirus-us-cases.html
BumRushDaShow
(167,253 posts)I am thinking it was more a spike that came after a holiday. We had 2 such events - after Memorial Day and after July 4th. Fortunately we didn't have one after Labor Day, which was of extreme concern. But apparently what we are seeing now seems to have been triggered by college openings, lower school openings (which were actually limited in terms of actual full "in person" openings so far - most are all-virtual or hybrid), sports activities within those lower schools (which has been a problem). And outside of the of what I do think is a spike after Rosh Hashanah and Yom Kippur (at least here in Philly), now it seems we're back to "community spread", with the virus generally circulating vs "event-related".
progree
(12,809 posts)I see on the graph so that's what I call it, and "wavelet" just doesn't quite do it justice, IMHO. But that's just me. I might have gone to the wrong engineering school.
Sometimes I think of putting a little disclaimer, but after all the posting I've done of links and statistics day after day, week after week, month after month of Covid statistics -- which is very time consuming as I often include 4 or 5 sources, so as to give a more complete picture -- way more work than just scraping a few paragraphs off of some article -- I just sometimes reach the point of running out of fucks to give.
BumRushDaShow
(167,253 posts)I would probably define a "wave" as being directly related to more generalized and diffuse "community spread" and those graphed "wavelets" might be related to an aggregation of targeted "outbreaks" (like super-spreader events).
And I know about the time-consuming part because I did that for 6 months, with some with torches and pitchforks ready to run me out of LBN  - https://www.democraticunderground.com/10142446993
I was hoping we were turning the corner and starting to get stuff under control and were moving on, but alas... 
progree
(12,809 posts)
To surviving family members of the deceased, the exact word doesn't matter.
#######################################
Wow, that does look time consuming!
https://www.democraticunderground.com/10142446993
BumRushDaShow
(167,253 posts)I call them "blumps" (something between a "bump" and a "lump" ). 
And I ended that thread just short of the 6 month point (was originally going to end it when all PA counties went to "green" in July, but then suddenly we got a post-July 4th increase, so I wanted to see if that could be reigned in and it finally was... but then later it was back on the rise again so I realized it would be almost endless ups and down and I decided to end the thread).
But I am still "tracking" in a Windows Sticky Note -
10/8/20 - PHL- +225 to 38,208/0 fatal/1817
progree
(12,809 posts)Hopefully this will make a difference. I thought he couldn't do this because of the Wisconsin Supreme Court
Note that Wisconsin is the 3rd hottest hotspot in the U.S in daily new cases PER CAPITA, 7 day moving average. (North Dakota and South Dakota are #1 and #2 in that metric)
Gov. Tony Evers issued an emergency order Tuesday limiting public indoor gatherings to 25% occupancy after Wisconsin became one of the nation’s COVID hotspots.
The order applies to any gathering open to the public including stores, restaurants, bars, other businesses, and spaces with ticketed events. It also applies to indoor, non-religious funerals, weddings and receptions that are open to the public.
There are some spaces that are exempt from the order like colleges and universities, child care settings, health care and public health operations, religious events, political events and more.
The changes will take effect at 8 a.m. on Thursday, Oct. 8, and will remain in place until Nov. 6.
On Tuesday, the Wisconsin Department of Health Services reported an increase of 2,020 confirmed cases of COVID-19 and 18 new deaths. The seven-day average of new daily COVID-19 cases is 2,346 – up from 836 one month ago.
More: https://minnesota.cbslocal.com/2020/10/06/wis-gov-evers-issues-order-limiting-public-indoor-gatherings-to-25-occupancy-after-covid-surge/
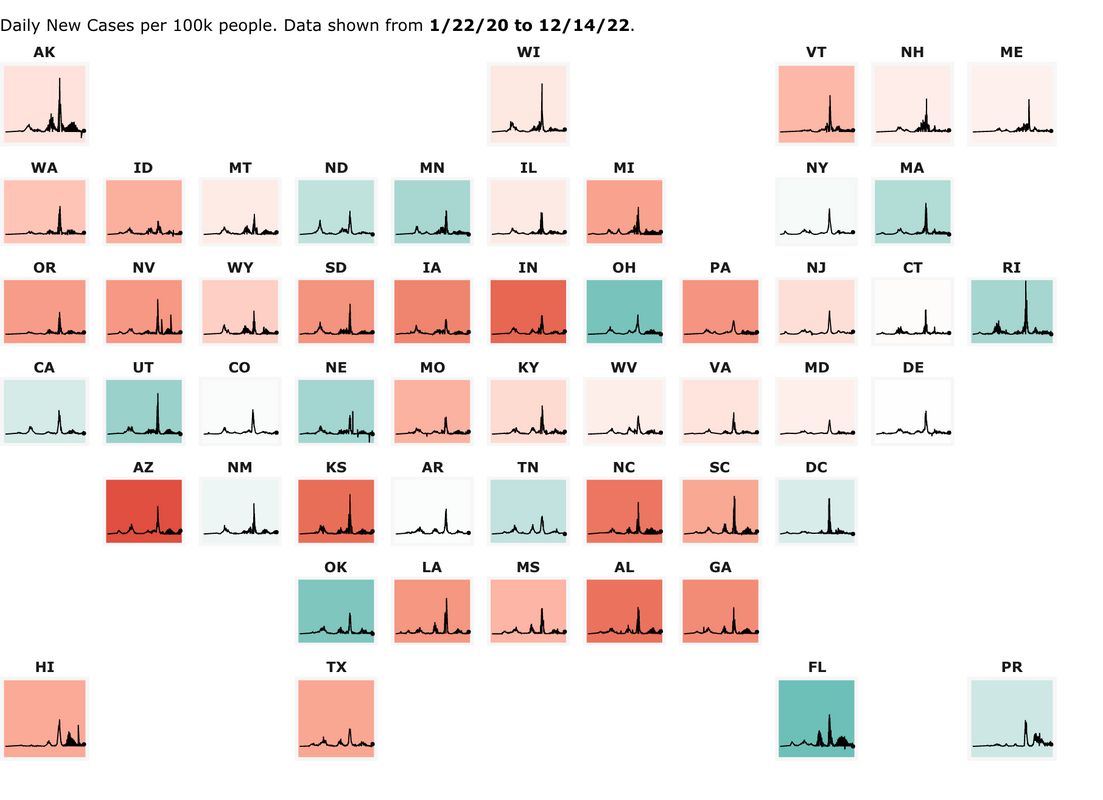
50 states' minicharts "map" page, alternative to the NY Times from John Hopkins University
The below "map" of the 50 states' minicharts (which are scaled by daily new cases PER CAPITA), is from the John Hopkins U. https://coronavirus.jhu.edu/data/new-cases-50-states -- at that page you can click on individual states on the "map". Showing 3-day moving average of new cases. I prefer the nytimes' charts which are 7 day moving averages)
beachbumbob
(9,263 posts)the situation

Jimbo S
(3,037 posts)They have done nothing. The Governor has had to do all the heavy lifting.
To blame the WI Supreme Court is misplaced blame. They only interpret laws, not set health policy.