U.S. economy adds 559,000 jobs in May, as the recovery shows signs of strength
Source: Washington Post
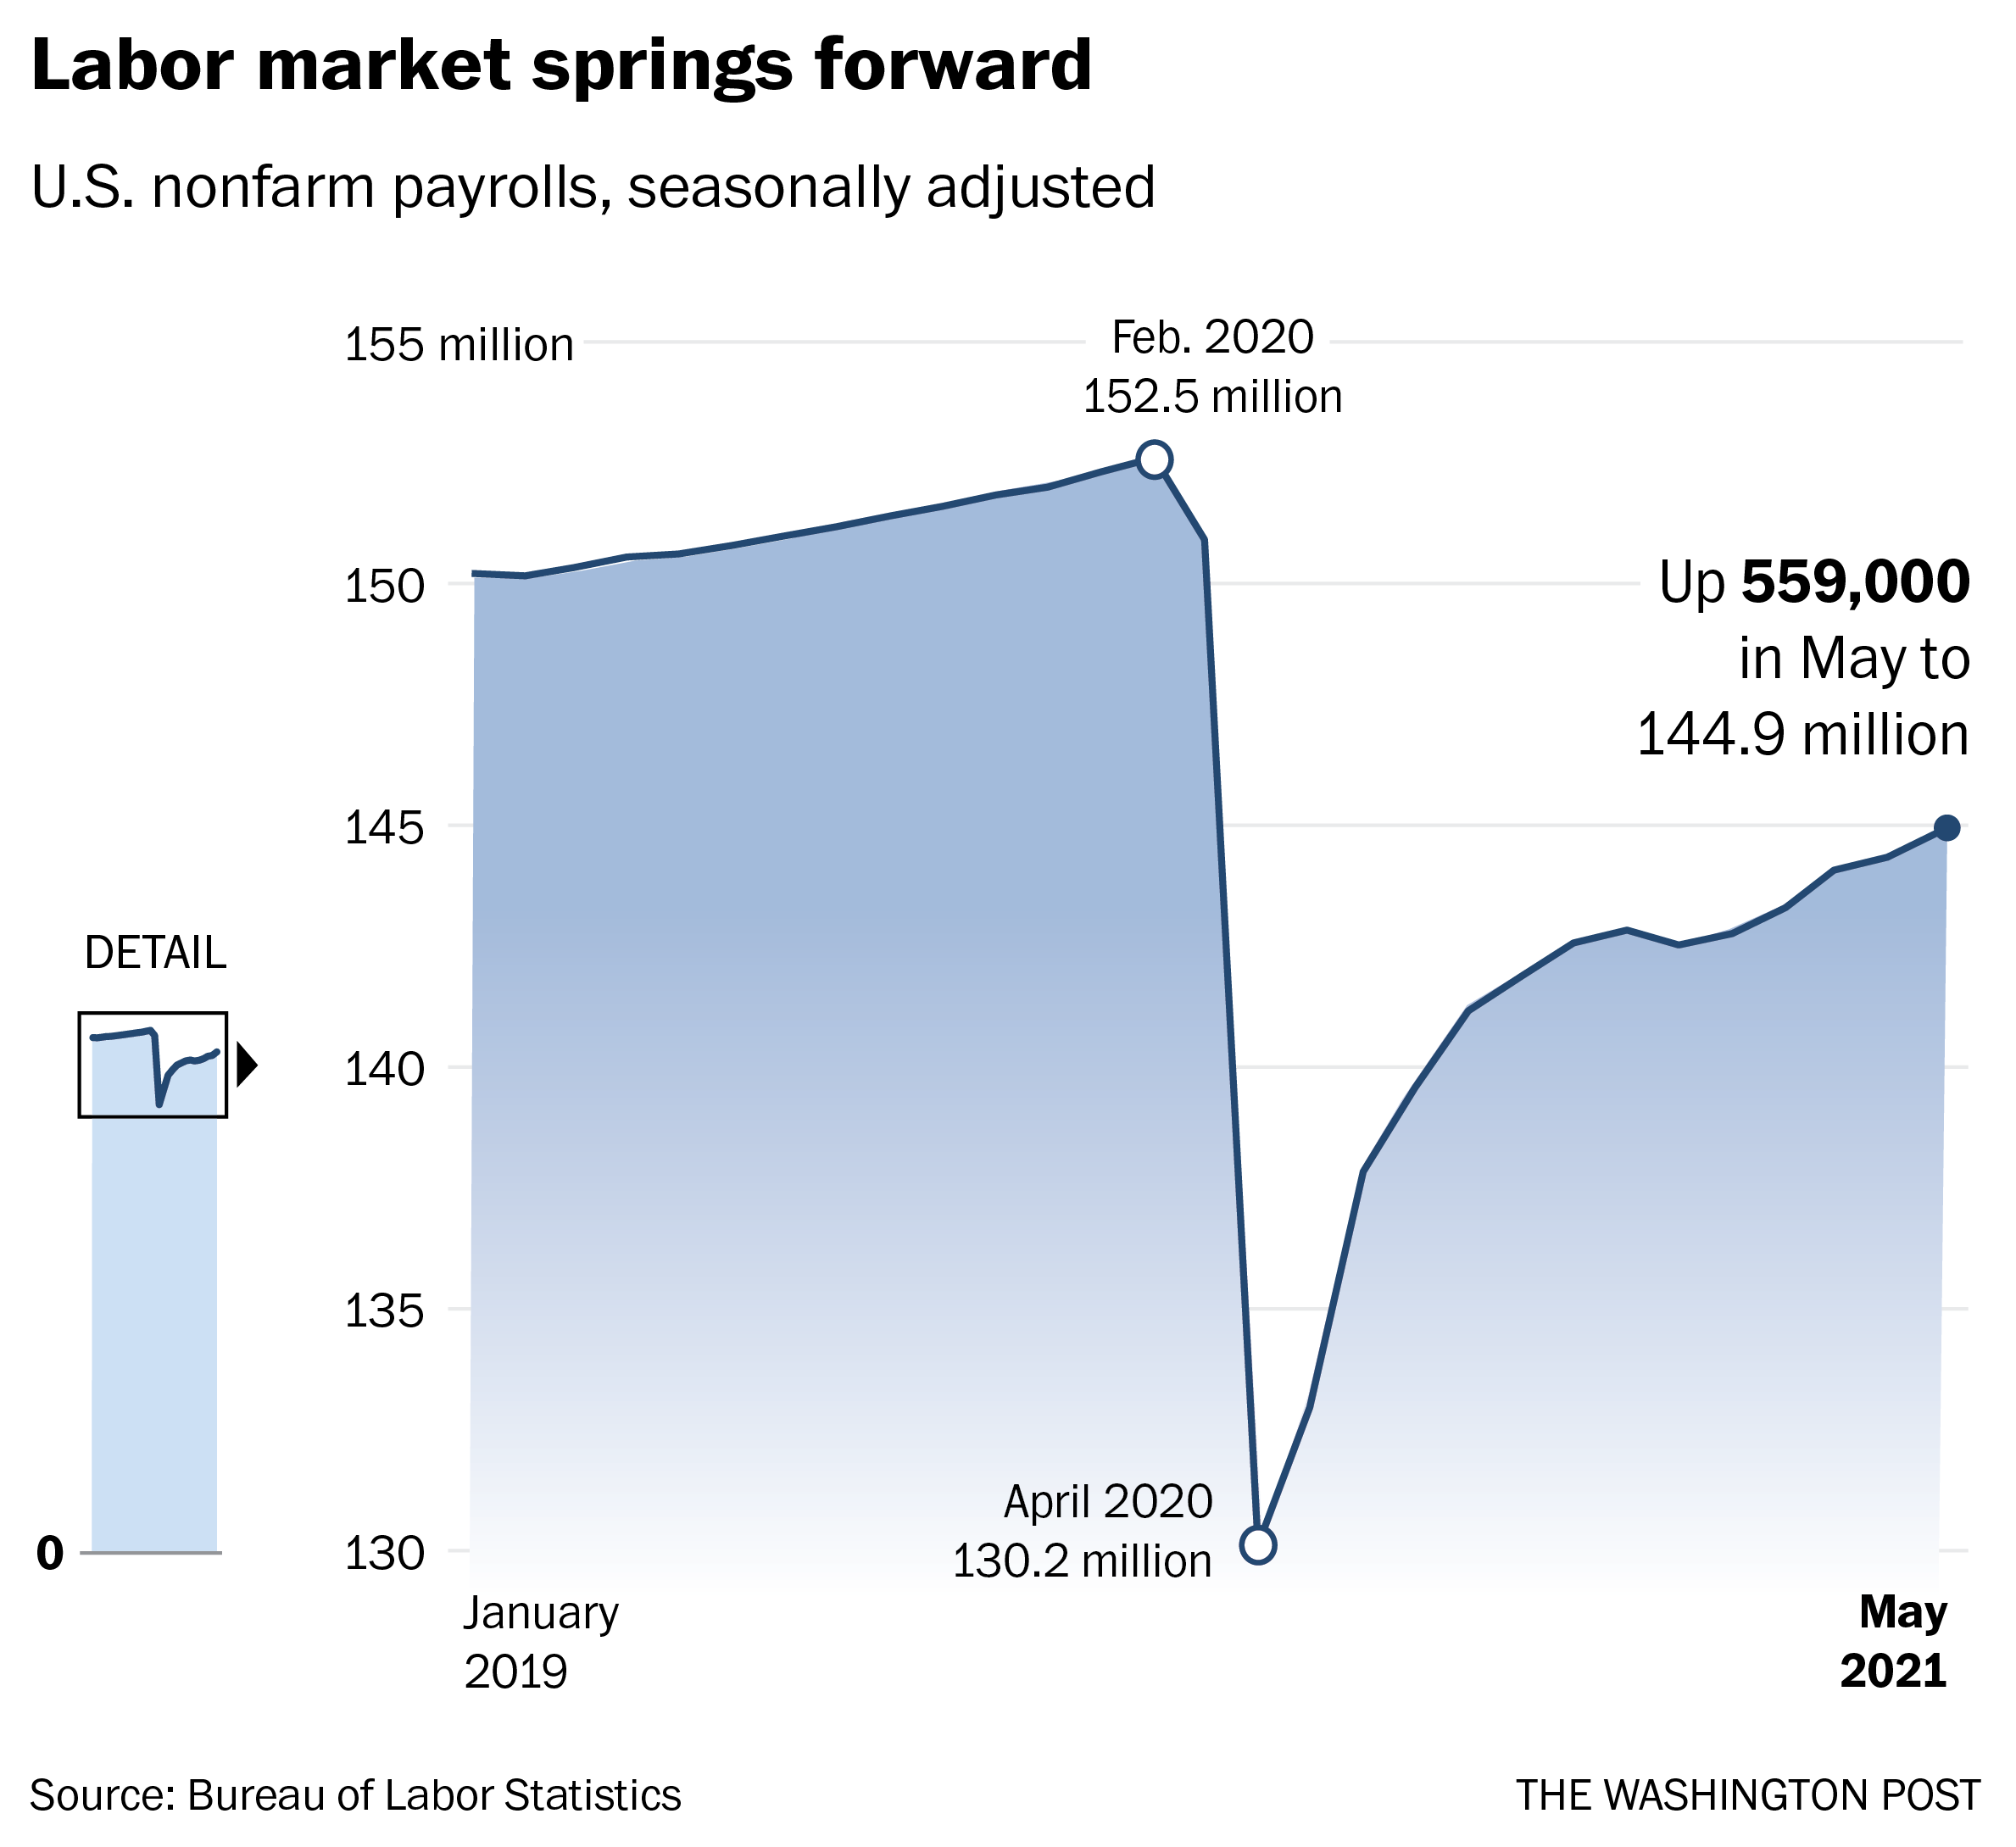
The U.S. economy added 559,000 jobs in May, the latest sign of a strengthening recovery as vaccinations rise and covid restrictions ease nationwide. The unemployment rate dropped slightly from 6.1 percent to 5.8 percent, according to the monthly report, from the Bureau of Labor Statistics. The gains were driven strongly by jobs added at restaurants, bars and other food service establishments, which added 186,000 workers in the month.
The categories of amusements, gambling and recreation, as well as hotels and accommodations also saw strong gains in May, adding 58,000 and 35,000 jobs respectively. Those sectors have been the subject of intense focus of whether a shortage of workers or other pandemic related issues have been holding back growth. Wages continued to rise, a reflection of what many employers say is a surprisingly tight jobs market, increasing an average of 15 cents per hour to $30.33 after an increase of 21 cents in April.
Economists and analysts have been forecasting robust months of growth in the labor market for the spring, as vaccine distribution spreads, weather warms, and coronavirus caseloads continue to fall. The strong May report comes on the heels of a disappointing month in April, when the economy added what federal statisticians initially tallied as 266,000 jobs, and later revised upward slightly to 278,000.
The country still has more than seven and a half million less people employed than it did in February 2020, and needs to regain those jobs at an accelerated rate to make a full recovery by sometime next year.
Read more: https://www.washingtonpost.com/business/2021/06/04/jobs-report-may-unemployment-shortage/
Short article (so far) - EDIT now updated.
Original article -
The report comes on the heels of a disappointing month of gains in April, when the economy added just 266,000 jobs.
The country still has more than seven million less people employed than it did in February 2020, and needs to regain those jobs at an accelerated rate to make a full recovery by sometime next year.
Economists and analysts have been forecasting robust months of growth in the labor market for the spring, as vaccine distribution spreads, weather warms, and coronavirus caseloads continue to fall.
TGIF and DU's dedicated analysts should be along shortly with all the data dives that one could hope for!


 = new reply since forum marked as read
Highlight:
NoneDon't highlight anything
5 newestHighlight 5 most recent replies
= new reply since forum marked as read
Highlight:
NoneDon't highlight anything
5 newestHighlight 5 most recent replies

mahatmakanejeeves
(68,801 posts)Payroll employment rises by 559,000 in May; unemployment rate declines to 5.8%
https://www.bls.gov/news.release/empsit.nr0.htm
Employment Situation Summary
Transmission of material in this news release is embargoed until USDL-21-0980
8:30 a.m. (ET) Friday, June 4, 2021
Technical information:
Household data: cpsinfo@bls.gov * www.bls.gov/cps
Establishment data: cesinfo@bls.gov * www.bls.gov/ces
Media contact: (202) 691-5902 * PressOffice@bls.gov
THE EMPLOYMENT SITUATION -- MAY 2021
Total nonfarm payroll employment rose by 559,000 in May, and the unemployment rate
declined by 0.3 percentage point to 5.8 percent, the U.S. Bureau of Labor Statistics
reported today. Notable job gains occurred in leisure and hospitality, in public and
private education, and in health care and social assistance.
This news release presents statistics from two monthly surveys. The household survey
measures labor force status, including unemployment, by demographic characteristics. The
establishment survey measures nonfarm employment, hours, and earnings by industry. For
more information about the concepts and statistical methodology used in these two surveys,
see the Technical Note.
Household Survey Data
In May, the unemployment rate declined by 0.3 percentage point to 5.8 percent, and the
number of unemployed persons fell by 496,000 to 9.3 million. These measures are down
considerably from their recent highs in April 2020 but remain well above their levels
prior to the coronavirus (COVID-19) pandemic (3.5 percent and 5.7 million, respectively,
in February 2020). (See table A-1. See the box note at the end of this news release for
more information about how the household survey and its measures were affected by the
coronavirus pandemic.)
Among the major worker groups, the unemployment rates declined in May for teenagers (9.6
percent), Whites (5.1 percent), and Hispanics (7.3 percent). The jobless rates for adult
men (5.9 percent), adult women (5.4 percent), Blacks (9.1 percent), and Asians (5.5
percent) showed little change in May. (See tables A-1, A-2, and A-3.)
Among the unemployed, the number of persons on temporary layoff declined by 291,000 to 1.8
million in May. This measure is down considerably from the recent high of 18.0 million in
April 2020 but is 1.1 million higher than in February 2020. The number of permanent job
losers decreased by 295,000 to 3.2 million in May but is 1.9 million higher than in
February 2020. (See table A-11.)
In May, the number of persons jobless less than 5 weeks declined by 391,000 to 2.0
million. The number of long-term unemployed (those jobless for 27 weeks or more) declined
by 431,000 to 3.8 million in May but is 2.6 million higher than in February 2020. These
long-term unemployed accounted for 40.9 percent of the total unemployed in May.
(See table A-12.)
The labor force participation rate was little changed at 61.6 percent in May and has
remained within a narrow range of 61.4 percent to 61.7 percent since June 2020. The
participation rate is 1.7 percentage points lower than in February 2020. The employment-
population ratio, at 58.0 percent, was also little changed in May but is up by 0.6
percentage point since December 2020. However, this measure is 3.1 percentage points below
its February 2020 level. (See table A-1.)
The number of persons employed part time for economic reasons was essentially unchanged at
5.3 million in May but is 873,000 higher than in February 2020. These individuals, who
would have preferred full-time employment, were working part time because their hours had
been reduced or they were unable to find full-time jobs. (See table A-8.)
In May, the number of persons not in the labor force who currently want a job was
essentially unchanged over the month at 6.6 million but is up by 1.6 million since
February 2020. These individuals were not counted as unemployed because they were not
actively looking for work during the last 4 weeks or were unavailable to take a job.
(See table A-1.)
Among those not in the labor force who currently want a job, the number of persons
marginally attached to the labor force, at 2.0 million, changed little in May but is up
by 518,000 since February 2020. These individuals wanted and were available for work and
had looked for a job sometime in the prior 12 months but had not looked for work in the 4
weeks preceding the survey. The number of discouraged workers, a subset of the marginally
attached who believed that no jobs were available for them, was 600,000 in May, little
changed from the previous month but 199,000 higher than in February 2020. (See Summary
table A.)
Household Survey Supplemental Data
In May, 16.6 percent of employed persons teleworked because of the coronavirus pandemic,
down from 18.3 percent in the prior month. These data refer to employed persons who
teleworked or worked at home for pay at some point in the last 4 weeks specifically
because of the pandemic.
In May, 7.9 million persons reported that they had been unable to work because their
employer closed or lost business due to the pandemic--that is, they did not work at all or
worked fewer hours at some point in the last 4 weeks due to the pandemic. This measure is
down from 9.4 million in the previous month. Among those who reported in May that they
were unable to work because of pandemic-related closures or lost business, 9.3 percent
received at least some pay from their employer for the hours not worked, unchanged from
the previous month.
Among those not in the labor force in May, 2.5 million persons were prevented from looking
for work due to the pandemic. This measure is down from 2.8 million the month before. (To
be counted as unemployed, by definition, individuals must be either actively looking for
work or on temporary layoff.)
These supplemental data come from questions added to the household survey beginning in May
2020 to help gauge the effects of the pandemic on the labor market. The data are not
seasonally adjusted. Tables with estimates from the supplemental questions for all months
are available online at www.bls.gov/cps/effects-of-the-coronavirus-covid-19-pandemic.htm.
Establishment Survey Data
Total nonfarm payroll employment increased by 559,000 in May, following increases of
278,000 in April and 785,000 in March. In May, nonfarm payroll employment is down by 7.6
million, or 5.0 percent, from its pre-pandemic level in February 2020. Notable job gains
occurred in leisure and hospitality, in public and private education, and in health care
and social assistance in May. (See table B-1. See the box note at the end of this news
release for more information about how the establishment survey and its measures were
affected by the coronavirus pandemic.)
In May, employment in leisure and hospitality increased by 292,000, as pandemic-related
restrictions continued to ease in some parts of the country. Nearly two-thirds of the
increase was in food services and drinking places (+186,000). Employment also rose in
amusements, gambling, and recreation (+58,000) and in accommodation (+35,000). Employment
in leisure and hospitality is down by 2.5 million, or 15.0 percent, from its level in
February 2020.
In May, employment increased in public and private education, reflecting the continued
resumption of in-person learning and other school-related activities in some parts of
the country. Employment rose by 53,000 in local government education, by 50,000 in state
government education, and by 41,000 in private education. However, employment is down
from February 2020 levels in local government education (-556,000), state government
education (-244,000), and private education (-293,000).
Health care and social assistance added 46,000 jobs in May. Employment in health care
continued to trend up (+23,000), reflecting a gain in ambulatory health care services
(+22,000). Social assistance added 23,000 jobs over the month, largely in child day care
services (+18,000). Compared with February 2020, employment is down by 508,000 in health
care and by 257,000 in social assistance.
Employment in information rose by 29,000 over the month but is down by 193,000 since
February 2020. In May, job gains occurred in motion picture and sound recording
industries (+14,000).
Manufacturing employment rose by 23,000 in May. A job gain in motor vehicles and parts
(+25,000) followed a loss in April (-38,000). Employment in manufacturing is down by
509,000 from its level in February 2020.
Transportation and warehousing added 23,000 jobs in May. Employment increased in
support activities for transportation (+10,000) and in air transportation (+9,000).
Since February 2020, employment in transportation and warehousing is down by 100,000.
Employment in wholesale trade increased by 20,000 in May, mostly in the durable goods
component (+14,000). Employment in wholesale trade is down by 211,000 since February
2020.
Construction employment edged down in May (-20,000), reflecting a job loss in
nonresidential specialty trade contractors (-17,000). Employment in construction is
225,000 lower than in February 2020.
Employment in professional and business services changed little in May (+35,000). Within
the industry, employment continued to trend up in accounting and bookkeeping services
(+14,000). Employment in temporary help services changed little over the month (+4,000),
following a large decline in April (-116,000). Overall, employment in professional and
business services is down by 708,000 since February 2020.
Employment in retail trade changed little in May (-6,000). Clothing and clothing
accessories stores added 11,000 jobs. Employment in food and beverage stores decreased
by 26,000, following a decline of 47,000 in April. Employment in retail trade is 411,000
below its February 2020 level.
In May, employment changed little in other major industries, including mining, financial
activities, and other services.
Average hourly earnings for all employees on private nonfarm payrolls increased by 15
cents to $30.33 in May, following an increase of 21 cents in April. Average hourly
earnings of private-sector production and nonsupervisory employees rose by 14 cents to
$25.60 in May, following an increase of 19 cents in April. The data for the last 2
months suggest that the rising demand for labor associated with the recovery from the
pandemic may have put upward pressure on wages. However, because average hourly
earnings vary widely across industries, the large employment fluctuations since
February 2020 complicate the analysis of recent trends in average hourly earnings.
(See tables B-3 and B-8.)
In May, the average workweek for all employees on private nonfarm payrolls was 34.9
hours for the third month in a row. In manufacturing, the average workweek rose by 0.1
hour to 40.5 hours, and overtime increased by 0.1 hour to 3.3 hours. The average
workweek for production and nonsupervisory employees on private nonfarm payrolls
declined by 0.1 hour to 34.3 hours. (See tables B-2 and B-7.)
The change in total nonfarm payroll employment for March was revised up by 15,000, from
+770,000 to +785,000, and the change for April was revised up by 12,000, from +266,000 to
+278,000. With these revisions, employment in March and April combined is 27,000 higher
than previously reported. (Monthly revisions result from additional reports received from
businesses and government agencies since the last published estimates and from the
recalculation of seasonal factors.)
_____________
The Employment Situation for June is scheduled to be released on Friday, July 2, 2021,
at 8:30 a.m. (ET).
* * * * *
[center]Facilities for Sensory Impaired[/center]
Information from these releases will be made available to sensory impaired individuals upon request. Voice phone: 202-691-5200, Federal Relay Services: 1-800-877-8339.

BumRushDaShow
(167,153 posts)The "breaking" alert on my iPad is pretty loud and it liked to blow me off the sofa! 
Good morning! 
mahatmakanejeeves
(68,801 posts)Good morning to you too. I think more jobs were expected for May. Also, any revision for April is of note. It was revised upward, but only by 12,000.
BumRushDaShow
(167,153 posts)But considering the lower pay tier industries (restaurants, hospitality) are apparently having issues getting their "low wage" employees back, I expect if any decide to go on and raise their pay/benefits just a bit more, then that sector might start picking up steam. I think some of those "expectations" are apparently being based on people "immediately" going back to their old jobs when the lock downs/limits were removed and that didn't happen.
There is also now an issue of childcare as that sector has a shortage of employees (just read an article about it yesterday) and that limits those in other sectors from returning to work if they have no place for their non-school aged children to be during a work day.
This sortof reminds me of the type logistics maneuvers that were needed after the 9/11 ground stop of every flying craft (except military) and then "restarting the system" when the ground stop was lifted. Planes had to be moved from their "temporary" landing sites so they could be returned to their "home" airports in order to make room for those planes whose "home" airports were occupied by other stranded planes.
I.e., everything is "interconnected".

MichMan
(16,874 posts)Thus making it hard for others to also return.
Of course, if the wages for childcare workers, (many whom receive low pay) were increased substantually like they should, it would likely cause the costs to increase and making it less affordable.
BumRushDaShow
(167,153 posts)they would offer it for their workers by taking some of their "on-paper profits" and eventually realize "real profits" with a childcare benefit, which could reduce costs associated with prime-age employee churn, and trying to recruit and train new employees. Seems many would prefer to "import" employees using various visa options instead.
MichMan
(16,874 posts)BumRushDaShow
(167,153 posts)there can be an "either/or", i.e., something related to caretaking of parents/grandparents or other family members (spouse, sibling, aunt/uncle, etc), which more and more is a huge issue.
As they are finding out, there are many elderly and disabled who are not at a facility (unable to afford one or unwilling to go in one) and are being taken care of "at home". And these are the people who many municipalities, including my own here in Philly, realized existed in larger numbers than they were aware of, when it came to getting the vaccines to the vulnerable.
Those folks were NOT going to "go downtown to the PA Convention Center and stand in line" to get vaccinated. Many are not ambulatory and are being cared for at home - either by relatives, neighbors, or by some individual home healthcare worker who was arranged for them. Being reimbursed for that would go a long way.

Bengus81
(9,967 posts) mahatmakanejeeves
(68,801 posts)Good morning, all.
Thu Jun 3, 2021: Links to earlier reports:
Fri May 7, 2021: Links to earlier reports:
Wed May 5, 2021: Links to earlier reports:
Fri Apr 2, 2021: Links to earlier reports:
Wed Mar 31, 2021: Links to earlier reports:
Fri Mar 5, 2021: Links to earlier reports:
Wed Mar 3, 2021: Links to earlier reports:
Fri Feb 5, 2021: Links to earlier reports:
Wed Feb 3, 2021: Links to earlier reports:
Fri Jan 8, 2021: Links to earlier reports:
Wed Jan 6, 2021: Links to earlier reports:
Fri Dec 4, 2020: Links to earlier reports:
Wed Dec 2, 2020: Links to earlier reports:
Fri Nov 6, 2020: Links to earlier reports:
Wed Nov 4, 2020: Links to earlier reports:
Fri Oct 2, 2020: Links to earlier reports:
Wed Sep 30, 2020: Links to earlier reports:
Fri Sep 4, 2020: Links to earlier reports:
Wed Sep 2, 2020: Links to earlier reports:
Fri Aug 7, 2020: Links to earlier reports:
Wed Aug 5, 2020: Links to earlier reports:
Thu Jul 2, 2020: Links to earlier reports:
Fri Jun 5, 2020: Links to earlier reports:
Fri May 8, 2020: Links to earlier reports:
Updated from this post of Friday, December 6, 2019: Good morning. Links to earlier reports:
-- -- -- -- -- --
[center]Past Performance is Not a Guarantee of Future Results.[/center]
Nonetheless, what is important is not this month's results, but the trend. Let’s look at some earlier numbers:
ADP® (Automatic Data Processing), for employment in May 2021:
Thu Jun 3, 2021: Private-sector employment increased by 978,000 from April to May, on a seasonally adjusted basis.
Bureau of Labor Statistics, for employment in April 2021:
Economy picked up 266,000 jobs in April, fewer than expected as economy tries to rebound
ADP® (Automatic Data Processing), for employment in April 2021:
Private-sector employment increased by 742,000 from March to April, on a seasonally adjusted basis.
Bureau of Labor Statistics, for employment in March 2021:
The U.S. economy added 916,000 jobs in March as recovery gains steam again
ADP® (Automatic Data Processing), for employment in March 2021:
Private employers added back 517,000 jobs in March, missing expectations: ADP
Bureau of Labor Statistics, for employment in February 2021:
The economy added 379,000 jobs in February
ADP® (Automatic Data Processing), for employment in February 2021:
ADP National Employment Report: Private Sector Employment Increased by 117,000 Jobs in February
Bureau of Labor Statistics, for employment in January 2021:
Unemployment rate falls to 6.3% in January; payroll employment changes little (+49,000)
ADP® (Automatic Data Processing), for employment in January 2021:
ADP National Employment Report: Private Sector Employment Increased by 174,000 Jobs in January
Bureau of Labor Statistics, for employment in December 2020:
The economy lost 140,000 jobs in December
ADP® (Automatic Data Processing), for employment in December 2020:
Private-sector employment decreased by 123,000 from November to December, seasonally adjusted
Bureau of Labor Statistics, for employment in November 2020:
Job Growth Slows Sharply As Pandemic Takes Toll On Economy
ADP® (Automatic Data Processing), for employment in November 2020:
Private-sector employment increased by 307,000 from October to November, on a seasonally adjusted
Bureau of Labor Statistics, for employment in October 2020:
U.S. added 638,000 jobs in October, unemployment rate slides to 6.9%
ADP® (Automatic Data Processing), for employment in October 2020:
Private-sector employment increased by 365,000 from September to October, on a seasonally adjusted
Bureau of Labor Statistics, for employment in September 2020:
September jobs report: US economy gains 661,000 payrolls, unemployment rate ticks down to 7.9%
ADP® (Automatic Data Processing), for employment in September 2020:
Private-sector employment increased by 749,000 from August to September on seasonally adjusted basis
Bureau of Labor Statistics, for employment in August 2020:
Economy adds 1.4 million jobs in August, and the unemployment rate fell below 10 percent
ADP® (Automatic Data Processing), for employment in August 2020:
Private-sector employment increased by 428,000 from July to August, on a seasonally adjusted basis.
Bureau of Labor Statistics, for employment in July 2020:
Nonfarm payroll employment rises by 1.8 million in July; unemployment rate falls to 10.2%
ADP® (Automatic Data Processing), for employment in July 2020:
Private-sector employment increased by 167,000 from June to July, on a seasonally adjusted basis.
Bureau of Labor Statistics, for employment in June 2020:
Nonfarm payroll employment rises by 4.8 million in June; unemployment rate falls to 11.1%
ADP® (Automatic Data Processing), for employment in June 2020:
ADP National Employment Report: Private Sector Employment Increased by 2,369,000 Jobs in June
Bureau of Labor Statistics, for employment in May 2020:
Unemployment rate drops to 13 percent, as the economy began to lose jobs at a slower pace
ADP® (Automatic Data Processing), for employment in May 2020:
Private-sector employment decreased by 2,760,000 from April to May, on a seasonally adjusted basis.
Bureau of Labor Statistics, for employment in April 2020:
Jobless rate soared to 14.7% in April as U.S. shed 20.5 million jobs amid coronavirus pandemic
ADP® (Automatic Data Processing), for employment in April 2020:
ADP National Employment Report: Private Sector Employment Decreased by 20,236,000 Jobs in April

progree
(12,805 posts)Every one of these data series comes with a table and graph.
# Nonfarm Employment (Establishment Survey, https://data.bls.gov/timeseries/CES0000000001
Monthly changes (in thousands): https://data.bls.gov/timeseries/CES0000000001?output_view=net_1mth
2019: 237 -50 168 219 63 175 193 195 221 195 234 161
2020: 315 289 -1683 -20679 2833 4846 1726 1583 716 680 264 -306
2021: 233 536 785 278 559
April and May are Preliminary. In thousands
NOT SEASONALLY ADJUSTED: https://data.bls.gov/timeseries/CEU0000000001
# Employed in thousands from the separate Household Survey, http://data.bls.gov/timeseries/LNS12000000
Monthly changes (in thousands): http://data.bls.gov/timeseries/LNS12000000?output_view=net_1mth
2019: -120 279 -95 -68 142 248 486 244 369 126 184 195
2020: -76 73 -3196 -22166 3854 4876 1677 3499 267 2126 140 21
2021: 201 208 609 328 444
Jan and Feb of each year are affected by changes in population controls. In thousands
NOT SEASONALLY ADJUSTED: https://data.bls.gov/timeseries/LNU02000000
# Nonfarm PRIVATE Employment (Establishment Survey, https://data.bls.gov/timeseries/CES0500000001
Monthly changes: https://data.bls.gov/timeseries/CES0500000001?output_view=net_1mth
^-Good for comparison to the ADP report that typically comes out a few days earlier
NOT SEASONALLY ADJUSTED: https://data.bls.gov/timeseries/CEU0500000001
# INFLATION ADJUSTED Weekly Earnings of Production and Non-Supervisory Workers http://data.bls.gov/timeseries/CES0500000031
# Labor Force http://data.bls.gov/timeseries/LNS11000000?output_view=net_1mth
The labor force is the sum of employed and unemployed. To count as unemployed, one must have actively sought work in the past 4 weeks (just looking at want ads and job postings doesn't count)
Monthly change in thousands:
2020: -124 -7 -1727 -6243 1722 1597 288 733 -740 640 -182 31
2021: -406 50 347 430 -53
Total count in thousands:
2020: 164455 164448 162721 156478 158200 159797 160085 160818 160078 160718 160536 160567
2021: 160161 160211 160558 160988 160935
May 2021 is down 3.513 million from February 2020 -- lots of people are discouraged from looking because of poor prospects and/or concerns over coronavirus. Plus a lot of children are still remote learning at home, which is tough without parental supervision. Day care workers are in short supply. And note that May is up only 368,000 from December and down 53,000 from April (a big reason the unemployment rate dropped 3 percentage points)
January data each year is affected by changes in population controls.
# Unemployed http://data.bls.gov/timeseries/LNS13000000
2020: 5796 5717 7185 23109 20975 17697 16308 13542 12535 11049 10728 10736
2021: 10130 9972 9710 9812 9316 (in thousands)
# ETPR (Employment-To-Population Ratio) aka Employment Rate http://data.bls.gov/timeseries/LNS12300000
# LFPR (Labor Force Participation rate) http://data.bls.gov/timeseries/LNS11300000
# Unemployment rate http://data.bls.gov/timeseries/LNS14000000
# U-6 unemployment rate http://data.bls.gov/timeseries/LNS13327709
# NILF -- Not in Labor Forcehttp://data.bls.gov/timeseries/LNS15000000
# NILF-WJ -- Not in Labor Force, Wants Job http://data.bls.gov/timeseries/LNS15026639
# Part-Time Workers who want Full-Time Jobs (Table A-8's Part-Time For Economic Reasons) http://data.bls.gov/timeseries/LNS12032194
# Part-Time Workers (Table A-9) http://data.bls.gov/timeseries/LNS12600000
# Full-Time Workers (Table A-9) http://data.bls.gov/timeseries/LNS12500000
# Multiple Jobholders as a Percent of Employed (Table A-9) https://data.bls.gov/timeseries/LNS12026620
# Civilian non-institutional population
Seasonally adjusted (they seem to have gotten rid of this) https://data.bls.gov/timeseries/LNS10000000
NOT seasonally adjusted: https://data.bls.gov/timeseries/LNU00000000
# Black unemployment rate (%), https://data.bls.gov/timeseries/LNS14000006
2020: 6.1 6.0 6.8 16.7 16.7 15.3 14.4 12.8 12.0 10.8 10.3 9.9
2021: 9.2 9.9 9.6 9.7 9.1
# Hispanic or Latino unemployment rate (%), https://data.bls.gov/timeseries/LNS14000009
2020: 4.3 4.4 6.0 18.9 17.6 14.5 12.7 10.5 10.3 8.8 8.4 9.3
2021: 8.6 8.5 7.9 7.9 7.3
# White unemployment rate (%), https://data.bls.gov/timeseries/LNS14000003
2020: 3.0 3.0 3.9 14.1 12.3 10.1 9.2 7.4 7.0 6.0 5.9 6.0
2021: 5.7 5.6 5.4 5.3 5.1
LFPR - Labor Force Participation Rate for some age groups
The LFPR is the Employed + jobless people who have looked for work in the last 4 weeks (and say they want a job and are able to take one if offered). All divided by the civilian non-institutional population age 16+.
SA means Seasonally adjusted. NSA means Not Seasonally Adjusted
16+: SA: http://data.bls.gov/timeseries/LNS11300000 NSA: http://data.bls.gov/timeseries/LNU01300000
25-34: SA: http://data.bls.gov/timeseries/LNS11300089 NSA: http://data.bls.gov/timeseries/LNU01300089
25-54: SA: http://data.bls.gov/timeseries/LNS11300060 NSA: http://data.bls.gov/timeseries/LNU01300060
55+: SA: http://data.bls.gov/timeseries/LNS11324230 NSA: http://data.bls.gov/timeseries/LNU01324230
65+: SA: ---------------- NSA: http://data.bls.gov/timeseries/LNU01300097
LFPR - Labor Force Particpation Rate (prime age 25-54) by gender
All: http://data.bls.gov/timeseries/LNS11300060
Men: http://data.bls.gov/timeseries/LNS11300061
Women: http://data.bls.gov/timeseries/LNS11300062
ETPR - Employment to Population Ratio for some age groups
SA means Seasonally adjusted. NSA means Not Seasonally Adjusted
16+: SA: http://data.bls.gov/timeseries/LNS12300000 NSA: http://data.bls.gov/timeseries/LNU02300000
25-34: http://data.bls.gov/timeseries/LNS12300089 NSA: http://data.bls.gov/timeseries/LNU02300089
25-54: SA: http://data.bls.gov/timeseries/LNS12300060 NSA: http://data.bls.gov/timeseries/LNU02300060
55+: SA: http://data.bls.gov/timeseries/LNS12324230 NSA: http://data.bls.gov/timeseries/LNU02324230
65+: SA: ---------------- NSA: http://data.bls.gov/timeseries/LNU02300097
Inflation rate (CPI)
. . . Monthly report: https://www.bls.gov/news.release/cpi.nr0.htm
. . . Calculator at: https://www.bls.gov/data/inflation_calculator.htm
Grocery prices (food at home) inflation compared to overall inflation rate
. . . . . https://www.in2013dollars.com/Food-at-home/price-inflation
. . . From 1947 to 2021 and from 2000 to 2021, food at home inflation very slightly lagged the overall inflation rate
. . . . . https://www.democraticunderground.com/10142735789
Data series finder: https://www.bls.gov/data/#employment
BumRushDaShow
(167,153 posts) progree
(12,805 posts)Last edited Sat Jun 5, 2021, 07:59 AM - Edit history (1)
Test edit - will I get "403 Forbidden"?
BumRushDaShow
(167,153 posts)
(my "backoffice" stuff)