Omicron now accounts for 73% of new coronavirus cases in the US, according to the CDC
Last edited Mon Dec 20, 2021, 08:42 PM - Edit history (1)
Source: CNN
The Omicron Covid-19 variant now accounts for over 73% of new coronavirus cases in the US, according to estimates posted Monday by the US Centers for Disease Control and Prevention.
For the week ending December 18, Omicron accounted for 73.2% of cases, with Delta making up an additional 26.6%.
The week prior, ending December 11, Omicron was estimated at 12.6% of circulating virus, versus Delta's 87%. Previously, the CDC estimated Omicron accounted for about 3% that week.
Omicron is even more prevalent in certain parts of the country — making up over 95% of circulating virus in parts of the Northwest and Southeast, the data shows.
Read more: https://www.cnn.com/2021/12/20/health/us-coronavirus-monday/index.html
 = new reply since forum marked as read
Highlight:
NoneDon't highlight anything
5 newestHighlight 5 most recent replies
= new reply since forum marked as read
Highlight:
NoneDon't highlight anything
5 newestHighlight 5 most recent replies

Omicron is moving fast.

Terry_M
(822 posts)I just got my booster last week. I was thinking I had a few weeks of feeling invulnerable ahead of me (since vaccines are 95% effective against the delta/original strains) but now I'm apparently already down to 75% protected since it's Omicron everywhere now and the third shot doesnt get you any higher than that....
Seems like basically everyone will be exposed to omicron in the coming weeks unless they hide.

BumRushDaShow
(172,250 posts)All I can say is wow. 
(Some snapshots that I have gathered over the past couple months taken from here - https://covid.cdc.gov/covid-data-tracker/#variant-proportions)
LATEST DATA OF DELTA WITH OMICRON OVERTAKE (published 12/20/21)

EARLIER DATA WITH OMICRON EMERGENCE(published 12/16/21)

EARLIER DATA WITH DELTA PREDOMINANCE (published 11/16/21)

EARLIER REFERENCE DATA OF ALPHA (AND OTHER VARIANTS) WITH DELTA OVERTAKE (published 8/10/21)

Quakerfriend
(5,882 posts)Head of NIH says we may reach 1 million cases/day in the US alone 
BumRushDaShow
(172,250 posts)will be enough to allow someone who gets infected, to have the best chance of self-care at home (including viral treatments) like someone who has a bad case of the flu might do vs having to enter the hospital for more serious (but still not life-threatening) conditions, that might include some non-respiratory system organ damage (which is something that COVID-19 can cause).

LudwigPastorius
(15,006 posts)Delta took 2 months to become the 75% dominant strain.
...while Omicron has achieved that in 2 weeks.
Not good.
BumRushDaShow
(172,250 posts)
I guess at this point I would hope that someone has some older samples still around to go back and sequence to see if was actually already here earlier than thought as part of a reason why it has taken over so quickly (aside from it obviously being more transmissible).
I had earlier posted a tweet in a couple previous threads from the Director of the Centre for Epidemic Response & innovation, South Africa (CERI) showing how Omicron so quickly slammed right into the fray - https://www.democraticunderground.com/10142840090
Link to tweet
@Tuliodna
·
Nov 25, 2021
Replying to @Tuliodna
This new variant is really worrisome at the mutational level. South Africa and Africa will need support (financially, public health, scientific) to control it so it does not spread in the world. Our poor and deprived population can not be in lockdown without financial support.
Image
Tulio de Oliveira
@Tuliodna
This new variant, B.1.1.529 seems to spread very quick! In less than 2 weeks now dominates all infections following a devastating Delta wave in South Africa (Blue new variant, now at 75% of last genomes and soon to reach 100%)
Image
11:44 AM · Nov 25, 2021


I just found he tweeted a summary of their recently submitted research on Omicron -
Link to tweet
@Tuliodna
·
Dec 18, 2021
Replying to @Tuliodna
Would like to thank and acknowledge the hard work on #Omicron of @GeneJockey15 @EduanWilkinson @WP87738523 @Carolyn86563982 @EvolveDotZoo @BhimanJinal @DarrenM98230782 @arambaut and many other authors that are not on Twitter!
Tulio de Oliveira
@Tuliodna
Manuscript 'Rapid epidemic expansion of the SARS-CoV-2 Omicron variant in southern Africa' submitted to peer review and medRXiv, currently available at: https://krisp.org.za/manuscripts/ZHTOWa-MEDRXIV-2021-268028v1-deOliveira.pdf
2:44 PM · Dec 18, 2021
Publication (PDF) - https://t.co/CjGBovw7L5?amp=1
Part of the tweet thread includes this -
Link to tweet
@Tuliodna
·
Dec 18, 2021
Replying to @Tuliodna
The Omicron variant is exceptional for carrying over 30 mutations in the spike glycoprotein, predicted to influence antibody neutralization and spike function.
Image
Tulio de Oliveira
@Tuliodna
Omicron spread fast in South Africa and in four weeks went from (less than) 1% to close to 100% of infections. Figure 1C - Weekly progression of average daily cases per 100,000, test positivity rates, proportion of SGTF, and genomic prevalence of Omicron in nine provinces of South Africa

herding cats
(20,056 posts)BumRushDaShow
(172,250 posts)
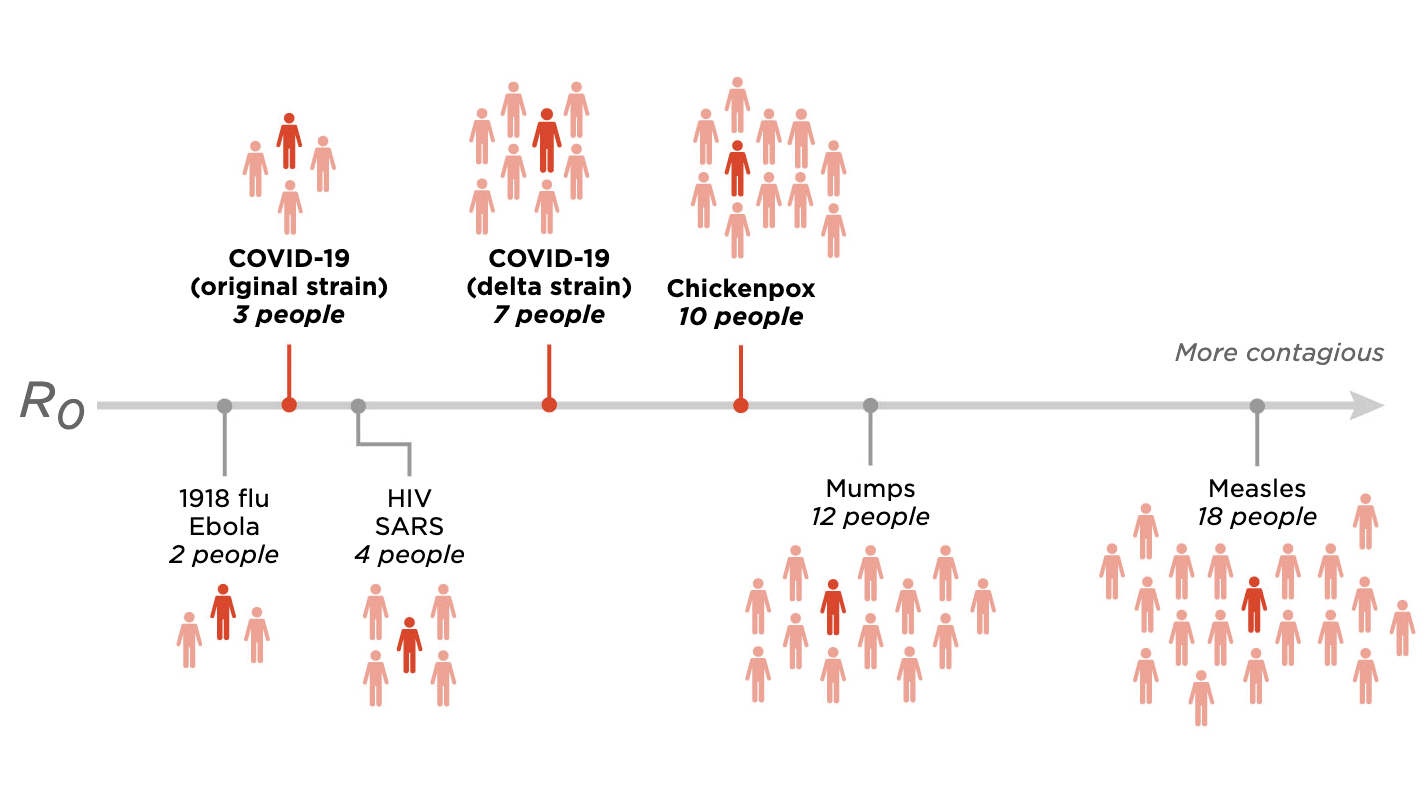
I know there have been some rumblings around the 'net that this variant might now be moving closer to being as transmissible as Measles given that Delta was getting close to Chicken Pox transmission rates already - https://www.npr.org/sections/goatsandsoda/2021/08/11/1026190062/covid-delta-variant-transmission-cdc-chickenpox
herding cats
(20,056 posts)I suspected a lag in reporting and data dumps in SA coupled with the relaxed atmosphere in the Netherlands being the driving force for the possible anomalies initially. Now I'm in wait and see mode 100%.
Even if this is milder and primarily sticks to the upper respiratory system in most, it's going to be off the charts as to infection rate it's seeming. And nothing is carved into stone on this variant yet. Once it butts up against a population of unvaccinated and and those without a recent infection things clouds get complicated. We shall see.
flying t
(12 posts)I saw this at Newsweek and wondered if anyone else here saw it? I also was told but cannot confirm there has been just 1 death reported from Omicron. My poor wife is scared to death and I am trying to calm her down but do not want to lie to her.
I don't have the time for a lot of research and from being a long time visitor here (I only recently signed up) I know many of you seem to be able to cut thru the bs and I hope you will do so now.
Here is the link
https://www.newsdesk.io/omicron-variant-so-weak-that-south-africa-will-stop-tracing-and-quarantining-of-contacts/
Thank you
BumRushDaShow
(172,250 posts)flying t
(12 posts)It typed "Newsweek" in error.
Upon checking though I have found many sources to this story. If the mods want to delete this they can but it seems this is good news, isn't it?

IronLionZion
(51,551 posts)if Omicron is less severe, which we don't know just yet. It would be best if the dominant strain is less likely to kill people. Then it's high transmissibility will roll through the unvaccinated quickly and they'll get the "natural herd immunity" they've been talking about.

uppityperson
(116,026 posts)BumRushDaShow
(172,250 posts)The exponential growth of Omicron is pretty breathtaking.
In South Africa - https://www.npr.org/sections/goatsandsoda/2021/12/10/1062498420/what-omicrons-fast-spread-could-mean-for-the-u-s-and-the-world

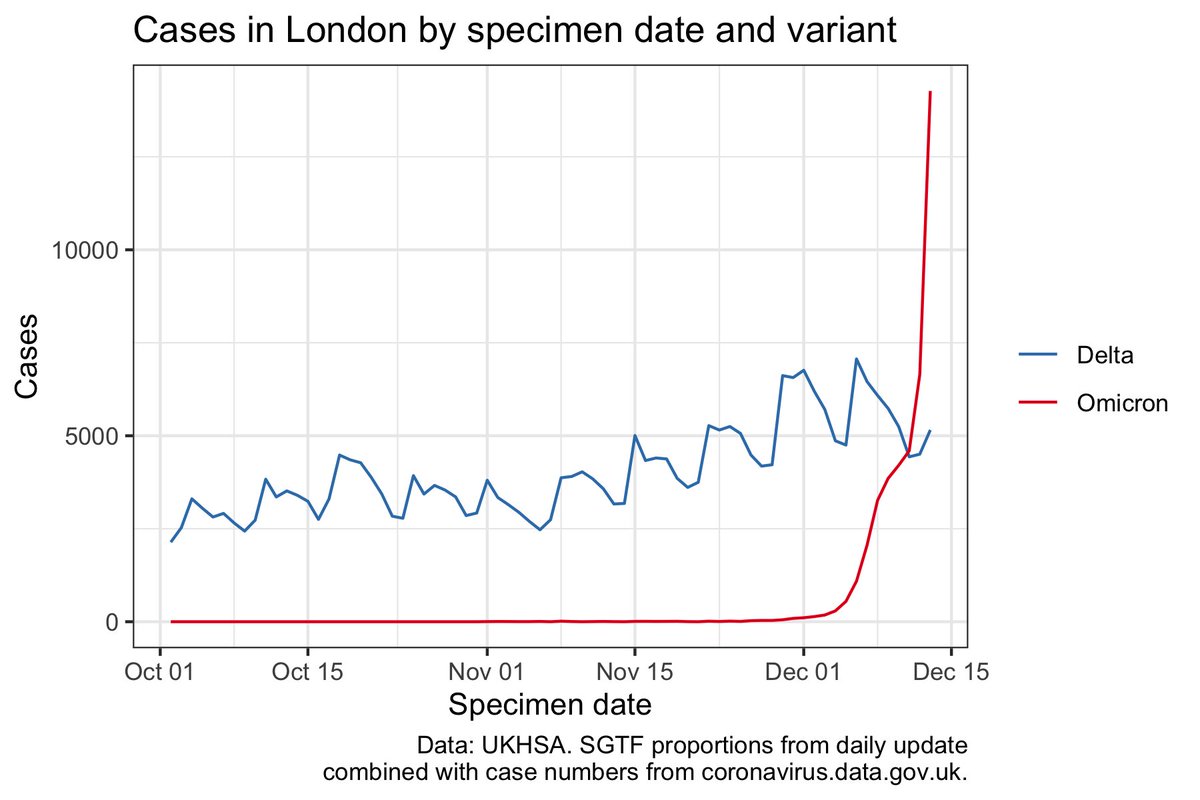
And this is what it did in the UK (London) -
Link to tweet
@EricTopol
Omicron has already become dominant in England (>50% cases) and the updated O-sign ( | ) in London quite prominent on this graph by @theosanderson
Image
Oliver Johnson
@BristOliver
Looks like Omicron became dominant in England on Tuesday (54.2% on 14th December specimens). And it's extremely striking how England growth (red) is at exactly the same speed as London (blue). Two regression lines are basically parallel, just England is ~4 days behind.
Image
2:41 PM · Dec 17, 2021
yaesu
(9,448 posts)
Ms. Toad
(38,824 posts)It's been around 21 days. They don't even start to evaluate lethality for 28 days. Since the caseload wasn't significant until this week, that's 3 more weeks before we'll begin to have a handle on its severity.
Yo_Mama_Been_Loggin
(137,428 posts)Doesn't say that in your headline

milestogo
(23,201 posts)
Igel
(37,613 posts)Averages average.
This was fast. Makes me wonder if the testing regimen accurately captured reality (to the extent it's not socially constructed), and how things'll go from'ere.
captain queeg
(11,780 posts)Plenty people are still unvaxxed, many have not completed initial doses and many have not received boosters. Even folks that have been vaccinated or had an earlier bout of Covid will be susceptible. Maybe those folks won’t get too sick but they could spread it. I’ve read that millennials are “done with Covid” meaning they don’t want to take precautions. And since preliminary info seems to be omicron is less severe many will take that to mean they can ignore it.

BigmanPigman
(55,525 posts)while I was doing my final shopping trip for at least 10 days. I got 20 new N95s in the mail this weekend, 12 will be stocking stuffers. I recycled the 5 my sister gave almost 2 years and they still are tight and work but since the real N95s are in stock again I figured I should take advantage of it. People in CA don't seem too concerned at this time. Fools.
milestogo
(23,201 posts)I usually don't wear masks outside, but I realize today that I am sometimes less than 6 ft away from people I talk to outside. So I am not going to take any chances. I don't want to get sick.
progree
(13,077 posts)I don't know how much of this is unconscious, and how much of this is being an asshole on the other person's part given the circumstance and how widely the 6 foot number was repeated over and over in the media, in store signs and markings etc. (though much less than a year ago).
I'm a 6'1" tall guy, I measured my arm if I put it straight out in front of me: 2 1/2 feet from my shoulder (or face) to my fingertip. That means 6 feet is a foot more than 2 of those arms lengths.
I googled natural distance people stand apart while talking
https://www.google.com/search?q=natural+distance+people+stand+apart+while+talking&oq=natural+distance+people+stand+apart+while+talking&aqs=chrome..69i57.12176j1j7&sourceid=chrome&ie=UTF-8
and the top one was 1.5 to 3 feet for Americans.
So for me, the further distance, 3 feet, is just 6" beyond my extended arm.
BumRushDaShow
(172,250 posts)
and you had restaurants with "bumper tables" to enforce the social distancing -


progree
(13,077 posts)progree
(13,077 posts)It looks like new deaths have peaked almost simultaneously with new cases for every peak in 2021 except for the current peak (new cases still going up) but new deaths have been going down since August 29 - Dec 9 and then plateauing -- the current Oct 15 - Dec 19++ new cases peak is not being reflected at all in increased deaths
NEW CASES PEAKS (in 2021): Jan 13, April 29, August 27, Dec 19 and still rising
NEW DEATHS PEAKS (in 2021): Jan 26, May 1, Aug 25.
Anyway, its strange that the first 3 peaks are almost simultaneous (I thought new deaths lagged new cases by 4-6 weeks), and then no deaths wave yet for the new wave 4th peak
https://www.nytimes.com/interactive/2021/world/covid-cases.html
Scroll down past the map and the table to the 2 graphs.
the left graph - New reported cases by day
with the right graph - New reported deaths by day.
The horizontal (dates) scales are the same.
I opened a 2nd window and put the new cases one above the new deaths one.
I also got some tracing paper and drew a rough version of new cases and put it against new deaths
I also toyed with the hypothesis that maybe the new cases peaks were 3 1/2 to 4 months ahead of the new deaths peaks, e.g. the new cases peak of Jan 13 caused the new deaths peak of May 1, and so on, but doubt that and causes other issues in explaining what's going on so hypothesis rejected.
BumRushDaShow
(172,250 posts)might be the fact that infections were never uniform over a fixed time period, both globally and domestically. In fact, an increasingly standard assumption has evolved that the U.S. infections from a new variant have occurred about "2 - 3 weeks after UK infections".
The pandemic has always been a bubbling cauldron where in a specific time range, a set of regions were hitting a peak of infection while other areas only had few or no confirmed cases.
As an extreme example, during the period when FL was peaking, a different large population states like NY, were at a lull, having come off their peak.
So the graph literally only shows the series of snapshots of total cases/deaths over time but is blending (smoothing) where they happened. I.e., this pandemic spread around the country (and world) in a non-uniform fashion. Early on in the pandemic in the U.S., your largest infections were happening in the northeast, and took time before hitting much of the rest of the country and you never had all of the states with large populations, simultaneously reaching a peak for cases, hospitalizations, or deaths at exactly the same time.
I expect it would be difficult to find time periods where there was some type of "synchronization" of peaks and valleys around the country.
I want to almost give an analogy like this -

So for example if you made a graph with a series of distinct overlaid plots for each locale and label (on the plot vs on an axis) the peaks for cases, hospitalizations, and deaths, with the Y axis as totals and the X axis showing time, you will see the skew better. Sortof like this -
Using actual NYT data, you see the skew (shift) (the Y-scale is a bit different but shouldn't be too much of an issue with the below comparisons but I wish they had kept the scales the same or allowed the Y axis to be adjustable so you could see a truer "overall" comparison) -
TEXAS

NEW YORK

FLORIDA

Where NY had been at a "lull" around the July time period and gradually increased while TX and FL suddenly exploded. Similarly you will see the November time frame where FL came off a large summer peak where NY was already taking off again.
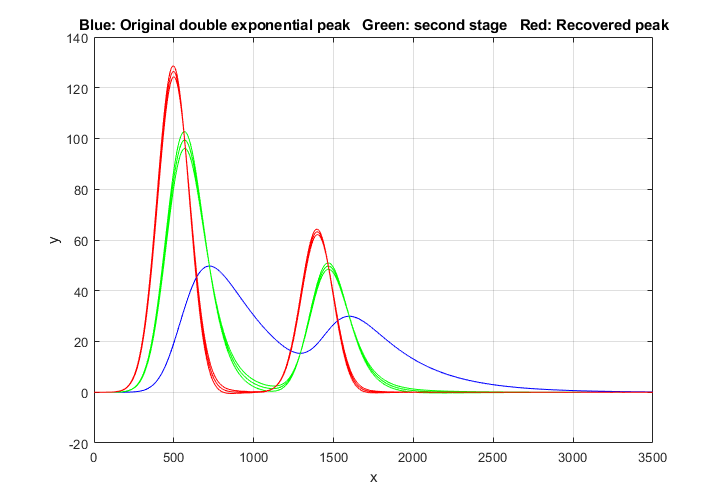
So using the generic chart that I manually annotated with a yellow (ball-parked free-draw) curve to average the red/green/blue curves, you see sortof that average shift of the max and time (and normally the green would probably be a good fit for an average of red & blue, the blue has such a long tail that it would skew the whole average including the green line, to the right)-

So when looking at "global" (or say "U.S." ) "peaks", that is nothing but an "average over time" of all the data and the skew would be enough to distort trying to calculate the timing between cases and hospitalizations and then between hospitalizations and deaths, since those time intervals are only measured in weeks and the "waves" have never been uniform.
progree
(13,077 posts)more time looking at narrower areas too for comparison (U.S. and individual states).
I much appreciate your time putting all this together! 
BumRushDaShow
(172,250 posts)I was on a coffee IV drip trying to do that this morning!
I am certain you will see similar lag times between confirmed symptomatic positives and hospitalizations and then between hospitalizations through to fatal outcomes when focusing individually on smaller countries or regions/individual states here in the U.S.
The variable that would probably shift those lag times when compared to last year, is that now that we have vaccines and some additional treatments, you may have a longer lag between hospitalization and a fatality or no fatality at all once hospitalization is no longer needed (even for some of the more severe cases).

appalachiablue
(44,180 posts)
IronLionZion
(51,551 posts)As an introvert, I enjoyed keeping distance from people long before COVID
Ms. Toad
(38,824 posts)(car or house) since March 2020.
NickB79
(20,405 posts)It was PACKED. Bad mistake on my part, but I was in desperate need of a walk, and it was 20F outside. I didn't stay long.
But.......
Only about 25% were wearing masks 🤬
herding cats
(20,056 posts)I just ran across this in STAT news and thought of this thread.

https://www.statnews.com/2021/12/20/omicron-variant-now-makes-up-73-of-covid-infections-diagnosed-in-u-s/
BigmanPigman
(55,525 posts)OneCrazyDiamond
(2,070 posts)Like at the same time and be asymptomatic.

moriah
(8,312 posts)In her low vaccination state, immunocompromised Susan whose shots didn't take completely gets two holiday visitors who drop by to give her holiday gifts and a hug.
They also each gave her a different "gift" -- two gifts that start multiplying within her, each broadcasting thousands of mutated versions of each other into her system. A few of her lung cells end up being an unknown lab where the two viruses, being so similar, recombine in the cells, and as she goes to all her medical appointments, it spreads....
Resulting in .... COVID Sigma, in theaters near you.
progree
(13,077 posts)from a week ago (7dma is 7 day moving average) and highest since September 19 -- in the U.S.
And there are probably some more Monday cases to be reported as I've found comparing late at night vs mid-day next day
https://www.nytimes.com/interactive/2021/us/covid-cases.html
no paywall, no quota, the "Last 90 days" button is very helpful. Map not to be missed
===============================
The world: daily new cases (7 day moving avg) has surpassed its summer peak for the first time
https://www.nytimes.com/interactive/2021/world/covid-cases.html

Bengus81
(10,368 posts)Another Republican will not be voting in November.
moriah
(8,312 posts).... and now so are admissions and ICU numbers. Vents are still currently stable.
Each time a new strain emerges we seem to get a bloom -- even if we had some "luck" in that the other strains took longer to get into Arkansas (which is closer to "flyover country" than other parts of the South, so the bloom was delayed.
Louisiana going so fast to half the tested strains there showing as Omicron via Nextstrain was scaring me even before I read this especially as I don't know if my state or other neighboring states are sequencing or if it's just the CDC doing it so we were going to have delayed reporting.
Our state's ICU system is far more fragile than our ability to vent patients -- if we go much more over our current 200 ICU admissions, more beds will have to be opened, wards transformed again, etc. We hit the 500s for ICU admissions in the last bloom, which seems to be about when our system can't do anymore to make more beds. Listening to the EMS scanner showing how each call was getting told that this hospital had no ICU or ER (and sometimes even no OB) capacity. even in the attempted round-robin computer routing they got to say which hospital they should ask about w/ the people in direct communication w/ hospital intake, was scary.
Praying that the insane transmissibility of this particular variant, even if people try to be safe w/ holiday gatherings, will not cause the scanner to sound similar in three weeks.

Kick in to the DU tip jar?
This week we're running a special pop-up mini fund drive. From Monday through Friday we're going ad-free for all registered members, and we're asking you to kick in to the DU tip jar to support the site and keep us financially healthy.
As a bonus, making a contribution will allow you to leave kudos for another DU member, and at the end of the week we'll recognize the DUers who you think make this community great.