The Fed lifts rates by half a point, acknowledging that inflation is easing
Last edited Wed Dec 14, 2022, 04:16 PM - Edit history (1)
Source: CNN Business
Washington, DC CNN — The Federal Reserve approved a half-point interest rate hike on Wednesday, a smaller increase than in recent months and an acknowledgment that inflation is finally easing. The increase marks a shift for the central bank after an unprecedented year that includes seven-straight rate hikes as part of an aggressive campaign to try and bring down the highest inflation since the early 1980s.
While lower than the four consecutive three-quarter-point hikes approved at the Fed’s previous meetings, Wednesday’s rate hike is still twice the size of the central bank’s customary quarter-point increase and will likely deepen the economic pain for millions of American businesses and households by pushing up the cost of borrowing even further.
Fed officials will increase the rate that banks charge each other for overnight borrowing to a range of 4.25-4.5%, the highest since 2007. The Fed also released its highly anticipated Summary of Economic Projections, which includes what is colloquially known as the dot plot. Investors pay close attention to these forecasts, which show where each of its 19 leaders expect interest rates to go in the future, for clues about the path of rate hikes in the new year and beyond.
The December projections showed a more aggressive monetary policy tightening path, with the median “dot” rising to a new peak in federal fund rates of 5-5.25% up from 4.5-4.75% in September. That would mean Fed officials expect to raise rates by half a percent more than they did three months ago, when the plot was last released. Policymakers also projected that PCE inflation, the Fed’s favored price gauge, would remain above its 2% target until at least 2025.
Read more: https://www.cnn.com/2022/12/14/economy/federal-reserve-december-meeting-final/index.html
Article updated.
Original article -
The Federal Reserve approved a half-point interest rate hike on Wednesday, a smaller increase than in recent months and an acknowledgment that inflation is finally easing.
The increase marks a shift for the central bank after an unprecedented year that includes seven-straight rate hikes as part of an aggressive campaign to try and bring down the highest inflation since the early 1980s.
While lower than the four consecutive three-quarter-point hikes approved at the Fed’s previous meetings, Wednesday’s rate hike is still twice the size of the central bank’s customary quarter-point increase and will likely deepen the economic pain for millions of American businesses and households by pushing up the cost of borrowing even further.
This story is developing and will be updated.
 = new reply since forum marked as read
Highlight:
NoneDon't highlight anything
5 newestHighlight 5 most recent replies
= new reply since forum marked as read
Highlight:
NoneDon't highlight anything
5 newestHighlight 5 most recent replies

IronLionZion
(51,269 posts)sound strategy based on recent inflation numbers. It looks like they know what they're doing.

progree
(12,977 posts)Last edited Thu Jan 12, 2023, 11:24 AM - Edit history (7)
CPI: 2.47%, CORE CPI: 4.72%
PPI: 1.05%, CORE PPI: 1.51%
PCE: 2.42%, CORE PCE: 3.71%
Update: December CPI report updated 1/12/23
Latest 6 (six) months ANNUALIZED
CPI: 1.89%, CORE CPI: 4.55%
Latest 3 (three) months ANNUALIZED thru December
CPI: 1.83%, CORE CPI: 3.14%
See bottom of post for details on the CPI released 1/12/23
For CPI and PCE, CORE means all items less food and energy
For PPI (producer price index), there seems to be two different definitions of Core. I chose the "less food and energy" one for consistency. The other, that the BLS highlights, is less food, energy, and trade services
###### CPI, PPI, PCE Thru November ########
###### CPI, PPI, PCE Thru November ########
Last 5 months thru November, ANNUALIZED: CPI: 2.47%, CORE CPI: 4.72%
CPI: https://data.bls.gov/timeseries/CUSR0000SA0
CORE CPI: http://data.bls.gov/timeseries/CUSR0000SA0L1E
CPI Report: https://www.bls.gov/news.release/cpi.nr0.htm
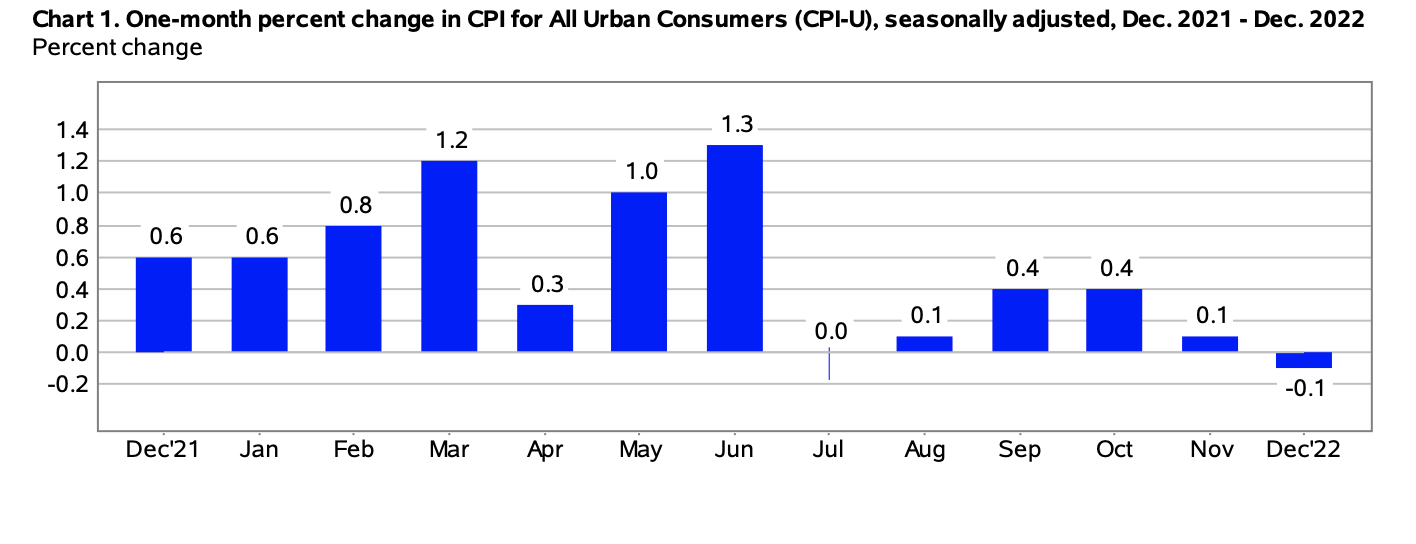
CPI thru November:
YEAR Jan Feb Mar ... Nov
2022 281.933 284.182 287.708 288.663 291.474 295.328 295.271 295.620 296.761 298.062 298.349
2022 0.6 0.8 1.2 0.3 1.0 1.3 0.0 0.1 0.4 0.4 0.1 (1mo change)
2022 1.9 2.0 2.7 2.4 2.6 2.6 2.3 1.4 0.5 0.9 0.9 (3mo change)
2022 7.5 7.9 8.6 8.2 8.5 9.0 8.5 8.2 8.2 7.8 7.1 (12 mo change)
CORE CPI thru November:
YEAR Jan Feb Mar ... Nov
2022 286.431 287.878 288.811 290.455 292.289 294.354 295.275 296.950 298.660 299.471 300.066
2022 0.6 0.5 0.3 0.6 0.6 0.7 0.3 0.6 0.6 0.3 0.2 (1mo change)
2022 1.7 1.7 1.4 1.4 1.5 1.9 1.7 1.6 1.5 1.4 1.0 (3mo change)
2022 6.0 6.4 6.4 6.1 6.0 5.9 5.9 6.3 6.7 6.3 6.0 (12mo change)
CPI 5 months annualized thru November: (298349/295328)^(12/5)-1 = .0247 = 2.47%
CORE CPI 5 months annualized thru November (300066/294354)^(12/5)-1 = .0472 = 4.72%
And I found this. Watch from 0:40 to 1:50:
https://www.msn.com/en-us/money/news/jeremy-siegel-if-fed-stopped-looking-at-stale-housing-data-they-d-realize-inflation-is-over/vi-AA15exZ9
Title: Jeremy Siegel: If Fed stopped looking at stale housing data they'd realize inflation is over.
from video, my notes, not an exact transcript:
The shelter number in the CPI report is: November: +0.6%, 12 months: +7.1%
https://www.bls.gov/news.release/cpi.nr0.htm
He doesn't say what's wrong with the CPI's housing data (called Shelter in the CPI reports I've seen). About all I "know" is that they use actual rental data and "owner's equivalent rent" where they ask the owners what they think they could rent it for. They don't use house prices at all -- they consider that an investment, not a consumer expenditure.
There's also articles that explain that rents are "sticky", i.e. a contract is signed for 12 months, so for any month, only 1/12 of them are new rentals or renewals -- these new or renewing rentals are going down. But because the other months stay where they are, the change in one or two months have little effect on the overall average. In any rolling average, what drops out the tail end is just as important as the new incoming numbers.
This doesn't explain a 0.6% increase just in November though.
CPI up 15.7% over past 3 years (5.0%/year). Past 2 years: up 14.4% (7.0%/year) (thru November 2022)
Past 1 year: up 7.1% (7.1%/year)
The per year number for the past 3 years (5.0%/year) is a little less than simply dividing the 15.7% by 3, because of compounding.
CPI: https://data.bls.gov/timeseries/CUSR0000SA0
November CPI index numbers:
2019 2020 2021 2022
257.788 260.721 278.524 298.349
3 year change: (298.349/257.788) - 1 = 0.157 = 15.7%
Annualized: (298.349/257.788)^(1/3) - 1 = .050 = 5.0%
Similarly for the 2 year changes.
So basically we've had a 1.1% year (Nov'20/Nov'19) followed by a a 6.8% year (Nov'21/Nov'20) followed by a 7.1% year (Nov'22/Nov'21).
==== PRODUCER PRICE INDEX =================
Producer Price Index (PPI), seasonally adjusted thru November
http://data.bls.gov/timeseries/WPSFD4
YEAR JAN FEB ... NOV
2022 133.538 134.957 137.241 137.954 139.072 140.361 139.796 139.748 140.119 140.558 140.975 (index)
2022 1.2 1.1 1.7 0.5 0.8 0.9 -0.4 0.0 0.3 0.3 0.3 (1 month)
2022 2.7 2.8 4.0 3.3 3.0 2.3 1.3 0.5 -0.2 0.5 0.9 (3 month)
2022 10.2 10.5 11.7 11.2 11.0 11.1 9.7 8.7 8.5 8.1 7.4 (12 months)
The last 4 months are preliminary
CORE PPI - Producer Price Index, seasonally adjusted - Final demand goods less foods and energy thru November -
http://data.bls.gov/timeseries/WPSFD413
YEAR JAN FEB ... NOV
2022 132.218 133.285 134.742 136.238 137.209 137.849 138.022 138.308 138.329 138.280 138.714
2022 0.8 0.8 1.1 1.1 0.7 0.5 0.1 0.2 0.0 0.0 0.3 (1 month)
2022 2.1 2.1 2.8 3.0 2.9 2.3 1.3 0.8 0.3 0.2 0.3 (3 months)
2022 9.5 9.8 10.0 10.1 9.8 9.2 8.5 8.1 7.5 6.7 6.2 (12 months)
The last 4 months are preliminary
PPI: Last 5 months thru November: (140.975/140.361)^(12/5)-1 = 0.0105 = 1.05%
CORE PPI: Last 5 months thru November: (138.714/137.849)^(12/5)-1 = 0.0151 = 1.51% (less food & energy)
==== PCE PRICE INDEX (Fed's favorite) =================
https://www.bea.gov/news/2022/personal-income-and-outlays-november-2022
Last 12 months ANNUALIZED thru November: PCE: +5.5%, CORE PCE: +4.7%
Last 5 month ANNUALIZED thru November: PCE: +2.42%, CORE PCE: +3.71%
Last 2 months ANNUALIZED thru November: PCE: +2.90%, CORE PCE: +2.61%
MONTHLY CHANGES, %
JUL AUG SEP OCT NOV
-0.1 0.3 0.3 0.4 0.1 PCE
0.1 0.6 0.5 0.3 0.2 Core PCE
12 MONTH CHANGES, %
JUL AUG SEP OCT NOV
6.4 6.3 6.3 6.1 5.5 PCE
4.7 4.9 5.2 5.0 4.7 CORE PCE
Detailed monthly PCE price indexes can be found on Table 2.3.4U.https://apps.bea.gov/iTable/?reqid=19&step=3&isuri=1&select_all_years=0&nipa_table_list=2015&series=m&first_year=2020&last_year=2022&scale=-99&categories=underlying&thetable=#eyJhcHBpZCI6MTksInN0ZXBzIjpbMSwyLDNdLCJkYXRhIjpbWyJuaXBhX3RhYmxlX2xpc3QiLCIyMDEzIl0sWyJjYXRlZ29yaWVzIiwiU3VydmV5Il1dfQ==
. . . . . . . JAN FEB MAR ... NOV
. . . . . PCE 119.469 120.178 121.321 121.563 122.300 123.512 123.397 123.728 124.154 124.617 124.747
CORE PCE 120.761 121.205 121.651 122.030 122.488 123.258 123.352 124.031 124.607 124.933 125.143
PCE 5 months annualized thru November: (124.747/123.512)^(12/5)-1 = .0242 = 2.42%
CORE PCE 5 months annualized thru November: (125.143/123.258)^(12/5)-1 = .0371 = 3.71%
PCE 2 months annualized thru November: (124.747/124.154)^(12/2)-1 = .0290 = 2.90%
CORE PCE 2 months annualized thru November: (125.143/124.607)^(12/2)-1 = .0261 = 2.61%
===================================================
Edited to Add: CPI For December from 1/12/23 report
CPI report: https://www.bls.gov/news.release/cpi.nr0.htm
CPI: https://data.bls.gov/timeseries/CUSR0000SA0&output_view=pct_1mth
CORE CPI: http://data.bls.gov/timeseries/CUSR0000SA0L1E&output_view=pct_1mth
Click on "More Formatting Options" near the top right, and check the checkboxes to show other periods like original, 1 month, 3 months, 6 months, 12 months, and then click the "Retrieve Data" button
CPI thru December:
YEAR Jan Feb Mar ... Dec
2022 281.933 284.182 287.708 288.663 291.474 295.328 295.271 295.620 296.761 298.062 298.349 298.112
2022 0.6 0.8 1.2 0.3 1.0 1.3 0.0 0.1 0.4 0.4 0.1 -0.1 (1mo change)
2022 1.9 2.0 2.7 2.4 2.6 2.6 2.3 1.4 0.5 0.9 0.9 0.5 (3mo change)
2022 7.5 7.9 8.6 8.2 8.5 9.0 8.5 8.2 8.2 7.8 7.1 6.4 (12 mo change)
CORE CPI thru December:
YEAR Jan Feb Mar ... Dec
2022 286.431 287.878 288.811 290.455 292.289 294.354 295.275 296.950 298.660 299.471 300.066 300.974
2022 0.6 0.5 0.3 0.6 0.6 0.7 0.3 0.6 0.6 0.3 0.2 0.3 (1mo change)
2022 1.7 1.7 1.4 1.4 1.5 1.9 1.7 1.6 1.5 1.4 1.0 0.8 (3mo change)
2022 6.0 6.4 6.4 6.1 6.0 5.9 5.9 6.3 6.7 6.3 6.0 5.7 (12mo change)
CPI 6 months annualized thru December: (298112/295328)^(12/6)-1 = .018942 = 1.89%
CORE CPI 6 months annualized thru December: (300974/294354)^(12/6)-1 = .045486 = 4.55%
progree
(12,977 posts)Last edited Fri Jan 13, 2023, 03:41 PM - Edit history (1)
Thanks starfury
https://cpiinflationcalculator.com
As for the CORE CPI, which is Fed's target (actually the CORE PCE), I couldn't find a similar graph, but here is an ASCII graph I made:
CORE CPI thru December:
YEAR Jan Feb Mar ... Dec
2022 0.6 0.5 0.3 0.6 0.6 0.7 0.3 0.6 0.6 0.3 0.2 0.3 (1mo change)
CORE CPI thru December monthly changes in tenths of a percent:

On the CORE PCE (the fed's target), its only available thru November and I'd have to dig for changes before July, but anyway here it is
JUL AUG SEP OCT NOV
0.1 0.6 0.5 0.3 0.2 Core PCE (1 mo change)
bucolic_frolic
(55,141 posts)Prices never come down. They just don't go up as fast. Anyone who believes the Fed is drunk on servility. They played this game in the 1970s. Every tick of slower inflation they played up, every chance to boost the economy they expanded the money supply to keep the economy from collapsing, all until inflation reached 14%. They won't give us the real medicine until the bond market screams about devaluing the currency. We're years away from that.
FredGarvin
(846 posts)Families are getting absolutely crushed.
People cant afford these price increases.
IronLionZion
(51,269 posts)The Fed sees any deflation as a recession indicator and believes it has a mandate to stop it aggressively.
They are quick to increase the money supply. But very slow to ever decrease it.
FredGarvin
(846 posts)Running 3X higher than their goal and not easing
IronLionZion
(51,269 posts)We're unlikely to ever see inflation go below that, let alone below 0%. Fed will take action in the other direction, fast.
muriel_volestrangler
(106,212 posts)CNN has had 30 minutes, and they still haven't put in a vital fact they could have filled in before the decision was announced.
FredGarvin
(846 posts)The HF Wall Street trading algos didnt like it at first.
Hopefully our IRA's and 401K's will rebound on possible bailout rumors.
progree
(12,977 posts)Also, Marketwatch Calendar has: SEP median federal funds rate for end of 2023: 5.00%-5.25%
IronLionZion
(51,269 posts)the real numbers are a constantly changing range that you can see on the Fed's website.
progree
(12,977 posts)Do you have a link for that, please.
My understanding is that the current range is now, with today's decision, 4.25% to 4.50%
and that won't change until the next highly publicized decision Feb 1, barring an emergency situation, and headlines will be blaring when that happens.
Edit: I should say "target range" in the above. No doubt the real world actual rate sometimes falls outside the target /Edit.
I did find the website but there is so much to wade through. I tried a couple of the likely places. So many more links to explore, sigh
https://www.federalreserve.gov/
IronLionZion
(51,269 posts)New York Fed has these tables and charts. I find it easier to just use the discount rate.
https://www.newyorkfed.org/markets/reference-rates/effr
progree
(12,977 posts)Thanks!
FredGarvin
(846 posts)For "banks"
IronLionZion
(51,269 posts)FredGarvin
(846 posts)For banks and "investment banks".
Maybe 1%?
progree
(12,977 posts)3.75-4.00%
and then I scroll down a little ways:
December 14, 2022
The Federal Open Market Committee has increased the target range for the federal funds rate to 4.25 to 4.50 percent.
FOMC Statement
November 02, 2022
The Federal Open Market Committee has increased the target range for the federal funds rate to 3.75 to 4.00 percent.
IronLionZion
(51,269 posts)

Bengus81
(10,165 posts)And see if ONE DAMN price has gone down on anything. Gas is still almost 3.00 here in the Midwest of course that decline has nothing to do with interest rate hikes.
Nope...all about making US Bank,BOA,Chase and all the usual suspects BILLIONS more in profit than they thought they would ever see at this time last year.
IronLionZion
(51,269 posts)like mortgages, car loans, business loans, etc. The thinking is that if rates are high, there will be fewer buyers. A person who wants a home to live in is supposedly more likely to stomach the pain of a higher mortgage interest rate than an investor who wants to rent it out.
FredGarvin
(846 posts)Hopefully.
Im tired of my home tax bills rising.
Bengus81
(10,165 posts)You can still get a loan on a new car in the high 5% range if a person shops around enough and has good credit. That's just 2% higher than a year ago and won't slow anyone down from buying. Buying a 35,000 car and paying it off in six years will cost someone a mere $25.00 per month more than a year ago. That won't stop ANYONE from buying.
Meanwhile credit card rates have exploded to anywhere from 18% to 25% depending on which card you have. People are so freaking strapped from this endless GREEDflation they are now putting everyday expenses on plastic. Thanks to the fucking FED they're just making it worse,not better.
IronLionZion
(51,269 posts)that's a very predatory kind of debt to be in. People often get stuck and pay much more than the principal was ever worth. Banks get wealthy over this.
Bengus81
(10,165 posts)Just to watch it lose 10k in deprecation in one year. Whatever..."don't use credit cards" isn't the answer,the answer is to stop this non ending GREED and jacking interest rates ever 30 days.
progree
(12,977 posts)From the OP:
From Yahoo Finance:
The central bank lifted its key policy rate by half a percentage point, slowing the pace from hikes of 75 basis points across the prior four meetings. The move brings the federal funds rate to a new range of 4.25% to 4.5%, the highest level since December 2007.
Fresh economic forecasts from the Fed that accompanied the decision show officials now see benchmark interest rates peaking at 5.1% in 2023, 50 basis points higher than the previously projected 4.6% in September. Officials then see rates coming down to 4.1% in 2024, slightly higher than previously projected.
MORE: https://finance.yahoo.com/news/stock-market-news-live-updates-december-14-2022-111241774.html