Inflation rose at a 4% annual rate in May, the lowest in 2 years
Source: CNBC
The inflation rate cooled in May to its lowest annual rate in more than two years, likely taking pressure off the Federal Reserve to continue raising interest rates, the Labor Department reported Tuesday.
The consumer price index, which measures changes in a multitude of goods and services, increased just 0.1% for the month, bringing the annual level down to 4%. That 12-month increase was the smallest since March 2021, when inflation was just beginning to rise to what would become the highest in 41 years.
Excluding volatile food and energy prices, the picture wasn’t as optimistic.
So-called core inflation rose 0.4% on the month and was still up 5.3% from a year ago, indicating that while price pressures have eased somewhat, consumers are still under fire.
Read more: https://www.cnbc.com/2023/06/13/cpi-inflation-report-may-2023-.html
From the source -
Link to tweet
@BLS_gov
·
Follow
CPI for all items rises 0.1% in May; shelter and used cars and trucks up https://bls.gov/news.release/cpi.nr0.htm#CPI
#BLSdata
8:33 AM · Jun 13, 2023
Article updated.
Original article -
The consumer price index, which measures changes in a multitude of goods and services, increased just 0.1% for the month, bringing the annual level down to 4%. That 12-month increase was the smallest since March 2021, when inflation was just beginning to rise to what would become the highest in 41 years.
Excluding volatile food and energy prices, the picture wasn't as optimistic.
So-called core inflation rose 0.4% on the month and was still up 5.3% from a year ago, indicating that while price pressures have eased somewhat, consumers are still under fire.
 = new reply since forum marked as read
Highlight:
NoneDon't highlight anything
5 newestHighlight 5 most recent replies
= new reply since forum marked as read
Highlight:
NoneDon't highlight anything
5 newestHighlight 5 most recent replies

mahatmakanejeeves
(71,236 posts)In May, the Consumer Price Index for All Urban Consumers increased 0.1 percent, seasonally adjusted, and rose 4.0 percent over the last 12 months, not seasonally adjusted. The index for all items less food and energy increased 0.4 percent in May (SA); up 5.3 percent over the year (NSA).
Consumer Price Index Summary
Transmission of material in this release is embargoed until 8:30 a.m. (ET) Tuesday, June 13, 2023
Technical information: (202) 691-7000 * cpi_info@bls.gov * www.bls.gov/cpi
Media contact: (202) 691-5902 * PressOffice@bls.gov
CONSUMER PRICE INDEX - MAY 2023
The Consumer Price Index for All Urban Consumers (CPI-U) rose 0.1 percent in May on a seasonally adjusted basis, after increasing 0.4 percent in April, the U.S. Bureau of Labor Statistics reported today. Over the last 12 months, the all items index increased 4.0 percent before seasonal adjustment.
The index for shelter was the largest contributor to the monthly all items increase, followed by an increase in the index for used cars and trucks. The food index increased 0.2 percent in May after being unchanged in the previous 2 months. The index for food at home rose 0.1 percent over the month while the index for food away from home rose 0.5 percent. The energy index, in contrast, declined 3.6 percent in May as the major energy component indexes fell.
The index for all items less food and energy rose 0.4 percent in May, as it did in April and March. Indexes which increased in May include shelter, used cars and trucks, motor vehicle insurance, apparel, and personal care. The index for household furnishings and operations and the index for airline fares were among those that decreased over the month.
The all items index increased 4.0 percent for the 12 months ending May; this was the smallest 12-month increase since the period ending March 2021. The all items less food and energy index rose 5.3 percent over the last 12 months. The energy index decreased 11.7 percent for the 12 months ending May, and the food index increased 6.7 percent over the last year.
{snip a lot of number and thingies}
Contact Information
For additional information about the CPI visit www.bls.gov/cpi or contact the CPI Information and Analysis Section at 202-691-7000 or cpi_info@bls.gov.
For additional information on seasonal adjustment in the CPI visit www.bls.gov/cpi/seasonal-adjustment/home.htm or contact the CPI seasonal adjustment section at 202-691-6968 or cpiseas@bls.gov.
If you are deaf, hard of hearing, or have a speech disability, please dial 7-1-1 to access telecommunications relay services.

BumRushDaShow
(172,814 posts)

progree
(13,094 posts)
though nowadays they look at things like "supercore service inflation" and core ex shelter and who knows what other series.
Edited to add Same graph as above but CPI and CORE CPI shown separately for less clutter and more clarity

Various series:
BLS CPI press release: https://www.bls.gov/news.release/cpi.nr0.htm
CPI: https://data.bls.gov/timeseries/CUSR0000SA0&output_view=pct_1mth
CORE CPI: http://data.bls.gov/timeseries/CUSR0000SA0L1E&output_view=pct_1mth
For all BLS timeseries data, one can see the index values and other periods like rolling 3 month, rolling 6 month, rolling 12 months by clicking "More Formatting Options" on the upper right and then on the page that shows up, check the various checkboxes
REAL AVERAGE HOURLY EARNINGS of production and non-supervisory workers https://data.bls.gov/timeseries/CES0500000032 ,
. . . private workers: https://data.bls.gov/timeseries/CES0500000013
CPI excluding shelter - https://data.bls.gov/timeseries/CUUR0000SA0L2
. . . FRED: https://fred.stlouisfed.org/series/CUUR0000SA0L2
. . . Table 3 has CPI ex shelter, as well as Core ex shelter https://www.bls.gov/news.release/cpi.t03.htm
Rent (SA) https://data.bls.gov/timeseries/CUSR0000SEHA
Fred: (SA) Rent of Primary Residence in U.S. City Average https://fred.stlouisfed.org/series/CUSR0000SEHA
(NSA) https://fred.stlouisfed.org/series/CUSR0000SEHA
SA = Seasonally Adjusted, NSA = Not Seasonally Adjusted
BumRushDaShow
(172,814 posts)I suppose you could still say that y-o-y it is still lower than last year this time and seems to be "stepping down" vs "curving down" ( "drops" then "plateaus", then "drops" again, and ten "plateaus" again).
An anecdotal note - one of my sisters just bought a late model, low-mileage used car (compact SUV) yesterday (which had originally been a leased car). She said the dealer mentioned to her and her hubby that they were getting desperate because even their previously-leased low mileage cars were "sitting" and they couldn't get them sold - at least at the prices they were quoting (probably due to the higher loan interest rates IMHO). So she was able to get a couple thousand knocked off (and that was with it being one of the more expensive trims). And she coupled it with a good down payment to go along with that, putting it within her desired budget, and making it a nice upgrade to the car that she had before (same model but older and lesser trim).
So like the housing prices, there is probably going to be a shift (and in some cases it has already started) to lower sales prices for those items to account for the rise of the loan costs, in order to get them moved.
progree
(13,094 posts)considers the best predictor of FUTURE inflation (as do I). That's because energy and food price changes (components of the regular CPI but not the core CPI) are far more volatile and bounce around from month to month. The Fed can't change course based on a sudden one or two or a few months fuel price drop or increase, nor should they.
I haven't read anything differently. So I'm not particularly giddy bubbly boo about this inflation report. Au contraire, I'm disappointed that the core is stuck where its stuck at more than twice their 2% target.
As you probably know, I don't give a rat's ass about yoy changes, as I think they are less than virtually worthless in assessing CURRENT or RECENT inflation. In particular, the change in the yoy number from one month to the next is affected by 2 things, and only 2 things: the newly added most recent month (as of course it should), and the ancient ancient number that dropped out of the series 12 months ago.
I look at rolling 3 month averages for its recency, but less affected by a one-month outlier number than just using the lastest one month. I consider the rolling 3 month as sort of a smoothed version of the most recent
The rolling 3 months of the CORE CPI over the last 6 months:
4.3% 4.6% 5.2% 5.1% 5.1% 5.0%
The first number is the 3 month average Oct'22 - Dec'22
The second number is the 3 month average Nov'22 - Jan'23
The third number is the 3 month average Dec'22 - Feb'23
and so on with the last number being the 3 month average Mar'23-May'23
Obviously it's pretty much flat-lined at more than 2X the Fed's 2% target.
On housing prices - house prices aren't part of the CPI. They are considered an investment, not a consumption item. When a house is sold for a higher price, the previous owner gains while the new owner loses. I know that's controversial, but that's life in sucksville.
Rather they look at rent and owner equivalent rent (the latter an owner's estimate of what it would rent for. This is what the owner loses out on by occupying the residence rather than renting it out).
I've been hearing ever since September about how rent is a lagging number and how new rents are dropping and its going to make the CPI and CORE CPI wonderful. Ever since September. (Housing aka shelter is 40% of the Core CPI and 1/3 of the regular CPI if I'm remembering the numbers correctly).
BumRushDaShow
(172,814 posts)to determine what it is absent to the wild swings of certain items.
But what I'm looking at is going back to when the inflation first spiked and then seeing how it has "stepped down" - literally in a stair-step fashion - since that point.
The NYT had such a graph (at least leading up to April) with the contributors and it looks like it might be "wage related" -

(from here - https://www.nytimes.com/2023/04/27/business/economy/what-causes-inflation.html)
This was Bloomberg's (current) through May 2023 and you can see the "stair step" effect -
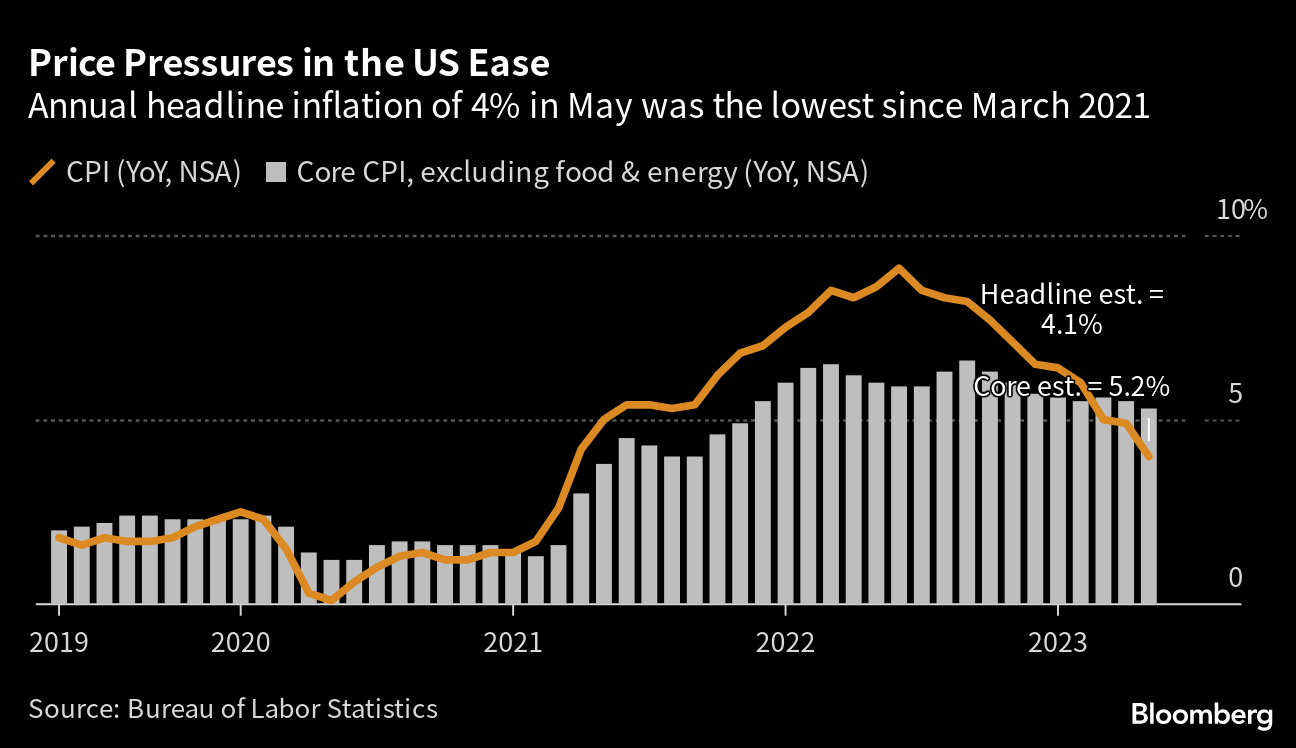
(from here - https://www.bloomberg.com/news/articles/2023-06-13/us-inflation-slows-giving-room-for-fed-to-pause-rate-hikes)
This way, you have your general pre-inflation shock "baseline" and can see the front of the peak and the delta over a longer period of time. Looking within shorter periods, it doesn't seem to be doing anything but plateauing, whereas it really is dropping, but incrementally so since it is "slow".
What this would show is how different "things" (some being "solutions" ) "thrown at the problem" are impacting the core.
For example, you had a nasty, once-in-a-century pandemic that not only caused an impact on the workforce (with over 1 million fatalities), but also triggered (was a catalyst for) what was dubbed "The Great Resignation®" and an exodus of workers as baby boomers suddenly started retiring (who had been working far beyond expectations). That then caused a brief but major "employment shock", coupled with global supply chain issues (exposing a major weakness to manufacturing here), resulting in a short recession. Businesses lost money and people lost (or re-prioritized) their livelihoods and lives.
To combat that, money was released to keep businesses functioning and paychecks flowing (GDP), while interest rate changes (end of quantitative easing) were underway. This it outside of any "spite" price increases by the usual nefarious entities. 
(I blame YOU guys for me doing this!! 
 )
)
progree
(13,094 posts)and I think the trendline of the YOY numbers are misleading about price trends in the last several months.
The last 8 monthly increases of the core CPI were:
0.3 0.3 0.4 0.4 0.5 0.4 0.4 0.4
And that is a plateauing to me.
I fully acknowledge that prices were rising faster a year ago than recently. Consequently every month when a high-increase monthly number from a year ago drops out of the 12 month series, that means an improvement in the yoy number.
For example when a +0.6% monthly increase from 13 months ago drops out of the series, and is replaced by a lower, say +0.4% monthly increase number, then yes the yoy number is going to go down. But frankly, I don't care what the number was 13 months ago when assessing CURRENT or RECENT inflation trends.
Everyone is going to have to make up their own minds on this. I'm not alone on thinking that yoy numbers are not relevant in assessing CURRENT or RECENT inflation trends. Jeremy Siegal is one that comes to mind, but not the only one.
BumRushDaShow
(172,814 posts)but I like looking at the full "trend" over time. Sortof comes with looking at a million HPLC and GC (High Performance Liquid Chromatography and Gas Chromatography) chromatograms that plot peak heights (based on detection method) over time to get concentrations. The "snaphot" of that when changing the detector wavelengths or other parameters, would provide a 3-D plot.
progree
(13,094 posts)I have all those in my spreadsheet for several inflation measures.
Happily, the BLS time series like I have in post number 2 allows one to look at all these as well.
E.g. for the Core CPI: http://data.bls.gov/timeseries/CUSR0000SA0L1E
One can see the index values and other periods like rolling 2 month, 3 month, rolling 6 month, rolling 12 months by clicking "More Formatting Options" on the upper right and then on the page that shows up, check the various checkboxes -- Original data value, 1-month Percent change, 2-month percent change, yada.
And they all show up on the same page.
In deciding when the current inflation began, I looked at all of these.
For assessing long range trends, I find rolling 3 month just as interesting and informative as rolling 12 month.
I have an M.S.E.E. and worked in the planning department of an electric utility, so I have some professional experience in forecasting, and more than a few numerical analysis and statistics courses.
BumRushDaShow
(172,814 posts)I was one course (statistics) from having a math minor but there was just no room to put it (thanks to all the 4 hour-1 credit labs). 
I know you guys have had the statistics although I have had to still use it in a pile of things. 
progree
(13,094 posts)BumRushDaShow
(172,814 posts)And I do think they need to see how some of the weaker, on-the-bubble Regional banks respond after the 15-months straight worth of rate hikes and 3 bank failures. It could give them time to deal with their bond problems.

Johnny2X2X
(24,494 posts)4% is not severe anymore. The month over month number of 0.1% should cause the Fed to pause.
Recession chances downgraded to 25%.
Expect a huge tantrum from Republicans now that they aren’t going to be able to use inflation as a campaign issue next year.
Yavin4
(37,182 posts)...if you're a Republican. They are depending on a massive recession to help boost their electoral chances next year.
BumRushDaShow
(172,814 posts)them to double down on trying to generate one. They tried with the debt ceiling and that got thwarted. The Saudis have been threatening (and so far have interestingly been on their own as of the last meeting) to force higher oil prices through major production cuts (although the U.S. production has been at or has exceeded what they produced in recent years) and (as of 9:31 am EDT)...


SleeplessinSoCal
(10,443 posts)...by the supply chain and the economy. Since 2021 he's been saying he'd like to sell the business and retire, but can't because of (ever looming) recession.
What are the odds on recession today?

Bengus81
(10,445 posts)Nah....he wants his billionaire banker buds to keep screwing Americans as long as possible. Plus doing so helps Biden and his Presidential run.
roamer65
(37,975 posts)Right now I expect they will pause.
BumRushDaShow
(172,814 posts)that for much of the time we have been alive, the rates were never "zero" (or near that) for any extended amount of time. The fact that they were taken there at the beginning of the "Great Recession" in 2007, and held there for almost a decade before they started easing them up again during 45's first couple years until the pandemic hit, and then dropped them back down again, was truly an aberration.
(below graph of fed funds rates from 1954 to date as of June 9, 2023, with the current circled in red and the "flat-line" in green, from here - https://www.macrotrends.net/2015/fed-funds-rate-historical-chart)

You can even go back (over) 110 years when the Federal Reserve was created, to see that the rates never got as low as they did in 2008 through to about 2018 -
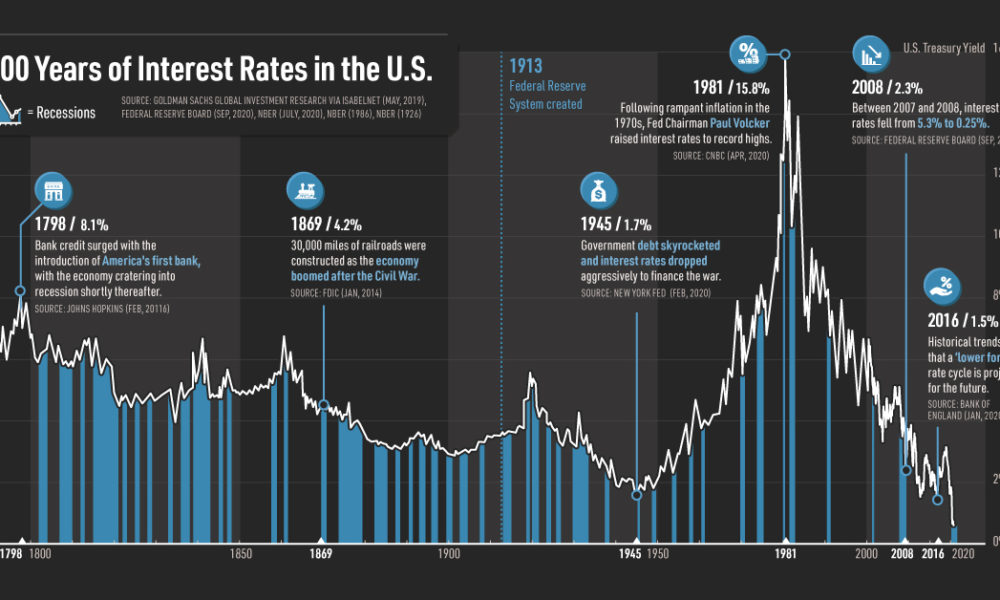
(I know... geeky stuff )

IronLionZion
(51,630 posts)Gas prices are lower than last year but they still complain about that
mahatmakanejeeves
(71,236 posts)Link to tweet
IronLionZion
(51,630 posts)
BumRushDaShow
(172,814 posts)years ago, my mother used to watch both Maria (when she was on CNBC) and Lou Dobbs (when he was on CNN) before they both drank the Koolaid and went RW loon.
This was after years of watching the "masters" - the Rukeysers (Louis and his dad Merryle when "dad" was on) and the PBS show "Wall Street Week".

Mysterian
(6,688 posts)I'm glad we have intelligent adults in charge.
LetMyPeopleVote
(183,140 posts)onetexan
(13,913 posts)


mathematic
(1,618 posts)Just wait until he fixes corporate greed more next month when headline inflation drops off that giant 1.2% monthly # from last June. 2.9% yoy inflation is going to look really good. (Realistically, we'll likely hover in the low 3% range for a long time due to low monthly inflation #s from last july & august and continued elevated core cpi now).
LetMyPeopleVote
(183,140 posts)DENVERPOPS
(13,003 posts)that the Corporations have ALREADY raised prices to such an insane level, that even if they stop now, the prices they are all charging will continue to guarantee corporations record profits for years to come.
I guess the corporations have all been thinking for the past two years, that they better get, while the getting is good.........
AND blaming Biden for it is an extra political bonus to them..............
LetMyPeopleVote
(183,140 posts)Link to tweet
Democrats NEVER tout our accomplishments enough. Let’s blast this to space:
Annual inflation has been falling for 11 months—and is less than half what it was last June.
And that’s the tip of the iceberg:
-Gas prices are down about $1.40 from their peak after Putin’s war.
-Energy prices fell 11% over the last year.
-Grocery prices are trending down—egg prices down nearly 30% since January.
-More than 13 million jobs have been created and unemployment has been under 4% for 16 months.
The reason you don’t hear Republicans talking about the economy anymore is because of the amazing progress.
While President Biden has undeniably lowered costs for families, MAGA Republicans are in over drive trying to destroy America’s progress.
They continue to serve special interests and big corporations that would increase the debt by hundreds of billions. They continue to call for even MORE tax cuts for the super rich.
But here’s the best part.
THEY are failing.
Let’s ruin Kevin McCarthy’s day. Smash the 💙 and RT if you trust Democrats and President Biden to keep making historic progress on our economy and NOT MAGA traitors like Kevin McCarthy!

BWdem4life
(3,118 posts)When the goal is 2% and wages never seem to keep up. But at least it’s headed in the right direction so yes, that at least is good news. Inflation will kill chances of a second presidential term faster than anything - just ask Jimmy Carter. And it doesn’t really matter that it’s not Biden’s fault.