Inflation falls 0.1% in June from prior month, helping case for lower rates
Source: CNBC
Published Thu, Jul 11 2024 8:32 AM EDT Updated 14 Min Ago
The monthly inflation rate dipped in June, providing further cover for the Federal Reserve to start lowering interest rates later this year.
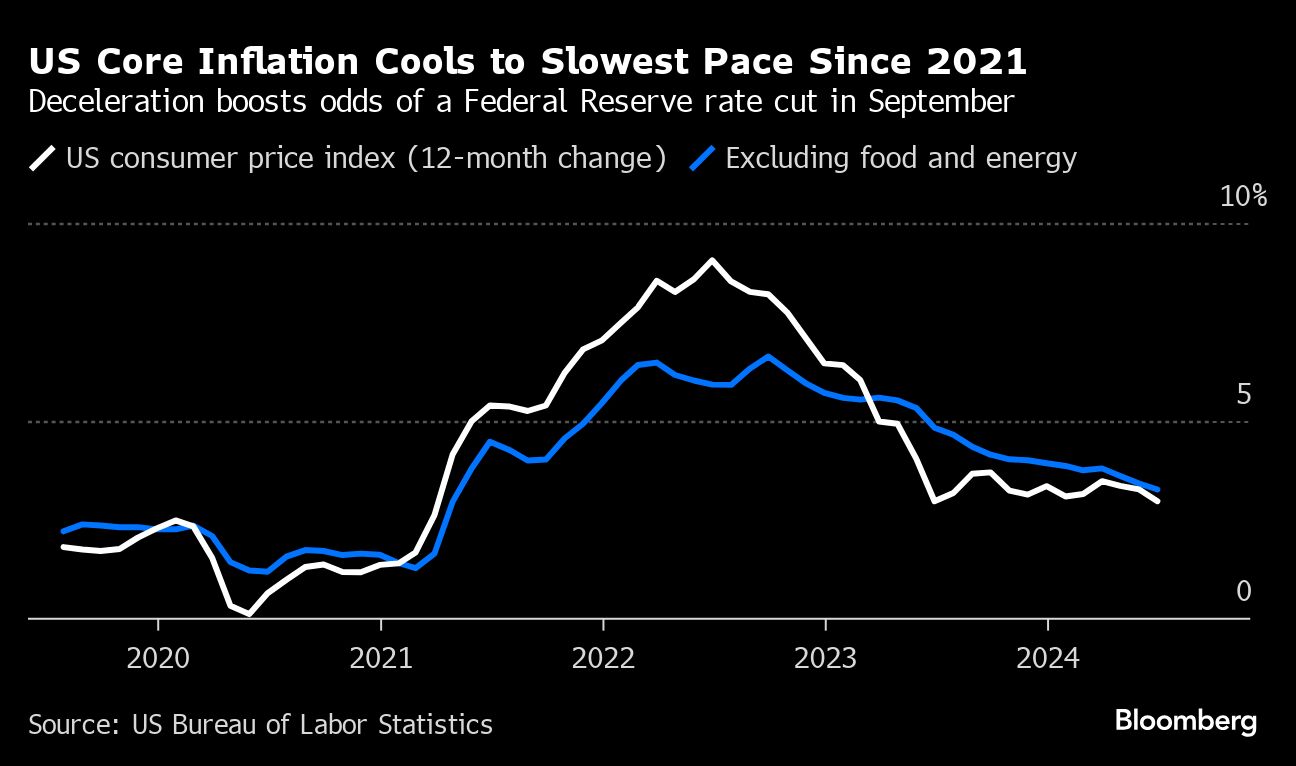
The consumer price index, a broad measure of costs for goods and services across the U.S. economy, declined 0.1% from May, putting the 12-month rate at 3%, around its lowest level in more than three years, the Labor Department reported Thursday. The all-items index rate fell from 3.3% in May, when it was flat on a monthly basis.

Excluding volatile food and energy costs, so-called core CPI increased 0.1 % monthly and 3.3% from a year ago, compared to respective forecasts for 0.2% and 3.4%, according to the report from the Bureau of Labor Statistics. The annual increase for the core rate was the smallest since April 2021.
A 3.8% slide in gasoline prices held back inflation for the month, offsetting 0.2% increases in both food prices and shelter. Housing-related costs have been one of the most stubborn components of inflation and make up about one-third of the weighting in the CPI, so a pullback in the rate of increase is another positive sign.

Read more: https://www.cnbc.com/2024/07/11/cpi-inflation-report-june-2024.html
From the source -
Link to tweet
@BLS_gov
·
Follow
CPI for all items falls 0.1 percent in June; gasoline down https://bls.gov/news.release/cpi.nr0.htm
#CPI #BLSdata
8:34 AM · Jul 11, 2024
Article updated.
Original article -
The monthly inflation rate dipped in June, providing further cover for the Federal Reserve to start lowering interest rates later this year.
The consumer price index, a broad measure of costs for goods and services across the U.S. economy, declined 0.1 from May, putting the 12-month rate at 3%, around its lowest level in more than three years, the Labor Department reported Wednesday.
Excluding volatile food and energy costs, so-called core CPI increased 0.1 % monthly and 3.3% from a year ago, compared to respective forecasts for 0.2% and 3.4%, according to the report from the Bureau of Labor Statistics.
This is breaking news. Please refresh for updates.
 = new reply since forum marked as read
Highlight:
NoneDon't highlight anything
5 newestHighlight 5 most recent replies
= new reply since forum marked as read
Highlight:
NoneDon't highlight anything
5 newestHighlight 5 most recent replies
Walleye
(45,836 posts)
gab13by13
(33,078 posts)What is worrisome to me are the comments that came from Nancy Pelosi and David Plouffe.

Bengus81
(10,586 posts)Does that ever sound familiar from 2016.
Walleye
(45,836 posts)I smell Roger Stone’s dirty fingers in this mess.
gab13by13
(33,078 posts)we shall see whether Jerome lowers rates pre-election or after election.

jayschool2013
(2,611 posts)
NoMoreRepugs
(12,326 posts)This is a tremendous counter IMO to the pearl clutching cries for “Someone other than Joe” whiny Bitch crowd.

mahatmakanejeeves
(71,590 posts)Inflation eased further in June, helping cement path to rate cuts
Fed watchers increasingly think a first cut could come in September -- so long as the data continues to cooperate.
By Rachel Siegel
Updated July 11, 2024 at 8:50 a.m. EDT | Published July 11, 2024 at 8:33 a.m. EDT
Inflation eased more than expected in June, handing Federal Reserve officials another dose of encouraging data as they inch closer to cutting interest rates and giving long-awaited relief to households and businesses.
Data released Thursday by the Bureau of Labor Statistics showed prices climbed 3 percent compared with last year, an improvement from the 3.3 percent annual figure notched in May. Prices also fell 0.1 percent over the previous month.
Additionally, a key measure of inflation that strips out more volatile categories like food and energy, rose 3.3 percent over the last 12 months — the smallest annual increase since April 2021.
{snip chart}
Policymakers have been waiting to cement their confidence that inflation is gradually easing, and the latest snapshot could put central bankers on track to trim interest rates at their mid-September policy meeting.
{snip}
By Rachel Siegel
Rachel Siegel is an economics reporter covering the Federal Reserve. She previously covered breaking news for the Post's financial section and local politics for the Post's Metro desk. Before joining the Post in June 2017, Rachel contributed to The Marshall Project and The Dallas Morning News. Twitter https://twitter.com/rachsieg
progree
(13,113 posts)As always, I've been seeing some mischaracterizations of the recent inflation situation in the media, so here is a summary table followed by the graphs.
I annualize them all to be easy to compare to each other, and to compare to the FED's 2% goal. I use the actual index values rather than the one-digit changes that are commonly reported in the media. Links to the data are with the graphs.
ALL the numbers are the seasonally adjusted ones
The "1 month" number is the change from April to May expressed as an annualized number.
The "3 month" number is the growth over the last 3 months (and then annualized). It is calculated based on the change in the index number between the latest one and the one 3 months previous. e.g. if the latest index value is 304 and the one 3 months previous is 300, then the 3 month increase is 1.333333%
. . . (304/300 = 1.01333333 => [subtract 1 and multiply by 100%] => 1.333333%)
Annualized, it is 5.4%
. . . (1.01333333^4 = 1.0544095 => [subtract 1 and multiply by 100%] => 5.44095% => 5.4%).
. . . Most people just multiply the 3 month increase by 4 to annualize it: 1.333333%*4 = 5.333333% => 5.3% which isn''t technically correct (it leaves out compounding) but it is close for small percentage changes.
"Regular" is the "headline" number that has "everything"
"Core" is the regular with food and energy removed (The Fed prefers this as a basis for projecting FUTURE inflation)
Finally, the main summary table
All are seasonally adjusted and ANNUALIZED
PCE-Personal Consumption Expenditures Price Index (Fed's favorite inflation measure)
CPI-Consumer Price Index (retail)
PPI-Producer Price Index (Wholesale prices)
Links to the data are with the graphs below

***NOTE: The new PPI (wholesale inflation) comes out tomorrow, 7/12/24 *******
Average real (i.e. inflation-adjusted) hourly earnings are up over the past 2 years and are above the pre-pandemic level:
. . . # Real average hourly earnings of production and non-supervisory workers: https://data.bls.gov/timeseries/CES0500000032
. . . # Real average hourly earnings of private sector workers: https://data.bls.gov/timeseries/CES0500000013
And now the graphs, in the following order:
* Core CPI and Regular CPI
* Core PCE and Regular PCE (Core PCE is the Fed's favorite for projecting FUTURE inflation)
* Wholesale inflation - Core PPI and Regular PPI
CORE CPI through June that came out 7/11/24
CORE CPI (seasonally adjusted) http://data.bls.gov/timeseries/CUSR0000SA0L1E
BLS CPI news release: https://www.bls.gov/news.release/cpi.nr0.htm

The Regular aka Headline CPI through June that came out 7/11/24
Regular CPI (seasonally adjusted) https://data.bls.gov/timeseries/CUSR0000SA0
BLS CPI news release: https://www.bls.gov/news.release/cpi.nr0.htm

Some Additional CPI Series of Interest
Shelter, which is pretty much all rent -- either regular rent or "owners' equivalent rent", has been a problematic issue -- because changes in new rents take several months before they appreciably move the CPI (because of the inertia of 11 months of older rents). It is the largest component of the Core CPI and one of the largest of the regular CPI. Through May, shelter remained elevated at 0.4% month over month for several months. Fortunately, in June it fell to a 0.2% increase. Year-over-year, shelter is up 5.1%
Shelter: https://data.bls.gov/timeseries/CUSR0000SAH1
Core Inflation less Shelter: https://data.bls.gov/timeseries/CUSR0000SA0L12E
^--This is up 0.0% for a 2nd month in a row, and a 3 month annualized average of +0.8% (compare to core of +2.1%)
Click on "More Formatting Options" on the upper right hand of screen, and on the page that appears, choose some or all of: "1-Month Percent Change", "3-Month Percent Change" and "12-Month Percent Change".
CORE PCE through MAY that came out 6/28/24
CORE PCE (seasonally adjusted): https://fred.stlouisfed.org/series/PCEPILFE
BEA.gov News release: https://www.bea.gov/ and click on "Personal Income and Outlays" or "Personal Income"
This is the one that the Fed weighs most heavily. The Fed weigh the PCE more heavily than the CPI. And in both cases, they weigh the CORE measures higher than the regular headline measures for projecting FUTURE inflation

Regular PCE through MAY that came out 6/28/24
Regular PCE (seasonally adjusted): https://fred.stlouisfed.org/series/PCEPI
BEA.gov News release: https://www.bea.gov/ and click on "Personal Income and Outlays" or "Personal Income"

WHOLESALE INFLATION (PPI - the Producer Price Index)
https://www.bls.gov/news.release/ppi.nr0.htm
As for which core PPI measure, since the BLS highlights the one below in its reporting (as opposed to the one without food and energy), then I guess I should do likewise.
CORE PPI (excluding food, energy, trade services) through May that came out 6/13/24:
CORE PPI (seasonally adjusted) http://data.bls.gov/timeseries/WPSFD49116

===========================================================
Regular PPI through May that came out 6/13/24 ( includes "everything" ):
Regular PPI (seasonally adjusted) http://data.bls.gov/timeseries/WPSFD4

***NOTE: The new PPI (wholesale inflation) comes out tomorrow, 7/12/24 *******
FloridaBlues
(4,694 posts)
IronLionZion
(51,715 posts)it's working well for America. More voters need to understand this.
LetMyPeopleVote
(184,000 posts)
Wicked Blue
(9,096 posts)They don't give a crap about inflation.
The Fed just dances to the oligarchy's tune
ScratchCat
(2,753 posts)The immediate jacking-up of the discount rate was 100% intended to make working Americans think that Joe Biden made prices go up right after they had "rigged" the economy for the past four years to make it look like Trump had done something.
They knew exactly what they were doing.
progree
(13,113 posts)Last edited Sat Jul 13, 2024, 07:51 AM - Edit history (6)

Blue: CPI, Red: Fed Funds Target Rate
November 2019 - June 2024
It used to be that most here were blaming the Fed for stupidly believing that inflation was transient and taking way too long to raise rates to bring it down. Kinda looks that way. The first tentative little quarter point rate increase was March 17, 2022, 14 months after year-over-year inflation went north of 2%, and had reached 8.5%.
Except I don't know about "stupidly" - for a while some were saying that the excess inflation was natural and healthy make-up for nearly a year of well below 2% inflation. And that a large part of it was a natural response to the economy opening up and recovering after the pandemic shutdowns, plus supply chain issues. All very reasonable, but went well past their "best used by" date.
CPI: https://data.bls.gov/timeseries/CUSR0000SA0
FedFunds Target Rate (I used the upper end of the 0.25% width bracket): https://www.federalreserve.gov/monetarypolicy/openmarket.htm
Here's the same graph, but I added the rolling 3 month average CPI (thin blue line) to it:

November 2019 - June 2024
I'm fond of the 3 month averages as they are an average of 3 data points (so can't be easily dismissed as a "one off", unlike a single month-over-month figure), and they have much more recency than 12 month averages (yoy). I think of them as kinda a smoothed version of month-to-month.
CPI vs. Core CPI since 2019:
Bengus81
(10,586 posts)Powell needs to be the first person Biden FIRES in Jan 2025.
If Fat HITLER does take office the interest rates start dropping like a rock on Feb 1st. Bank on it..........