Environment & Energy
Related: About this forumThe Energy Return of Solar PV
This is a link to a blog post by Euan Mearns (with a very long comment thread), in which he discusses a days-old paper on the full-system ERoEI of PV panels when used in temperate climates.
A new study by Ferroni and Hopkirk [1] estimates the ERoEI of temperate latitude solar photovoltaic (PV) systems to be 0.83. If correct, that means more energy is used to make the PV panels than will ever be recovered from them during their 25 year lifetime. A PV panel will produce more CO2 than if coal were simply used directly to make electricity. Worse than that, all the CO2 from PV production is in the atmosphere today, while burning coal to make electricity, the emissions would be spread over the 25 year period.
So what is ERoEI? It is simply the ratio of energy gathered to the amount of energy used to gather the energy (the energy invested): ERoEI = energy gathered / energy invested
Simple, isn’t it? Well it’s not quite so simple as it appears at first sight. For example, using PV to illustrate the point, the energy gathered will depend on latitude, the amount of sunshine, the orientation of the panels and also on the lifetime of the panels themselves. And how do you record or measure the energy invested? Do you simply measure the electricity used at the PV factory, or do you include the energy consumed by the workers and the miners who mined the silicon and the coal that is used to make the electricity? Ferroni and Hopkirk go into all of these details and come up with an ERoEI for temperate latitude solar PV of 0.83. At this level, solar PV is not an energy source but is an energy sink.
The related concept of net energy is defined as: Net Energy = ERoEI – 1 (where 1 is the energy invested)
Net energy is the surplus energy left over from our energy gathering activities that is used to power society – build hospitals, schools, aircraft carriers and to grow food. In the past the ERoEI of our primary energy sources – oil, gas and coal – was so high, probably over 50, that there was bucket loads of cheap energy left over to build all the infrastructure and to feed all the people that now inhabit The Earth. But with the net energy equation for solar PV looking like this:
0.83-1 = -0.17
….. Brussels we have a problem!
Mearns details Ferroni and Hopkirk's methodology, and has minor quibbles with parts of it. But overall he thinks they did a very respectable job. Their number compares appropriately to Prieto and Hall's earlier assessment of an ERoEI around 2. Mearns explains why their number is lower (mainly due to them examining temperate latitudes, if I understand it correctly.)
Yes, it's just one study. But if they are even close to right, there is no way that solar PV is a contender for the salvation of modern civilization. At best it's a niche player, at worst a harmful pipe dream.
Here is a link to a copy of the paper, for those who want a closer look:
https://collapseofindustrialcivilization.files.wordpress.com/2016/05/ferroni-y-hopkirk-2016-energy-return-on-energy-invested-eroei-for-photo.pdf
 = new reply since forum marked as read
Highlight:
NoneDon't highlight anything
5 newestHighlight 5 most recent replies
= new reply since forum marked as read
Highlight:
NoneDon't highlight anything
5 newestHighlight 5 most recent replies

cantbeserious
(13,039 posts)eom
GliderGuider
(21,088 posts)Like Ugo Bardi's calculated cost of a full renewable energy transition that I posted about yesterday.
It's
Not
Going
To
Happen.
If the physics doesn't kill it, the economics will.
If the economics don't, the politics will.
If the politics don't, the logistics will.
But it looks like climate change is going to get us first in any event.
Ghost Dog
(16,881 posts)to require less (wasted) energy, and encourage greater humanity, for a start.
TheProgressive
(1,656 posts)
Finishline42
(1,161 posts)How can any study that zero's out a PV system's value in 25 years when they come with a 25 yr warranty that guarantees 80% output at the end of the 25 yrs be valid? They lose approx .5% per year. It's a linear degradation so at 50 years output still should be 60% of rated output.
GliderGuider
(21,088 posts)It's not that the panels' output declines to 0, it's that the panels don't tend to last quite as long as claimed.
Finishline42
(1,161 posts)There's another possibility...
That newer panels have advantages over older panels - mainly higher output which has shown a steady increase over the last 20 years. That means of course that if you have a limited amount of space you would replace the ones that paid for themselves in 10 years with the latest model. Kind of like people do with cars. Which brings me to the term 'scrapage age'. What evidence is there that the panels were actually scraped? If they still were producing electricity then they were probably re-tasked - maybe donated to a local non-profit for instance?
Finishline42
(1,161 posts)Here's an article on the recycling of PV panels.
http://www.energymatters.com.au/renewable-news/em3001/

Maury Markowitx
(1 post)There is so much bologna on both sides of the renewables debate that you need to check any article you see with weird results with a fine tooth comb. I did:
https://matter2energy.wordpress.com/2016/05/17/another-pv-eroei-debacle/
Basically if you just replace their numbers with ones from industry standard sources, the EROEI is positive for sure, and varies from just over 1 to as high as 2.8.

OKIsItJustMe
(21,724 posts)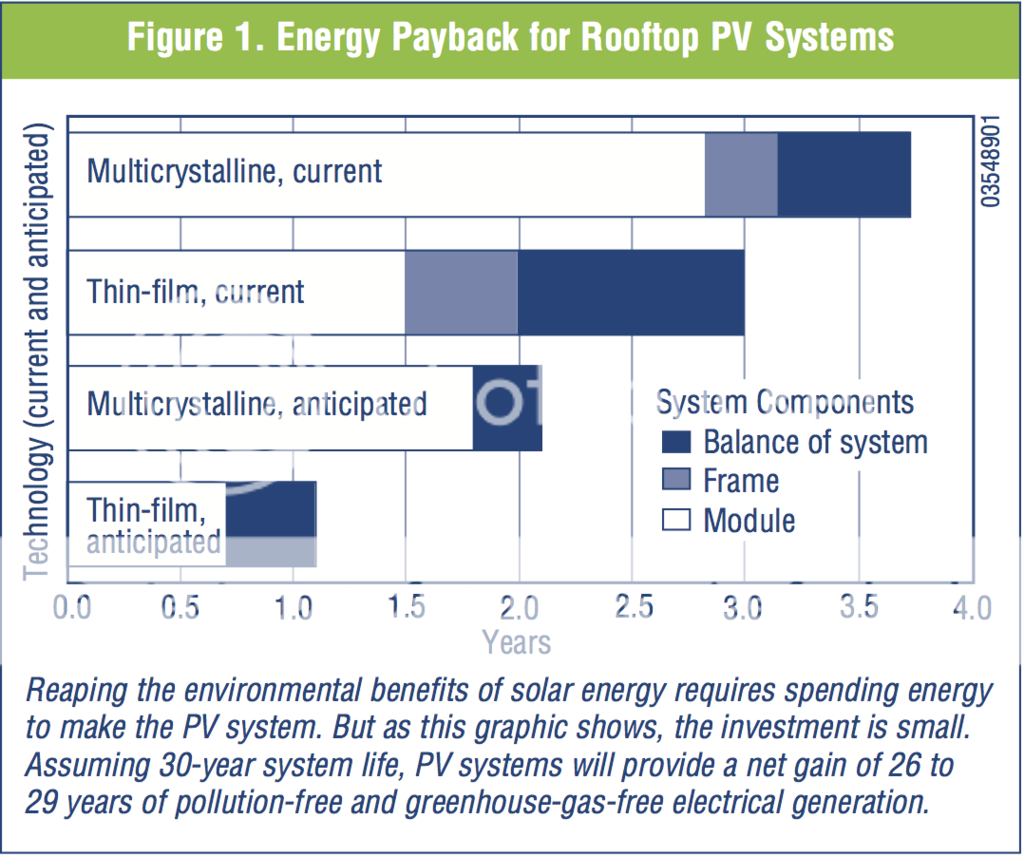

OKIsItJustMe
(21,724 posts)For example, check out their logic in determining panel lifetimes…
If the system lifetime were 30, or 25 years the quantity of dismantled modules (Table 1) should be practically zero, since by the year 1985 or 1990 (30 or 25 years ago) practically no PV systems had been installed. Now, at the end of 2015, modules corresponding to some 53 MWp , the peak power capacity installed by 1998, a time between 17 and 18 years ago, have already been dismantled. Therefore, the average lifetime could be said to be nearer to 17 than to 30 years, due to the fact that the quantity of treated material by the end of 2015 (7637 t) corresponds to the capacity installed by 1998. In more recent years the quantity of new installations has increased very sharply and quality of installation design and building may be improving, or may have improved, but an extended lifetime remains to be demonstrated.
…
True. We won’t know for certain that today’s panels will last… say… 30 years, until 30 years have passed. Well, unless we trust accelerated testing that is…
http://solarabcs.org/about/publications/reports/acceleratedtesting/index.html
Or, I suppose we could actually do some careful analysis.
NREL has a helpful analysis of degradation rates of panels: http://www.nrel.gov/docs/fy12osti/51664.pdf
…
June 2012
…
[font size=4]1. Introduction[/font]
The ability to accurately predict power delivery over the course of time is of vital importance to the growth of the photovoltaic (PV) industry. Two key cost drivers are the efficiency with which sunlight is converted into power and how this relationship changes over time. An accurate quantification of power decline over time, also known as degradation rate, is essential to all stakeholders—utility companies, integrators, investors, and researchers alike. Financially, degradation of a PV module or system is equally important, because a higher degradation rate translates directly into less power produced and, therefore, reduces future cash flows [1]. Furthermore, inaccuracies in determined degradation rates lead directly to increased financial risk [2]. Technically, degradation mechanisms are important to understand because they may eventually lead to failure [3]. Typically, a 20% decline is considered a failure, but there is no consensus on the definition of failure, because a high-efficiency module degraded by 50% may still have a higher efficiency than a non-degraded module from a less efficient technology. The identification of the underlying degradation mechanism through experiments and modeling can lead directly to lifetime improvements. Outdoor field testing has played a vital role in quantifying long-term behavior and lifetime for at least two reasons: it is the typical operating environment for PV systems, and it is the only way to correlate indoor accelerated testing to outdoor results to forecast field performance.
Although every reference included in this paper contains a brief to slightly extensive summary of degradation rate literature, a comprehensive review could not be found. This article aims to provide such a summary by reviewing degradation rates reported globally from field testing throughout the last 40 years. After a brief historical outline, it presents a synopsis of reported degradation rates to identify statistically significant trends. Although this review is intended to be comprehensive, it is possible that a small percentage of the literature may not have been included.
…
[font size=4]Conclusion[/font]
A history of degradation rates using field tests reported in the literature during the last 40 years has been summarized. Nearly 2000 degradation rates, measured on individual modules or entire systems, have been assembled from the literature and show a mean degradation rate of 0·8%/year and a median value of 0·5%/year. The majority, 78% of all data, reported a degradation rate of <1%/year. Thin-film degradation rates have improved significantly during the last decade, although they are statistically closer to 1%/year than to the 0·5%/year necessary to meet the 25- year commercial warranties. The significant difference between module and system degradation rates observed early on has narrowed, implying that substantial improvement toward the stability of the balance-of-system components has been achieved.
…
OKIsItJustMe
(21,724 posts)To Produce the Energy Used?[/font]
By Vasilis Fthenakis
[font size=3]In the July 2011 PE magazine article “Why We Need Rational Selection of Energy Projects,” the author stated that “photovoltaic electricity generation cannot be an energy source for the future” because photovoltaics require more energy than they produce (during their lifetime), thus their “Energy Return Ratio (ERR) is less than 1:1.” Statements to this effect were not uncommon in the 1980s, based on some early PV prototypes. However, today’s PVs return far more energy than that embodied in the life cycle of a solar system (see Figure 1).
Their energy payback times (EPBT)—the time it takes to produce all the energy used in their life cycles—currently are between six months to two years, depending on the location/solar irradiation and the technology. And with expected life times of 30 years, their ERRs are in the range of 60:1 to 15:1, depending on the location and the technology, thus returning 15 to 60 times more energy than the energy they use. Here is a basic tutorial on the subject.
Life Cycle of PV and
Energy Payback Times
The life cycle of photovoltaics starts from the extraction of raw materials (cradle) and ends with the disposal (grave) or recycling and recovery (cradle) of the PV components (Figure 2). The mining of raw materials such as quartz sand for silicon PVs, and copper, zinc, and aluminum ores for mounting structures and thin-film semiconductors, is followed by separation and purification stages. The silica in the quartz sand is reduced in an arc furnace to metallurgical-grade silicon, which must be purified further into solar-grade silicon (i.e., 99.9999% purity), requiring significant amounts of energy. Metal-grade cadmium and tellurium for CdTe PV is primarily obtained as a byproduct of zinc and copper smelters, respectively, and further purification is required for solar-grade purity. Similarly, metals used in CIGS PV are recovered as byproducts: indium and gallium are byproducts of zinc mining, while selenium is mostly recovered from copper production.
The raw materials include those for encapsulations and balance-of-system components, for example, silica for glass, copper ore for cables, and iron and zinc ores for mounting structures. Significant amounts of energy are required for the production, processing, and purification of all these materials, as well as for the manufacturing of the solar cells, modules, electronics, and structures, and for the installation, sometimes the operation, and eventually the dismantling and recycling or disposal of the system components. Thus, the EPBT is defined as the period required for a renewable energy system to generate the same amount of energy (in terms of primary energy equivalence) that was used to produce the system itself.
…[/font][/font]