Environment & Energy
Related: About this forumThe Record April Graph, The Record CO2 Graph, And More Really Fucked Up Record Shit
It’s not just that we’re seeing record global heat. It’s that 2016’s jump in global temperatures may be the biggest single-year spike ever recorded. It’s that the world may never again see annual temperatures below 1 C above preindustrial averages. And it’s that this high level of heat, and a related spiking of atmospheric greenhouse gasses due to fossil fuel emissions, is now enough to begin inflicting serious harm upon both the natural world and human civilization.
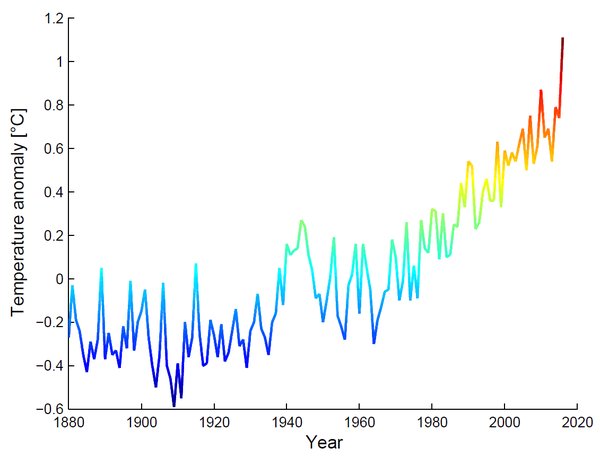
Last month was the hottest April in the global climate record. Not only was it the hottest such month ever recorded — it smashed the previous record by the largest margin ever recorded. And this April has now become the seventh month in a row in an unbroken chain of record global heat.
 ?w=833&h=635
(When graphed, this is what the hottest April on record looks like when compared to other Aprils. Note the sharp upward spike at the end of the long warming progression. Yeah, that’s for April of 2016. Image source: Dr. Stephan Rahmstorf. Data source: NASA GISS.)
r April of 2016. Image source: Dr. Stephan Rahmstorf. Data source: NASA GISS.)
According to NASA GISS, global temperatures in April were 1.11 degrees Celsius (C) hotter than its 20th Century baseline average. When compared to preindustrial readings (NASA 1880s), temperatures have globally heated by a total of +1.33 C. And that’s a really big jump in global heat, especially when one considers the context of the last seven months. When one looks at that, it appears that global temperatures are racing higher with a fearful speed.
About this raging pace of warming, Andy Pitman, director of the ARC Centre of Excellence for Climate System Science at the University of New South Wales in Australia recently noted in the Guardian:
“The interesting thing is the scale at which we’re breaking records. It’s clearly all heading in the wrong direction. Climate scientists have been warning about this since at least the 1980s. And it’s been bloody obvious since the 2000s.”
 ?w=900&h=537
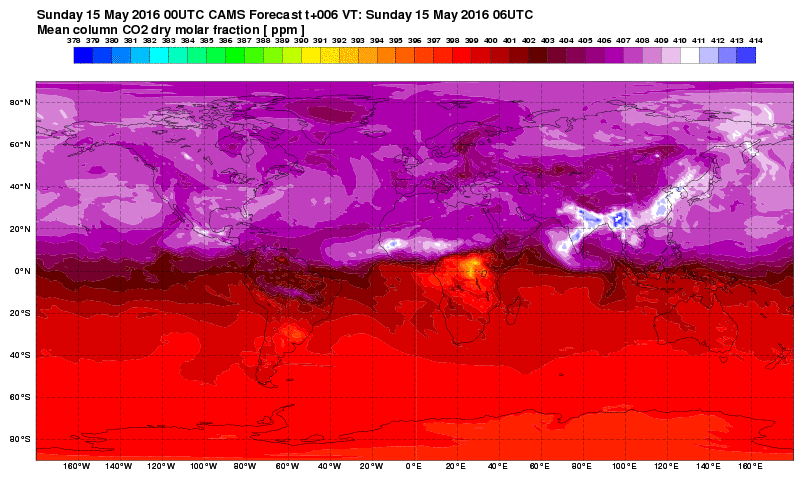
(Record atmospheric carbon dioxide levels, as seen in this Sunday May 15 Copernicus Observatory graphic, are the primary force driving an amazing spike in global temperatures during 2016. Image source: The Copernicus Observatory.)
Though 2016 is likely to be a record hot year, overall readings have moderated somewhat since earlier this year as El Nino has begun to fade. But that doesn’t mean we’re out of the danger zone. Quite to the contrary, we’re racing toward climate thresholds at a never-before-seen pace. And that’s really worrisome. Peak monthly readings this year hit a ridiculous +1.55 C above 1880s averages at the height of El Nino during February. And April’s current monthly record is now tied with January of 2016 in the NASA measure. In total, the first four months of 2016 now average +1.43 C above 1880s baselines or uncomfortably close to the +1.5 C mark established by scientists as the first of many increasingly dangerous climate thresholds.
EDIT
https://robertscribbler.com/2016/05/16/nasa-world-just-had-seven-months-straight-of-record-shattering-global-heat/
notemason
(572 posts)Maybe Meat Loaf had it right ![]()
