Environment & Energy
Related: About this forumMore of the 2016 disastrous CO2 climate year, May 29, 2016 4.16 ppm worse than May 31, 2015
I've taken it upon myself to report, whenever the weekly data for 2016 as compared to the same week of 2015 exceeds the unprecedented increase more than 4.00 ppm, of reporting this fact.
Of the approximately 2100 weekly year-to-year data points recorded since the 1970's before 2016 there were only 7 which were higher than 4.00 ppm, one in 2010, one in 2012, one in 2013, one in 2014, and three occurred in 1998, as a result, most probably, of the massive fires in Southeast Asia.
There are now fifteen such data points, with eight occurring this year, and, um, we're only halfway through it.
Some remarks from previous posts on 2016, which is rapidly shaping up as an unparalleled disaster for the accelerating accumulation of the dangerous fossil fuel waste carbon dioxide in the planetary atmosphere:
Right now, if trends continue, 2016 will blow that level away.
Something very, very, very, very disturbing is happening if the Mauna Loa observatory's CO2 measurements are correct.
For clarity, I will repeat some text from one of my earlier posts, showing how I store and analyze this data available from the Mauna Loa observatory's website's data tab:
The data goes back to 1974, and comprises 2,090 data points.
I import this data into a spreadsheet I maintain each week, and calculate the weekly increases over the previous year. I rank the data for the increases from worst to best, the worst data point being 4.67 ppm over the previous year, which was recorded during the week ending September 6, 1998, when much of the rain forest of Southeast Asia was burning when fires set to clear the forests for palm oil plantations got out of control during unusually dry weather. Six of the worst data points ever recorded occurred in 1998 during this event, another was recorded in the January following that event.
Of the twenty worst data points ever recorded out of 2090 two of them have occurred in the last four weeks. The week ending January 31, 2016 produced a result of a 4.35 ppm of increase. The week just passed, that ending, 2/14/2016, produced a result of 3.79 ppm increase, tying it for the aforementioned week in January 1999, that ending on January 24, 1999, and that of January 2, 2011.
Of the twenty highest points recorded, 9 have occurred in the last 5 years, 10 in the last 10 years.
It's looking very bad these last few weeks at the Mauna Loa carbon dioxide observatory.
The above comes from a post in this very, very, very depressing series on May 1 of this year: For April 2016, the average weekly increase in CO2 levels compared with April 2015 is 4.16 ppm
For the week ending May 29, 2016, the recorded increase over the same week of last year was 4.16 ppm. The data set now contains 2105 points; 4.16 ppm just 0.02 short of being the 10th worst ever; there were two data points at 4.17, one of which was recorded April 24th of this year. As it is, it is the 12th worst ever recorded. Thirteen of the worst 30 have been recorded in the last 5 years, 17 of the worst 30 have been recorded in the last 10 years. Twelve of the worst 30 occurred in 2016.
The average of all these data points recorded is 1.75 ppm; the average for the 20th century was 1.54 ppm; for the 21st century, it is 2.07 ppm, for 2015 - the worst year ever recorded - it was 2.25 ppm. For 2016, the average is now 3.54 ppm. Over the last 4 weeks the average is 3.99 ppm.
We hear very often from many people describing themselves as "environmentalists" that so called "renewable energy" will save the day. It isn't; it hasn't; and to be perfectly frank, it won't. This rhetoric has degenerated into an argument that the means are more important the ends.
So called "renewable energy" has failed, and failed spectacularly.
The world's largest, by far, source of climate change gas free primary energy is nuclear energy. You hear many people who describe themselves as "environmentalists" bad mouthing it, not only bad mouthing it, but actively working to destroy it. They are, in my opinion, working to destroy as rapidly as possible, the planetary atmosphere.
Kill the messenger if you will, but the signature of our policies is written clearly and unambiguously in the chemical analysis of the planetary gases. We are failing, not only ourselves, but all future generations.
Have a nice Sunday afternoon.

 = new reply since forum marked as read
Highlight:
NoneDon't highlight anything
5 newestHighlight 5 most recent replies
= new reply since forum marked as read
Highlight:
NoneDon't highlight anything
5 newestHighlight 5 most recent replies
StarTrombone
(188 posts)To cut CO2 pollution, experts argue for nuclear power
By Umair Irfan, ClimateWire on June 3, 2016
CALLAWAY COUNTY, Mo.—The 31-year-old Callaway Energy Center is doing some heavy lifting.
Missouri’s lone nuclear power plant produces 11.7 percent of the state’s electricity from one reactor cranking out 1.2 gigawatts, making it the third-largest electricity producer in the state. Its 553-foot-tall, cloud-spewing cooling tower is the second-tallest structure in Missouri behind the St. Louis Arch, two hours’ drive east.
“We are a baseload plant,” Cox says. “About 3,565 megawatts thermal and about 1,283 MW electric go out onto the grid. So it’s about 30 percent efficiency from what I have to produce inside the core from a heat point of view to what I get out on the electric grid, and that’s typical for all steam-producing plants.”
But Callaway really flexes its muscles when it comes to zero-carbon-emissions energy in a coal-heavy portfolio. Missouri gets 82 percent of its electricity from coal, and the recently bankrupt Peabody Energy Corp., the nation’s largest coal company, is based in St. Louis.
The U.S. Energy Information Administration reports that Missouri ranks 13th in total greenhouse gas emissions in the United States. Wind, solar, biomass and hydroelectric power provide the state with just 2.2 percent of its electricity. That means 83 percent of Missouri’s carbon-free energy comes from Callaway.
GliderGuider
(21,088 posts)The use of nuclear power may have allowed us to avoid about 10% of our CO2 emissions since 1965 (calculated on an end-use basis, with nuclear power displacing coal and gas use, but not oil.)
Or perhaps the use of nuclear power has just allowed the global economy to grow a bit faster. That growth may have offset any potential CO2 savings due to the increased consumption of fossil fuels associated with the growth (hello William Stanley Jevons...)
GliderGuider
(21,088 posts)Last edited Sun Jun 5, 2016, 12:39 PM - Edit history (1)
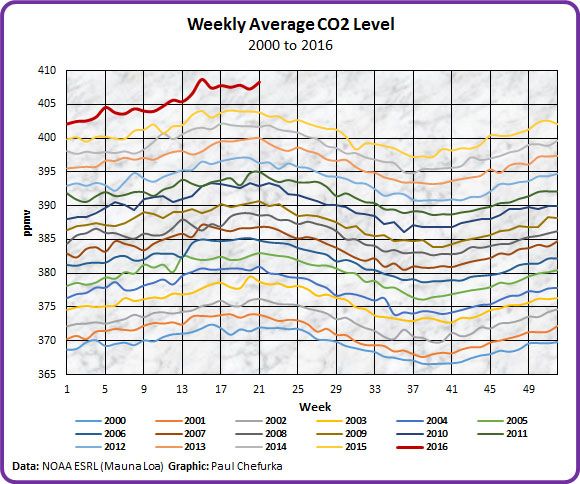
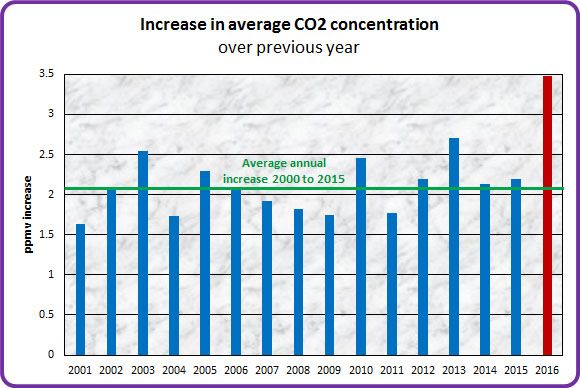
The fact that the increase from 2015 to 2016 is much greater than in any other successive years since 2000 is clearly visible.
In fact, the increase this year is 66% greater than the average annual increase from 2000 to 2015.