Welcome to DU!
The truly grassroots left-of-center political community where regular people, not algorithms, drive the discussions and set the standards.
Join the community:
Create a free account
Support DU (and get rid of ads!):
Become a Star Member
Latest Breaking News
Editorials & Other Articles
General Discussion
The DU Lounge
All Forums
Issue Forums
Culture Forums
Alliance Forums
Region Forums
Support Forums
Help & Search
Environment & Energy
Related: About this forumNOAA Regional Precipitation Ranking Maps For Trailing Year - Staggering
 ?w=543&h=396
Here in the midwest, spring planting is weeks behind schedule as water logged fields keep farmers from getting to work – and forecast is for yet another period of heavy rains in the offing. You’re not wrong. Heavy rains are coming more frequently.
Robert Scribbler blog:
According to reports from NOAA, the U.S. just saw its wettest 12 month period since record keeping began 124 years ago. The fact that this stretch of extremely wet weather was preceded by a time of extraordinary drought during the 2010s is also notable. Because it is exactly this kind of swing from one extreme to the next that you would expect in a world being forced to warm by fossil fuel burning.
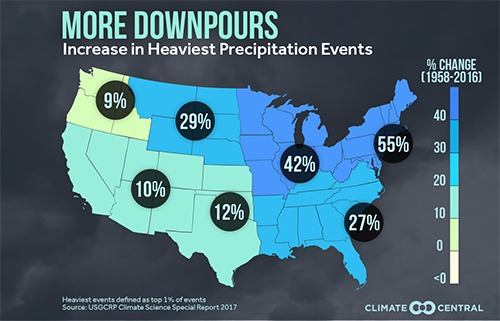
(Annual precipitation has increased by about 7 percent across the contiguous U.S. during the past Century. This jibes with our understanding of atmospheric physics in which the rate of evaporation and precipitation increase as the amount of atmospheric moisture climbs by 6-8 percent for each 1 degree C of global warming. It’s worth noting that though precipitation is increasing, it doesn’t mean that soils, in general, hold more moisture. This is due to the fact that rising temperatures also increase the rates at which soils dry. And because precipitation and drying are not spread evenly, you tend to get regions and times of preference for more intense storms or more intense drought.
….overall global surface warming in the range of 1.1 C is having the effect of amping up global evaporation and precipitation rates by 6-8 percent. In the U.S. this larger climate change influence helped to spur the multi-year droughts across the U.S. west as well as severe drought years for the Central and Eastern U.S.
On the flip side of the hydrological spectrum, warmer land surfaces and oceans have helped to fuel storms through increased evaporation of water moisture — pumping more water vapor into storms and enabling convection. For the past 12 months this has manifest in the form of the powerful and moisture-rich Hurricane Florence. It has also generally loaded the dice for powerful storms and flooding rains as a persistent trough swung over the Central and Eastern U.S. during spring of 2019.
 ?w=531&h=341
EDIT
https://climatecrocks.com/2019/05/18/april-showers-make-new-record/#comments

2 replies
 = new reply since forum marked as read
Highlight:
NoneDon't highlight anything
5 newestHighlight 5 most recent replies
= new reply since forum marked as read
Highlight:
NoneDon't highlight anything
5 newestHighlight 5 most recent replies
= new reply since forum marked as read
Highlight:
NoneDon't highlight anything
5 newestHighlight 5 most recent replies
NOAA Regional Precipitation Ranking Maps For Trailing Year - Staggering (Original Post)
hatrack
May 2019
OP

lapfog_1
(31,784 posts)1. warmer air holds more water
welcome to the new world... less snow and ice, more water in the form of rain...

corbettkroehler
(1,898 posts)2. 100% Irrelevant Because Facts Don't Matter
Let's not forget, climate change is a hoax.