Environment & Energy
Related: About this forumUpdate: New Weekly CO2 Concentration Record Set at the Mauna Loa Observatory, 422.89 ppm.
As I've indicated repeatedly in my DU writings, somewhat obsessively I keep a spreadsheet of the weekly data at the Mauna Loa Carbon Dioxide Observatory, which I use to do calculations to record the dying of our atmosphere, a triumph of fear, dogma and ignorance that did not have to be, but nonetheless is, a fact.
Facts matter.
When writing these depressing repeating posts about new records being set, reminiscent, over the years, to the ticking of a clock at a deathwatch, I often repeat some of the language from a previous post on this awful series, as I am doing here. It saves time.
Last year's record setting peak was 421.63 ppm, recorded in week 21 of 2022, the week beginning May 29, 2022.
As I've been reporting over the years in various contexts, the concentrations of the dangerous fossil fuel waste carbon dioxide which is killing the planet even as we carry on and on and on and on about things like Fukushima, which will not kill the planet, fluctuate sinusoidally over the year, with the rough sine wave superimposed on a quadratic axis:

Monthly Average Mauna Loa CO2
The previous use, from a few weeks, of the foregoing text is here: New Weekly CO2 Concentration Record Set at the Mauna Loa Observatory, 422.60 ppm.
Here's the new data:
Week beginning on April 09, 2023: 422.89 ppm
Weekly value from 1 year ago: 419.90 ppm
Weekly value from 10 years ago: 397.93 ppm
Last updated: April 17, 2023
Weekly average CO2 at Mauna Loa
The week to week comparison with the same week of 2022, week 14, an increase of 2.99 ppm, is the highest increase observed in 2023, otherwise a mild year, at least in weekly readings.
As I regularly note, there is generally a lot of noise in these measurements, as I've observed over many years of following these weekly readings, but generally the final annual peak is observed in late April to late May. Thus we may reasonably suspect this will not be the last record set this year.
I also provided this graph (now updated by the observatory for the current week) in the last post:
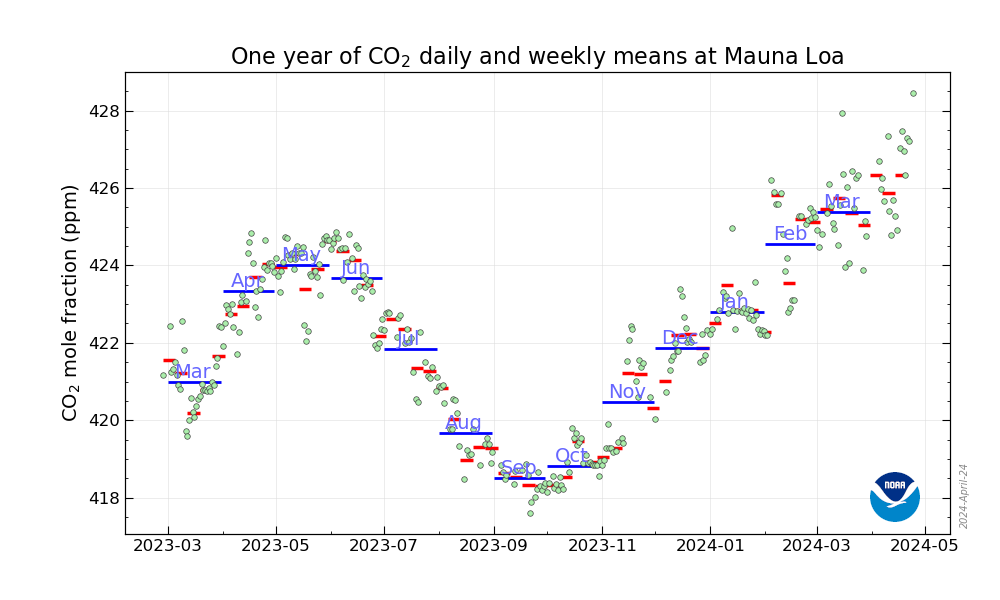
In the last several years, the shape of this particular (1 year) graph has begun to vary from a regular sinusoidal geometry, most probably because of emergent feedback loops as the climatic system enters freefall.
If you find any of this upsetting, don't worry, be happy. Pull out the old soothsayer's crystal ball and announce confidently that the world will be powered by 100% so called "renewable energy" "by (insert a year after you're likely to be dead here) and go on your merry way, carrying on, if you wish, about Apartheid Elon's magic Tesla batteries.
Half a century of such talk has done nothing to address climate change - the climate is degrading faster than ever - but chanting, I've heard, can be soothing in the face of disasters brought on by wishful thinking.
The Mauna Loa observatory began reporting these week to week comparisons in 1975, the week beginning May 25, 1975, a little less than half a century ago. The reading that week was 334.10 ppm, 88.54 ppm lower than last week.
History will not forgive us, nor should it.
Have a wonderful weekend.

 = new reply since forum marked as read
Highlight:
NoneDon't highlight anything
5 newestHighlight 5 most recent replies
= new reply since forum marked as read
Highlight:
NoneDon't highlight anything
5 newestHighlight 5 most recent replies

NNadir
(37,549 posts)The original post has been edited accordingly.
The updated weekly read is now 422.89 ppm, just shy of 3.00 ppm higher than the same week last year.
I've not seen this before, but it may be related to the move to Mauna Kea after the eruption of Mauna Loa, different equipment and operators.