Welcome to DU!
The truly grassroots left-of-center political community where regular people, not algorithms, drive the discussions and set the standards.
Join the community:
Create a free account
Support DU (and get rid of ads!):
Become a Star Member
Latest Breaking News
Editorials & Other Articles
General Discussion
The DU Lounge
All Forums
Issue Forums
Culture Forums
Alliance Forums
Region Forums
Support Forums
Help & Search
Environment & Energy
Related: About this forumJames Hansen et al. Groundhog Day. Another Gobsmackingly Bananas Month. What's Up?
http://www.columbia.edu/~jeh1/mailings/2024/Groundhog.04January2024.pdf
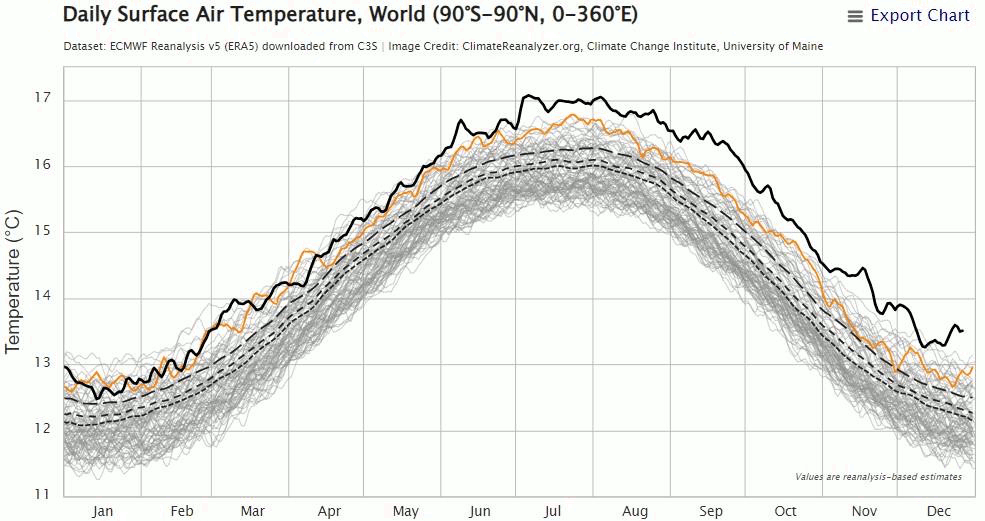
Fig. 1. Daily surface temperature analysis from the ECMWF reanalysis version 5 (ERA5).¹
04 January 2024
James Hansen, Makiko Sato, Pushker Kharecha
Abstract. December was the 7th consecutive month of record-shattering global temperature, driven by the combination of a moderately strong El Nino and a large decrease of Earth’s albedo. The El Nino will fade in the next few months, but we anticipate that the string of record monthly temperatures will continue to a total of 12 and possibly 13 months because of Earth’s unprecedented energy imbalance. By May the 12-month running-mean global temperature relative to 1880-1920 should be +1.6-1.7°C and not fall below +1.4 ± 0.1°C during the next La Nina minimum. Thus, given the planetary energy imbalance, it will be clear that the 1.5°C ceiling has been passed for all practical purposes.
Zeke Hausfather memorably termed the record September global temperature as “gobsmackingly bananas.” Subsequent monthly temperature anomalies have not been much smaller. These records coincide with a moderately strong El Nino, but they exceed expectations for even the strongest El Nino, if that were the only driving factor. Warming is also being driven by another factor, one that
Fig. 2. Global absorbed solar radiation (W/m² ) relative to mean of the first 120 months of CERES data. CERES data² are available at http://ceres.larc.nasa.gov/
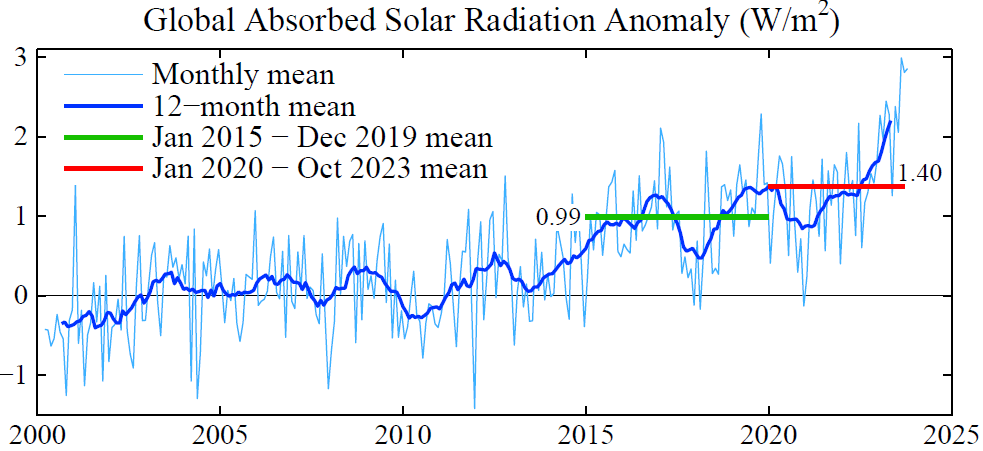
Fig. 3. 12-month running-mean of Earth’s energy imbalance from CERES satellite data normalized to 0.71 W/m² mean for July 2005 – June 2015 (blue bar) from in situ data.

is ultimately more consequential: a large decrease of Earth’s albedo. In other words, Earth has become darker, absorbing more of the sunlight incident on the planet (Fig. 2). The increase of absorbed solar radiation (1.4 W/m² ) is a decrease of Earth’s albedo (reflectivity) of 0.4% (1.4/340).³ This reduced albedo is equivalent to a sudden increase of atmospheric CO₂ from 420 to 530 ppm.
We conclude in our Pipeline paper⁴ that the decreased albedo is spurred by reduced atmospheric aerosols and enhanced by feedbacks. Given that NASA decided in the early 1990s⁵ not to make precise measurements of the global aerosol forcing and cloud feedbacks, we are faced with a difficult task of sorting out how much of the increased solar absorption is aerosol forcing and how much is from feedbacks. The two major feedbacks expected to darken Earth as the planet warms are reduced sea ice cover and reduced cloud cover. The recent spike of absorbed solar radiation to almost 3 W/m² (Fig. 2) may be related in part to the fact that it occurred during the season when solar insolation was rising in the region of Southern Hemisphere sea ice when sea ice cover was at its lowest point in the period of satellite data. Large variability of clouds, unforced and forced, complicates interpretation of anomalies, but spatial variations may help untangle the situation.
Feedbacks associated with ice melt are particularly important for reasons discussed in our Ice Melt paper⁶ (that’s the paper blackballed by IPCC because it disagrees with IPCC about the imminent threat of shutdown of the overturning ocean circulations and large sea level rise). We find in that paper that freshwater injection into the ocean mixed layer by melting polar ice is already a significant climate forcing that acts to slow down the production of deepwater in the North Atlantic and production of bottom water in the Southern Ocean.
…
¹ Daily Surface Air Temperature graph based on ERA5 available via Climate Reanalyzer, Climate Change Institute, University of Maine https://climatereanalyzer.org/wx/todays-weather/?var_id=t2&ortho=1&wt=1
² Loeb NG, Johnson GC, Thorsen, TJ et al. Satellite and ocean data reveal marked increase in Earth’s heating rate. Geophys Res Lett 2021;48:e2021GL09304
³ The average solar energy incident on Earth is about 340 W/m².
⁴ Hansen J, Sato M, Simons L et al. Global warming in the pipeline. Oxford Open Clim Chan 2023;3(1):kgad008, doi.org/10.1093/oxfclm/kgad008
⁵ Hansen J, Rosa W, Fung I. Long-term monitoring of global climate forcings and feedbacks. Washington: NASA Conference Publication 3234, 1993
⁶ Hansen J, Sato M, Hearty P et al. Ice melt, sea level rise and superstorms: evidence from paleoclimate data, climate modeling, and modern observations that 2 C global warming could be dangerous. Atmos Chem Phys2016;16:3761-812
…
1 replies
 = new reply since forum marked as read
Highlight:
NoneDon't highlight anything
5 newestHighlight 5 most recent replies
= new reply since forum marked as read
Highlight:
NoneDon't highlight anything
5 newestHighlight 5 most recent replies
= new reply since forum marked as read
Highlight:
NoneDon't highlight anything
5 newestHighlight 5 most recent replies
James Hansen et al. Groundhog Day. Another Gobsmackingly Bananas Month. What's Up? (Original Post)
OKIsItJustMe
Jan 2024
OP

OKIsItJustMe
(21,970 posts)1. ... the 1.5C ceiling has been passed for all practical purposes ...
I just wanted to emphasize that.
https://www.wbur.org/cognoscenti/2023/10/03/1-5-degrees-celcius-un-climate-change-report-barbara-moran
❝ I think that 1.5 C has moved from “ambitious goal” to “magical thinking.” And the scientists are telling themselves a story to stave off despair. ❞