Welcome to DU!
The truly grassroots left-of-center political community where regular people, not algorithms, drive the discussions and set the standards.
Join the community:
Create a free account
Support DU (and get rid of ads!):
Become a Star Member
Latest Breaking News
Editorials & Other Articles
General Discussion
The DU Lounge
All Forums
Issue Forums
Culture Forums
Alliance Forums
Region Forums
Support Forums
Help & Search
Gun Control & RKBA
Related: About this forumData and statistics on guns
In 2020, there were 45,222 deaths as a result of firearms.
53.7% were suicides – self-inflicted death by firearms is the most effective of any method, with a case fatality rate of 82.5%.
42.8% of deaths by firearms were due to homicide
The remaining 3.5% of deaths were accidental, police related, or undetermined
59% of US gun murders and non-negligent manslaughters were attributable to handguns. 1% involved shotguns, and 3% involved rifles that included assault weapons.
According to one study by the Bureau of Alcohol, Tobacco, Firearms, and Explosive (ATF) in 2000 looked at trafficked, illegal gun purchases.
41.3% were straw purchases from federally licensed dealers. A straw purchase is where “those who buy a gun, complete required paperwork, and undergo a background check on behalf of another, prohibited, person. They are illegal transactions concerning firearms.
27.3% were unlicensed sellers
17.7% were Illegally diverted by licensed dealers (6.3%), gun show sales (7.1%), and secondary markets (4.3%)
22.5% were stolen from dealers, residencies, and common carriers
The percentages do not reflect the number of guns trafficked [explain]. In terms of the number of firearms trafficked, the majority, 70%, consisted of
straw purchases 21%
illegal diversion by licensed dealers (including pawn brokers) 31%
gun show sales 17%.
A 2016 report of prisoners in both state and federal penitentiaries by the US Department of Justice on firearms used in the commission of a crime concluded:
6% were stolen
7% were found at the scene of the crime
43% obtained them off the street
25% got them from a family member or friend
7% had been purchased under “their own name from a licensed firearms dealer.”
6% were stolen
7% were found at the scene of the crime
43% obtained them off the street
25% got them from a family member or friend
7% had been purchased under “their own name from a licensed firearms dealer.”
https://www.acsh.org/news/2022/06/03/some-actual-data-guns-16346
3 replies
 = new reply since forum marked as read
Highlight:
NoneDon't highlight anything
5 newestHighlight 5 most recent replies
= new reply since forum marked as read
Highlight:
NoneDon't highlight anything
5 newestHighlight 5 most recent replies
= new reply since forum marked as read
Highlight:
NoneDon't highlight anything
5 newestHighlight 5 most recent replies
Data and statistics on guns (Original Post)
discntnt_irny_srcsm
Jun 2022
OP

krispos42
(49,445 posts)1. Oh, you and your statistics
Look, half the people here know the truthiness... that AR-15s kill far more people every year than covid-19 AND removing mattress tags COMBINED.
I mean, according to your "facts" 581 people are killed per year with rifles and that's just not true! Look at the media coverage! Since vastly more coverage is given to people murdered with AR-15 than people murdered with handguns, it's obvious your numbers are incorrect!

Actually...
59% of US gun murders and non-negligent manslaughters were attributable to handguns. 1% involved shotguns, and 3% involved rifles that included assault weapons.
means that 37% is unaccounted for.
Maybe they meant "murders" and not "gun murders"?
discntnt_irny_srcsm
(18,757 posts)2. I checked the CDC's database...
...WISQARS: https://www.cdc.gov/injury/wisqars/index.html
CDC says 79% of homicides during 2020 were caused by firearms. Those percentages don't add up.
A direct quote from Pew says:
In 2020, handguns were involved in 59% of the 13,620 U.S. gun murders and non-negligent manslaughters for which data is available, according to the FBI. Rifles – the category that includes guns sometimes referred to as “assault weapons” – were involved in 3% of firearm murders. Shotguns were involved in 1%. The remainder of gun homicides and non-negligent manslaughters (36%) involved other kinds of firearms or those classified as “type not stated.”
I've read elsewhere that a popular "murder bullet" is the 9 mm. Making a guess here but perhaps this data is incomplete because either the type of specific firearm wasn't known or wasn't recorded and 9 mm rounds are popular in both handguns and long guns making it difficult to be certain in cases where the actual weapon isn't recovered.

krispos42
(49,445 posts)3. That's what I got in my "consequeses of gun control" post
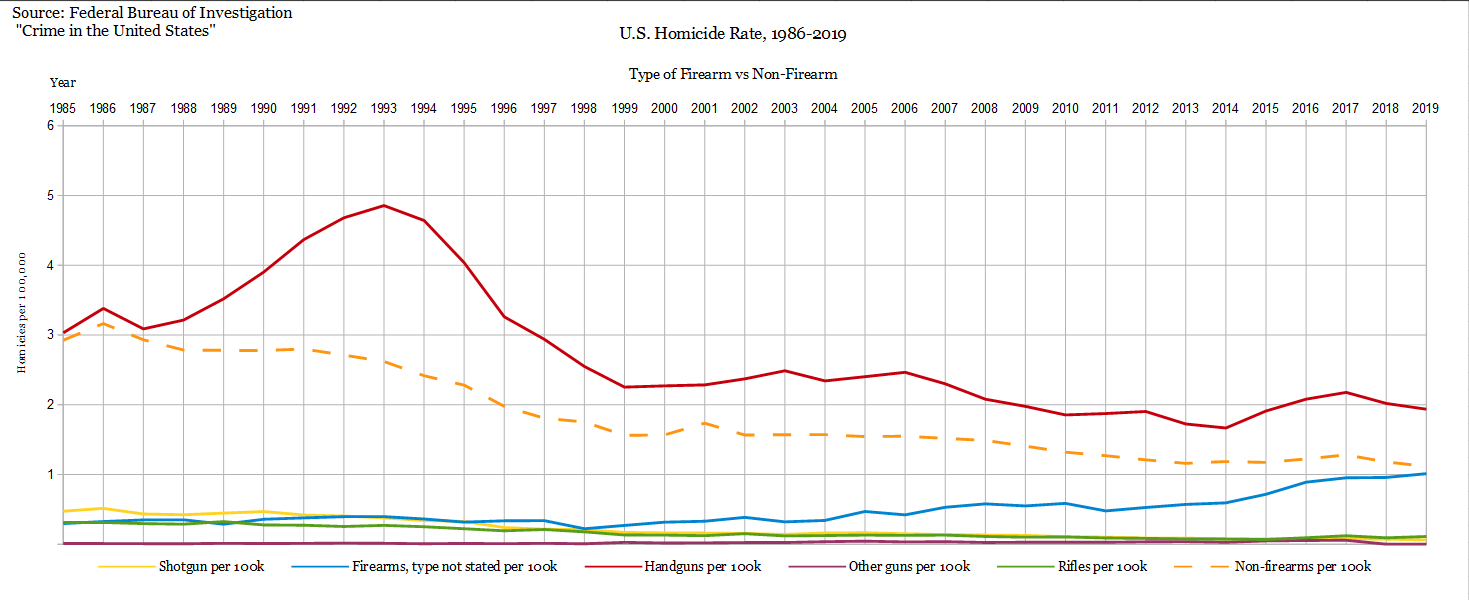
▼ Sixth, we have the homicide rate with various methods of homicide. This is a little harder to parse, as there is an increasing percentage of "Firearm, type not stated" over time. I don't know why this is. But we can see the single biggest tool used in homicide is the handgun, while rifles (a percentage of which are "assault weapons" by one definition or another) kinds just bounces along near the bottom of the graph there, way below the dashed "non-firearm" line.
https://www.democraticunderground.com/1172211325
https://www.democraticunderground.com/1172211325
The graph is per 100,000 per year, not percentages or anything, but going back to the 80s when "type not stated" was a tiny fraction of today's number, you can still see that only a small fraction of murders were done with rifles of any type.
It might be a reflection of guns like the .22LR, which are popular in both rifles and handguns. Other handgun cartridges are have only a small secondary use in rifles, but the .22LR is both.
People that would buy a pistol-caliber carbine would probably rather buy a shoulder gun with more power, all things being equal, except for plinking purposes.