Science
Related: About this forumThis scientist just changed how we think about climate change with one GIF
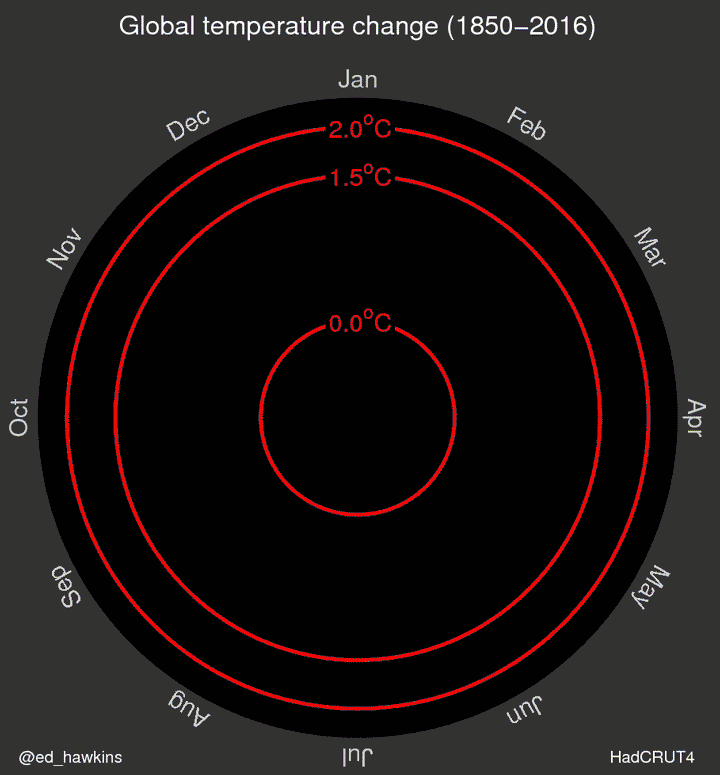
https://www.washingtonpost.com/news/energy-environment/wp/2016/05/11/this-scientist-just-changed-how-we-think-about-climate-change-with-one-gif/The image has resonated for a number of reasons — one of them being, as Hawkins says, that it “doesn’t require any complex interpretation.” It uses data that was always there, of course — data from the UK Met Office’s Hadley Centre and the University of East Anglia’s Climatic Research Center which document the globe’s average temperature anomaly monthly and annually going back to the year 1850. (Two U.S. agencies, NASA and NOAA, do the same but only go back to 1880).
Hawkins took these monthly temperature data and plotted them in the form of a spiral, so that for each year, there are twelve points, one for each month, around the center of a circle – with warmer temperatures farther outward and colder temperatures nearer inward. At the same time, he took the pre-industrial baseline temperature to be the average temperature from 1850 to 1900, and put out markers for where a 1.5 degree Celsius rise above that temperature would be, and where at 2 degree Celsius rise would be, in the form of larger, red concentric circles.
And then, of course, he made the whole thing animated and tweetable.
 = new reply since forum marked as read
Highlight:
NoneDon't highlight anything
5 newestHighlight 5 most recent replies
= new reply since forum marked as read
Highlight:
NoneDon't highlight anything
5 newestHighlight 5 most recent replies

Bob Loblaw
(1,900 posts)
SusanCalvin
(6,592 posts)It seems every new assessment of what's happening is more dire.
A Simple Game
(9,214 posts)
Bernardo de La Paz
(60,320 posts)The global warming is true. However, ....
You wish the headline to be true, but I'm not optimistic that many minds will be changed by the GIF. Most minds are relatively hardened in their positions.
If you want to change fossilized Republican minds to change, get their children and grandchildren asking "When the world is burning what will I have to tell my children about what you did or didn't do to save it?"
jtuck004
(15,882 posts)world since the 99% left it to the people who would destroy it.
Bernardo de La Paz
(60,320 posts)jtuck004
(15,882 posts)netflix to give a flying rat's ass about what appears to interest you in this.
If they really cared, and perhaps, sat and read books long enough to understand something that takes a little study, they might be standing in the roads preventing us from burning anything else - since we have already passed a couple of important milestones, earlier than many thought.
But they don't. Whether enough will b-4 everyone is screaming is still up in the air.
They are late to a game in which the losers die. Not a great start.
rhett o rick
(55,981 posts)profits and they must do that by exploiting the earth and there is no way to stop this trend let alone reverse it. And it's not only Republicons but many Corporatist Democrats also.
Bernardo de La Paz
(60,320 posts)Republicans are at the root of the problem but, as you rightly say, not the only ones. Change the Republicans and the "corporatist Democrats" will have already changed by then.
But even more importantly, for winning the political debate, it is a big mistake to equate exploitation of the earth with unsustainable exploitation. It is a failure of imagination to not see sustainable exploitation.
All corporations and all people, by long chains of actions and effects, exploit the earth more or less directly. Good corporations and good people exploit it as sustainably as possible; more and more sustainably as knowledge and technology grow.
Rapacious corporations are evil. Sustainable corporations are good (this includes issues like living wages).

alfredo
(60,330 posts)Bernardo de La Paz
(60,320 posts)What's happening is that the temperature is measured on a linear scale, but the line linking points circumscribes an area. Area increases as the square of the linear temperature axis.
alfredo
(60,330 posts)
Beartracks
(14,673 posts)... so that the graph isn't 100 feet long.
The temperature increase is still depicted by how close the line gets to the 1.5 red line (or, God forbid, the 2.0 line), not in how much area is circumscribed within it.
I think the effect of wrapping this graph into a circle shape will, however, make the line appear to move "faster" as it edges toward the red lines, because the arc between months will get longer -- just as the tip of a clock's second hand moves faster/farther than the part near the center.
======================
Bernardo de La Paz
(60,320 posts)For example, take an x-y axis graph consisting of a single line (linear rate of change), say 45 degrees for ease of demonstration.
Let the y axis ("temperature" become the radial axis at a 10:1 ratio (a linear ratio). It doesn't matter what ratio you choose, the effect is the same, but 10:1 is convenient for demonstration. Let the first 'y' start at 100, so the radial axis starts at 10.
Let the x axis ("years" become 10 steps around the circle = +10 in x. Again, the number of steps does not change the effect, but 10 is convenient for demonstration.
So, in the first 10 years, the x-y graph goes x from 0 to 10 and the y from 100 to 110. On the radial graph, the first wind around (x from 0 to 10) goes radially from 10 to 11. That fits outside a circle of radius 10 and inside a circle of radius 11. That is an area (pi-r-squared) of (3.14 x 11 x 11) - (3.14 x 10 x 10) = 380 - 314 = 66.
In the last 100 years, the x-y graph goes from 90 to 100 and the y from 190 to 200 (maintaining the linear rate of change). On the radial graph, the last wind goes radially from 19 to 20. That fits outside a circle of radius 19 and inside a circle of radius 20. That is an area of (3.14 x 20 x 20) - (3.14 x 19 x 19) = 1257 - 1134 = 123.
123 is not 66.
On the x-y graph, a linear rate of change has been converted to a varying rate of change, a rate of change that varies depending on how far you are from the center. That biases the radial graph to making later change seem much bigger than earlier change. Perceptually.
Similarly, as you point out, the step lines on the radial graph get longer as you get farther out, even though on the x-y graph each step is identical to every other step in our demonstration. The first step 0 to 1 in x is a line one tenth of circumference (2-pi-r) of about length (6.28 x 10) / 10 = 6.28. The last step 99 to 100 in x is a line one tenth of a larger circumference on the radial graph of about length (6.28 x 99) / 10 = 62.2. This is much longer and compounds the perceptual bias.
So the radial graph is a good example of how to lie with statistics and graphs.

muriel_volestrangler
(106,680 posts)This is increments of equal radius:

This is increments of equal area:

Me, I'd say the graph with equal radius increments is the one that looks 'steady'.
Bernardo de La Paz
(60,320 posts)When the increments are regular, it is easy to assess as regular. But in real data they almost never are. Then the perceptual uncertainty becomes an overlay.
A basic x-y graph is easy to assess and there is no question about perceptual effects.
When debating climate change with skeptics and deniers don't give them any cracks they can drive wedges into. Give them clear well-labelled direct x-y graphs and then they won't be able to quibble about graphic presentation.
muriel_volestrangler
(106,680 posts)If regular increments can be assessed as regular, then that's what we want, isn't it? Not a 'lie' as you said earlier.
Bernardo de La Paz
(60,320 posts)But if you don't want to lie, present a familiar direct easy to parse well-labelled x-y graph.
If you want to lie or dramatize or exaggerate, then present the viewer with an unfamiliar graphing technique which has perceptual overlays that have to be untangled.
Read two books: "How to Lie with Statistics" and "How to Lie with Graphs". Then read a book by Edward Tufte: "The Visual Display of Quantitative Information", second edition or "Envisioning Information". I have the latter and it is excellent. It illustrates complex presentation techniques for complex data. Climate temperature change is not complex.
muriel_volestrangler
(106,680 posts)But you're lumping it in with graphs that " lie or dramatize or exaggerate".
Yes, real data has irregular increments. But if regular increments look regular, then the irregular ones will appear in the correct proportions.
If you want to trash someone else's idea, say "lie" a lot when talking about it, and don't worry if your argument is consistent.
Bernardo de La Paz
(60,320 posts)muriel_volestrangler
(106,680 posts)Right, so the scale is linear, and easy to assess as such. That is therefore the only scale that will allow decent assessment of variations. By definition because any other scale would distort a regular increment.
No, you'd like to think you write carefully.
Bernardo de La Paz
(60,320 posts)Give it a rest.
You are arguing only for the sake of arguing.
muriel_volestrangler
(106,680 posts)I am arguing to show that you were mistaken about the linear scale being misleading, and to show you are wrong to accuse them of 'lying'. I don't want anyone to spread the misstatements you have made. You claim, illogically, that while a linear scale shows a regular increase fine, an irregular increase is somehow distorted. You advocated a different scale that you admit shows a regular increase badly, but think that any irregular increase will magically be shown clearly by it - no matter what the variation from regularity is, as far as I can tell.
If your multiple accusations of lying are 'careful writing', then you appear to be maliciously attacking the presentation of evidence of global warming. That would make it extremely important to continue to demonstrate how wrong you are.

Enthusiast
(50,983 posts)disillusioned73
(2,872 posts)Ughh... 

forest444
(5,902 posts)Such is the power of brainwashing.
They should be sent to live in Miami - after it sinks into the Atlantic.
peace13
(11,076 posts)Wait until they find out how angry God is for what we did to her Planet! : )
rhett o rick
(55,981 posts)There will be many generations of species after we are gone. It's a little audacious to think that God cares what happens to us more than the millions of species that we've helped meet extinction. 
peace13
(11,076 posts)And no, I think the planet would be A+ fine without the dirty humans. I am a little audacious in my thinking about the people concept. You know the good books are full of what humans should and shouldn't do so I have had that fake importance drilled into me from childhood. I pretty much don't worry about a god watching me anymore. I've moved on! Have an awesome evening!
JEB
(4,748 posts)as most of the humans die off.

BlancheSplanchnik
(20,219 posts)PUMPING OUT BABIES, PEOPLE.
The days of "be fruitful and multiply", "have as many as you want, it's your individual right" are OVER. OVER. OVER.

chknltl
(10,558 posts)For reasons i still don't understand I never had any kids. I am not unhappy about that...all things considered.
KansDem
(28,498 posts)That makes everything okay...doesn't it??


MynameisBlarney
(2,979 posts)and it will change nothing.
SCantiGOP
(14,765 posts)which is probably most of them, so your point is probably mostly true.
MynameisBlarney
(2,979 posts)to be critical thinkers.
chknltl
(10,558 posts)...sadly corporatism has a bottom line-a bottom line which is in direct conflict with the needs of life on our planet. How easy it is for us at DU to blame the Republicans when it is equally easy to see our own representatives siding with the corporatists....hypocrisy!
I hear from fellow DUers that they vote for equality, equal suffering is the promise they refuse to see for the children of our planet!
One candidate-exactly one candidate stood before the one country that could make a difference. ....and said that global climate change is the biggest threat to our country. Like him or not, he is correct.
I hope when your kids are old enough to understand....well maybe the time for hypocrisy will be over by then.
sulphurdunn
(6,891 posts)for us to use up. Jesus will fix the climate when he returns. 
Response to eridani (Original post)
cyberpj This message was self-deleted by its author.

BillZBubb
(10,650 posts)rhett o rick
(55,981 posts)addicted to more and more energy taken from our planet that isn't recoverable. The Capitalists want more and more and are willing to go to war (Bush/Cheney/Clinton) to get more and more. Some people dream of a post-capitalism economy. Post-Capitalism will find us extinct.
Thespian2
(2,741 posts)the biggest water thief on the planet, warned that fresh water to grow fruits and vegetables would soon be in short supply...I take soon to mean about a decade...
7962
(11,841 posts)Thespian2
(2,741 posts)I said "fresh" water...meaning not polluted...
If one prefers food grown in polluted water, then make sure the package came from China...

This is very unnerving

Recursion
(56,582 posts)Wow, powerful.