Welcome to DU! The truly grassroots left-of-center political community where regular people, not algorithms, drive the discussions and set the standards. Join the community: Create a free account Support DU (and get rid of ads!): Become a Star Member Latest Breaking News General Discussion The DU Lounge All Forums Issue Forums Culture Forums Alliance Forums Region Forums Support Forums Help & Search

NNadir

(33,516 posts)
Fri Jul 19, 2019, 08:22 PM Jul 2019

Correcting datasets leads to more homogeneous early-twentieth-century sea surface warming.

The paper I'll discuss in this post is this one: Correcting datasets leads to more homogeneous early-twentieth-century sea surface warming (Huyber et al Nature 571, 393–397 (2019))

It was really not all that long ago in history that the concept of "temperature" was qualitative as opposed to quantitative; one knew it was, for example, "hot" but how hot in comparison to previous "hot" was not clear. Calibration to international standards has improved greatly in the last 50 years, but the standardization of conditions under which measurements were made varied considerably.

We have chosen to destroy the planetary atmosphere for short term gain, and for those of us who think this may have been a bad, as in immoral, idea, it is important to make temporal comparisons. The problem with doing so is that one cannot really discern how the measurements were made in order to make accurate comparisons.

The paper under discussion is an attempt to adjust for that, to find out if there really are regions of the oceans that are cooling rather than heating. Although it is well known and well understood that the planet as a whole is in a death spiral of heat - Elon Musk's wonderful car for rich people and all the delusional marketing pictures of wind turbines and solar cells notwithstanding - and the that the average overall temperatures are climbing, the situation with respect to certain local areas has not been as clear.

The paper is an effort to address that point by taking a close look at the important issue of accuracy.

From the abstract, which is open sourced:

xisting estimates of sea surface temperatures (SSTs) indicate that, during the early twentieth century, the North Atlantic and northeast Pacific oceans warmed by twice the global average, whereas the northwest Pacific Ocean cooled by an amount equal to the global average1,2,3,4. Such a heterogeneous pattern suggests first-order contributions from regional variations in forcing or in ocean–atmosphere heat fluxes5,6. These older SST estimates are, however, derived from measurements of water temperatures in ship-board buckets, and must be corrected for substantial biases7,8,9. Here we show that correcting for offsets among groups of bucket measurements leads to SST variations that correlate better with nearby land temperatures and are more homogeneous in their pattern of warming. Offsets are identified by systematically comparing nearby SST observations among different groups10. Correcting for offsets in German measurements decreases warming rates in the North Atlantic, whereas correcting for Japanese measurement offsets leads to increased and more uniform warming in the North Pacific. Japanese measurement offsets in the 1930s primarily result from records having been truncated to whole degrees Celsius when the records were digitized in the 1960s. These findings underscore the fact that historical SST records reflect both physical and social dimensions in data collection, and suggest that further opportunities exist for improving the accuracy of historical SST records9,11.


From the body of the text:

According to recent estimates from the National Oceanic and Atmospheric Administration (NOAA)1, global average SST warmed by 0.43?°C between 1908 and 1941. Whereas the North Atlantic warmed by 0.82?°C, the North Pacific showed a bimodal structure, with the northwest Pacific cooling by ?0.39?°C and the northeast Pacific warming by 1.02?°C. Other gridded SST products give similarly disparate SST trends for the early twentieth century (Table 1 and Extended Data Fig. 1), and together these SST estimates suggest that internal modes of variability strongly contributed to early-twentieth-century climate change. Specifically, the Atlantic Multidecadal Oscillation and the Pacific Decadal Oscillation have been suggested to account for regional variations as well as more than half of the global warming between 1908 and 1941 (refs 6,12). Model simulations of the atmospheric and oceanic response to prescribed radiative forcing do not, however, reproduce either the magnitude13,14 or the pattern5,15 of the early-twentieth-century warming seen in observations (Extended Data Fig. 1e). Difficulty in reproducing observations has been suggested to arise from deficiencies in how radiative forcing is prescribed16 or from model limitations in representing internal climate variability17,18

nother possibility is that observational estimates of SST changes contain undetected biases, for which there are some precedents. Difficulty in simulating a slowdown in global warming between 1997 and 2012 was partly reconciled by revising SST estimates19, amongst other considerations20. In another study21, a jump in global temperature by 0.3?°C in 1945 was attributed to offsets between engine-room intake and bucket SST estimates.

The four major SST products covering the early twentieth century each rely upon the International Comprehensive Ocean-Atmosphere Data Set (ICOADS)22, whose latest release is 3.0. It is estimated that 94% of observations between 1908 and 1941 were from buckets (Fig. 1). Bucket measurements of SST are biased by evaporative, sensible and solar heat fluxes that depend on a range of factors, including weather, ship deck height and bucket type7. For example, a canvas bucket left on deck for three minutes under typical wind and other weather conditions can give water temperatures that are approximately 0.5?°C cooler than a wooden bucket measured using the same protocol7,9...


Some graphics from the paper:
?

The caption:

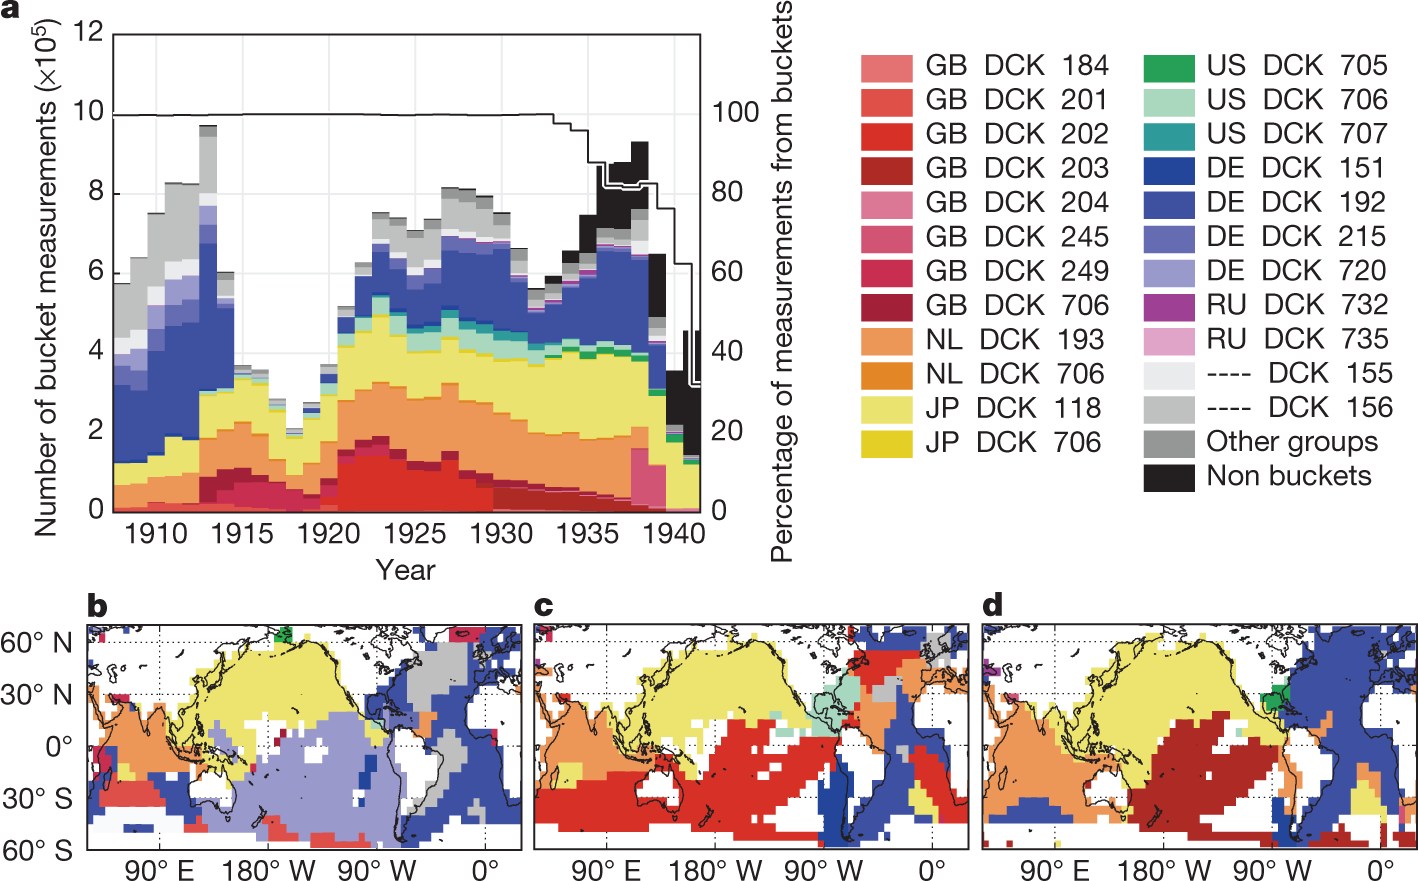
a, Left-hand y-axis: number of bucket SST measurements from individual groups identified by country and deck information in ICOADS3.0. Country name abbreviations are: DE, Germany; GB, Great Britain; JP, Japan; NL, The Netherlands; RU, Russia; US, United States; and —, missing. Groups having fewer than 100,000 measurements are labelled as ‘other groups’. Decks 118 and 762 are combined into ‘JP DCK 118’ because they are both Japanese Kobe Collection decks. Right-hand y-axis: percentage of measurements that have come from buckets, showing that nearly all observations before 1935 are from buckets (black line). b–d, Maps indicating nations that contribute the most observations within 5° × 5° grids for the periods 1908–1918 (b), 1919–1928 (c) and 1929–1941 (d). White grid boxes have fewer than three years of data.


The caption:

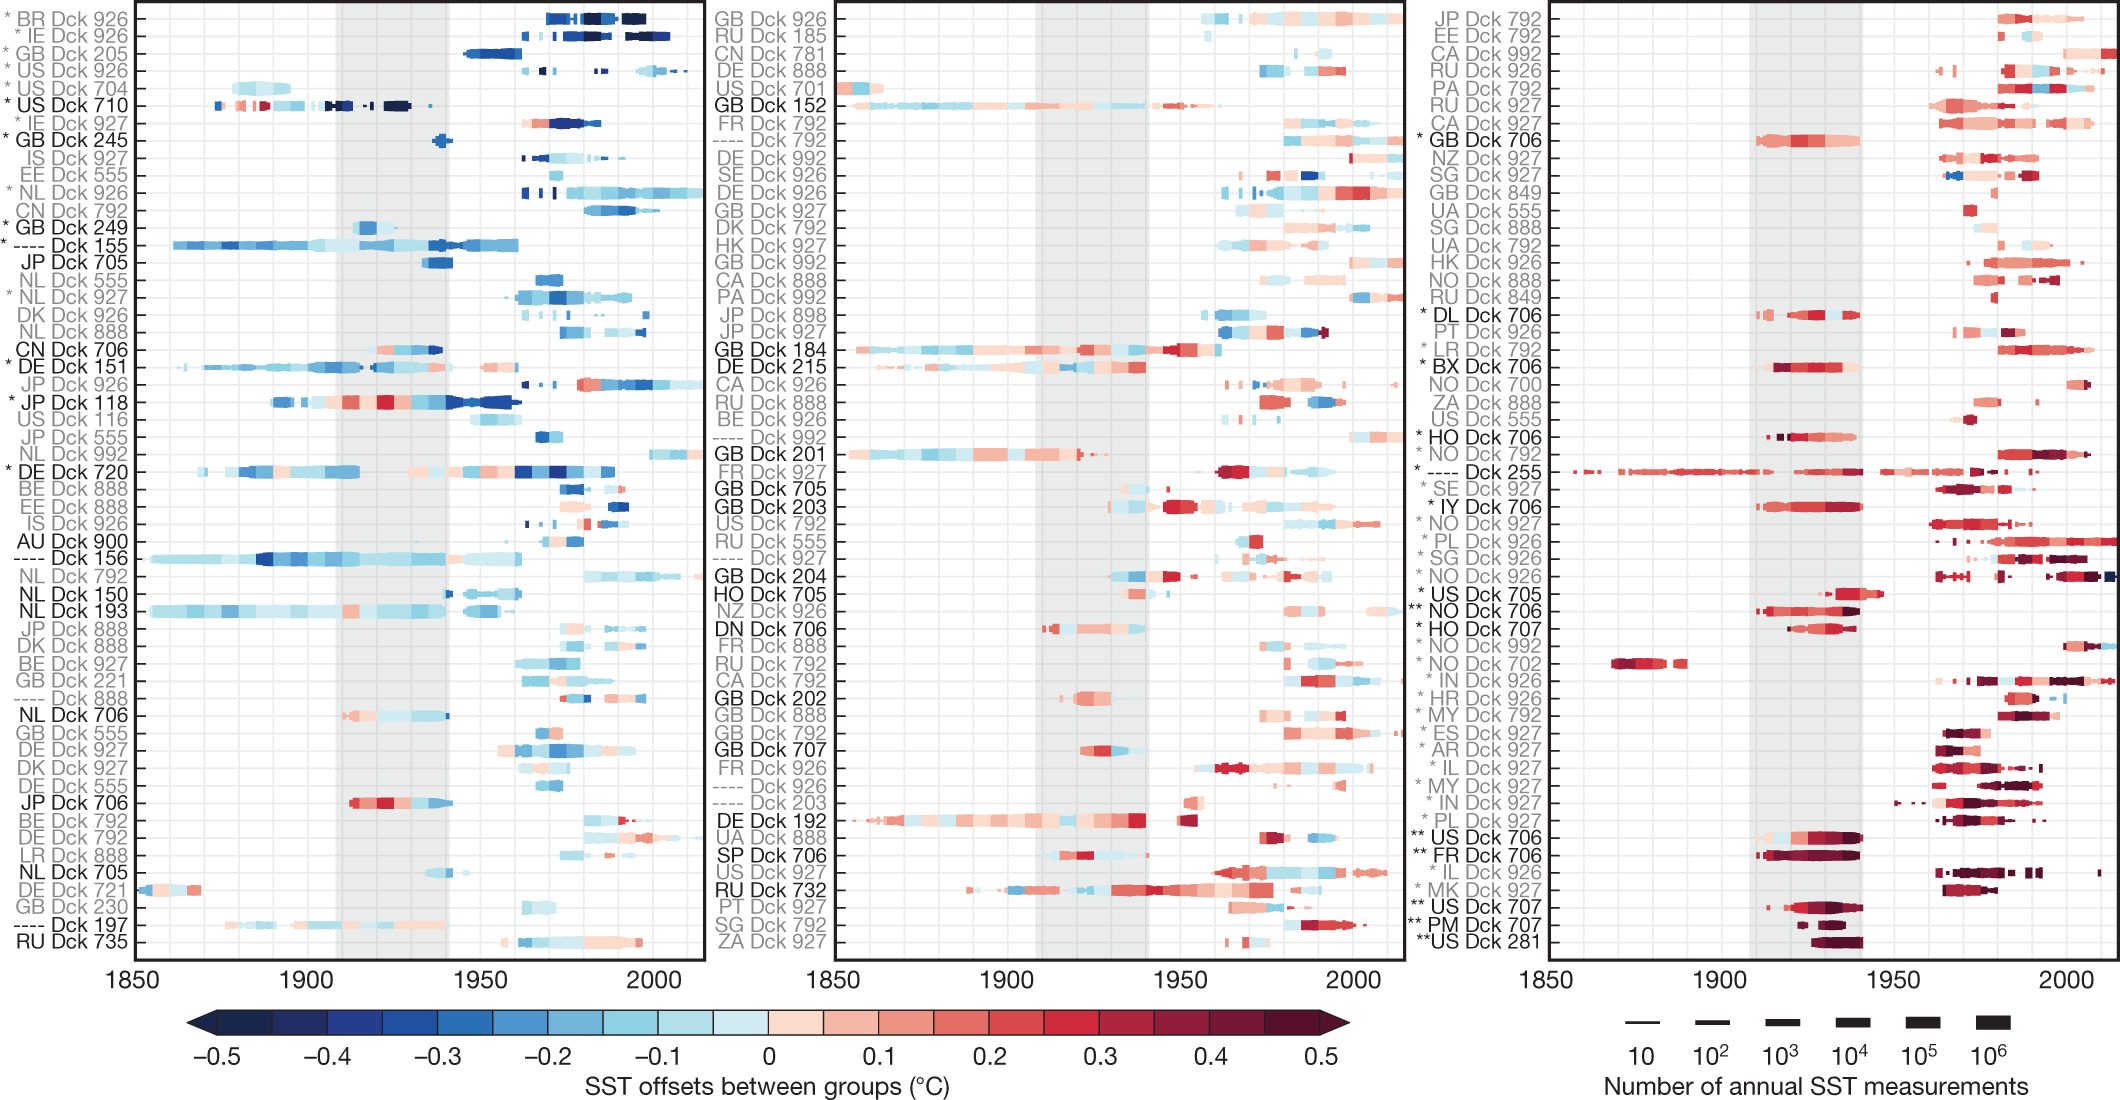
Groups for which fixed effects differ significantly from zero are indicated by * (P < 0.05). The 46 out of 162 groups that contribute data between 1908 and 1941 are indicated in black, and those remaining significant after a Bonferroni correction (P < 0.05/46) are indicated by **. Shading indicates the sum of fixed and five-yearly effects (regional effects are not shown). Bar widths indicate the number of SST measurements contributed by each group for each year. Abbreviated country names correspond to those in Fig. 1 and are listed in Supplementary Table 1.


The caption:

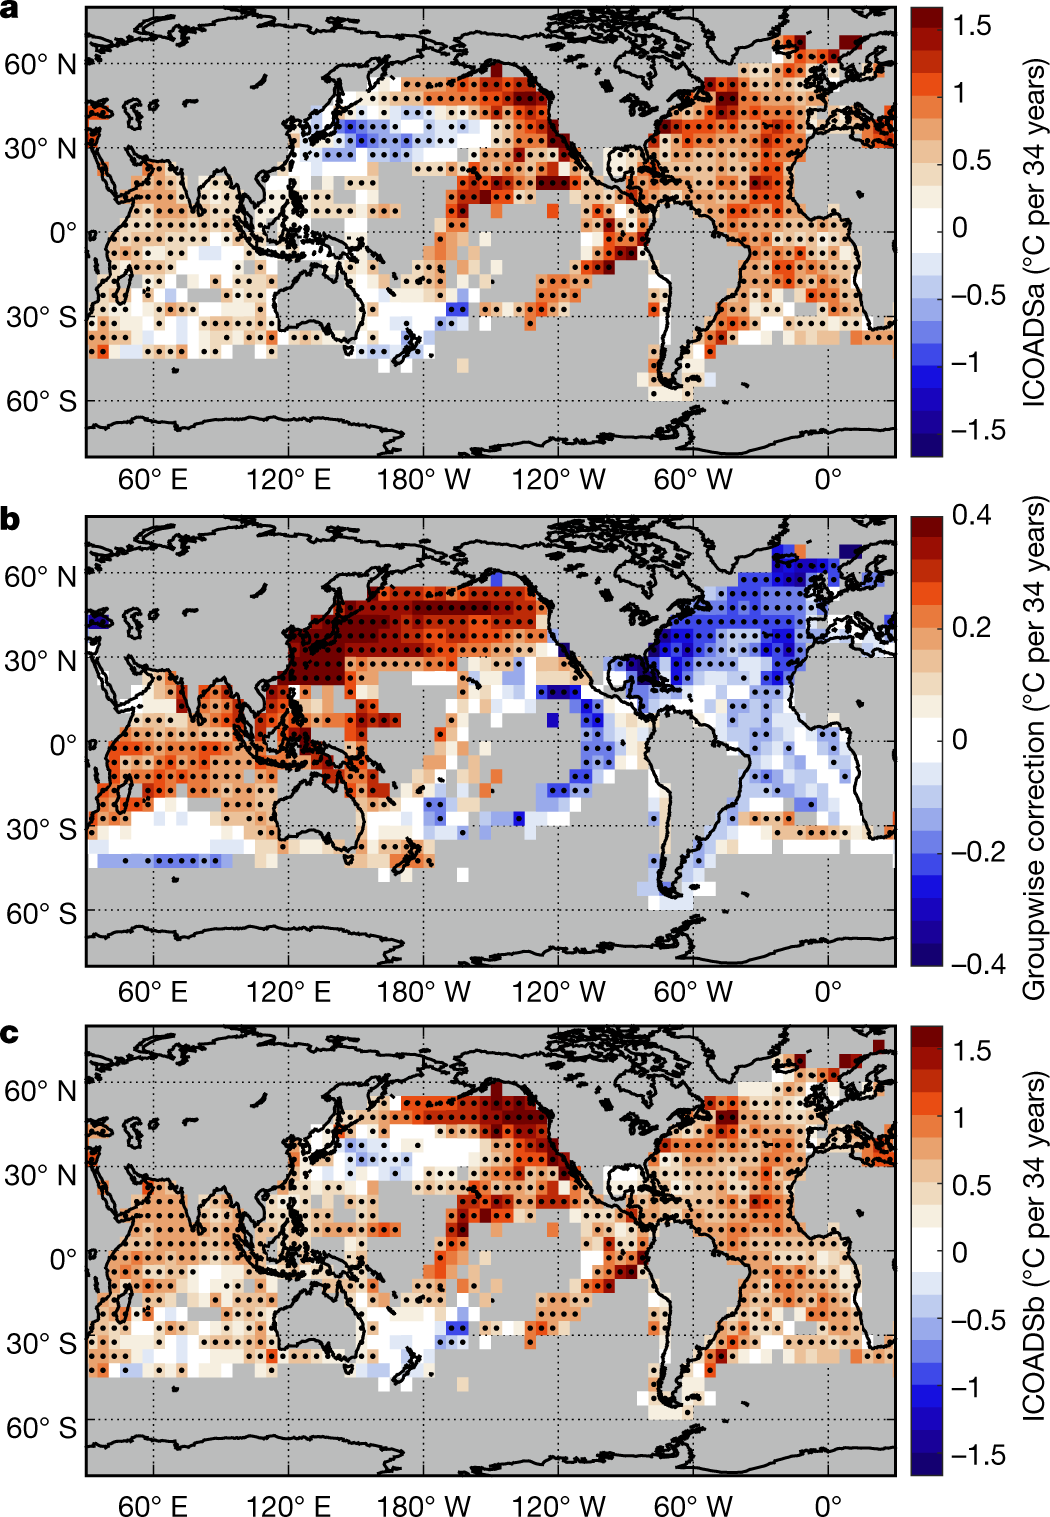
a, SST trends in ICOADSa are similar to patterns found in existing SST estimates (Extended Data Fig. 1). b, Trends associated with the corrections for groupwise offsets. Note that panel b is plotted on a different colour scale. c, SST trends in ICOADSb after applying groupwise corrections. Areas in grey are inadequately sampled for purposes of calculating trends (see Methods). Dots indicate significant trends (P < 0.05). In ICOADSb (c), 77% of boxes show statistically significant warming, whereas only 2% show significant cooling. By contrast, in ICOADSa (a), 6% of boxes indicate significant cooling.


The caption:

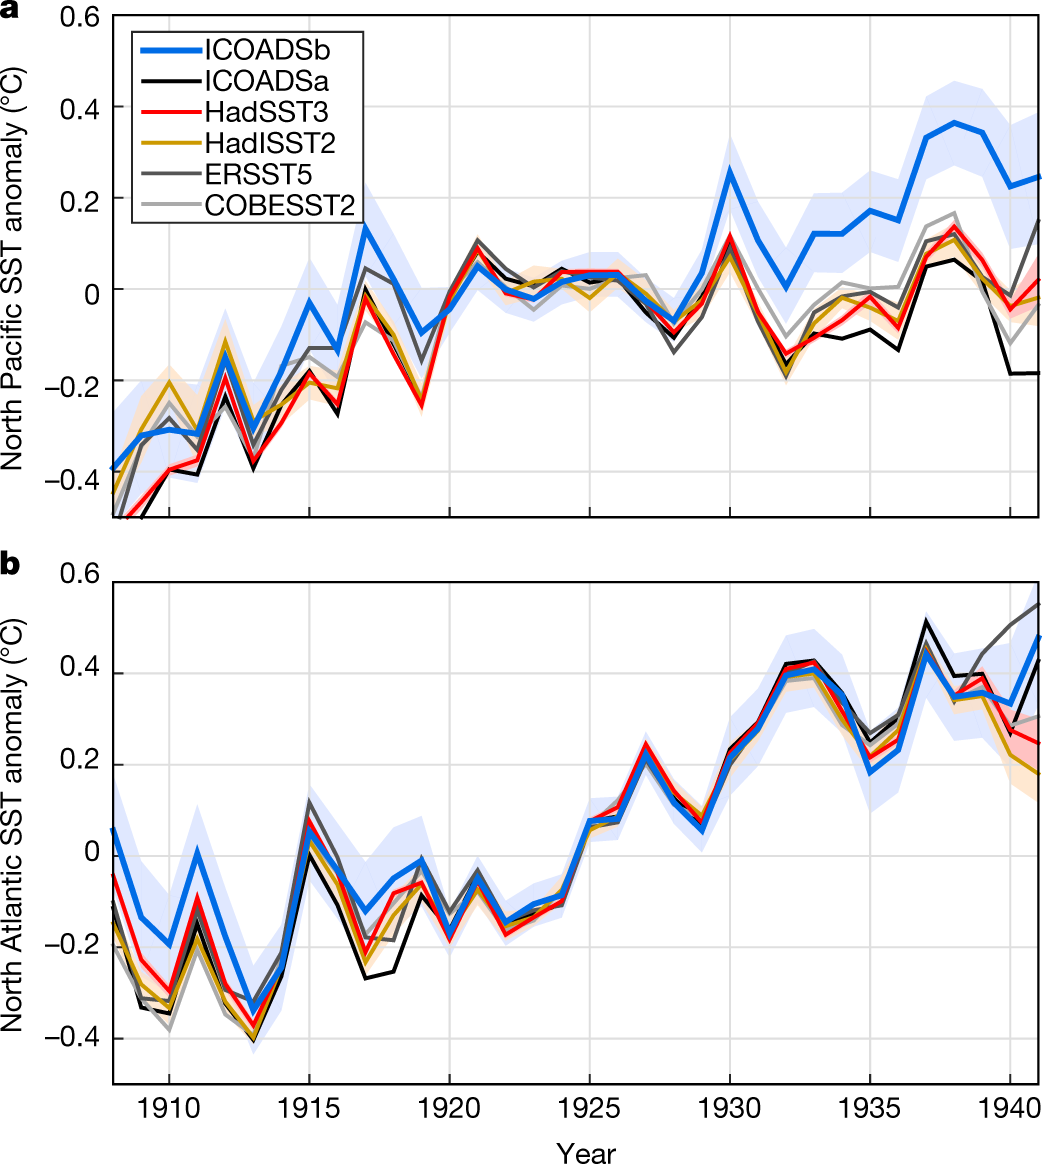
a, b, Annual SST anomalies from different datasets in the North Pacific (a) and North Atlantic (b) oceans. Anomalies are relative to the 1920–1929 mean of each SST estimate. ICOADSb shows greater warming in the North Pacific and less warming in the North Atlantic relative to previous estimates. Uncertainties associated with ICOADSb (blue shading, 2 s.d.) are for annual average SSTs for each sub-basin, and are an order of magnitude larger than those reported for HadSST3 (red shading). Note that those uncertainties included in HadSST3 are mostly removed when computing the anomaly. The discrepancy in annual average SST uncertainties is larger than the discrepancy for trends (Table 1).


From the conclusion:

Finally, we briefly explore the implications of our results for model–data mismatches during the early twentieth century. Differences in rates of warming in the North Atlantic and North Pacific reduce from 0.54 ± 0.03?°C per 34 years in ICOADSa to 0.10 ± 0.07?°C per 34 years in ICOADSb. These revised interbasin trend differences are consistent with that of 0.00 ± 0.40?°C per 34 years found in the early-twentieth-century simulations from the Fifth Climate Model Intercomparison Project30 (CMIP5; Extended Data Fig. 1e). But we note that the global-average rate of SST warming in ICOADSb is 0.56 ± 0.10?°C per 34 years, and that the same domain in the CMIP5 ensemble warms by only 0.19 ± 0.17?°C per 34 years—a discrepancy in warming rates noted previously for other SST estimates27. The model–data mismatch in rates of overall warming highlights the importance of continuing to investigate forcing, sensitivity and internal variability of the climate system along with corrections to historical SST estimates.


Maybe things are worse than we think, although at 415 ppm CO2 levels having been hit this year, things are clearly pretty bad.

The 2003 European heatwave is said to have killed 70,000 people, upon analysis.

Death toll exceeded 70,000 in Europe during the summer of 2003 (Plus de 70 000 décès en Europe au cours de l'été 2003) (Robine et al Comptes Rendus Biologies
Volume 331, Issue 2, February 2008, Pages 171-178.)

Daily numbers of deaths at a regional level were collected in 16 European countries. Summer mortality was analyzed for the reference period 1998–2002 and for 2003. More than 70,000 additional deaths occurred in Europe during the summer 2003. Major distortions occurred in the age distribution of the deaths, but no harvesting effect was observed in the months following August 2003. Global warming constitutes a new health threat in an aged Europe that may be difficult to detect at the country level, depending on its size. Centralizing the count of daily deaths on an operational geographical scale constitutes a priority for Public Health in Europe.


Global warming is an issue involved dangerous fossil fuel waste.

Still, at this point, including 2019, the death toll from heat has yet to rival the death toll from exposure to dangerous fossil fuel combustion wastes and dangerous biomass combustion wastes, aka air pollution, more than 7 million deaths per year.

It's too bad of course, that our knee jerk discussions of energy wastes tends to focus on so called "dangerous nuclear waste" even though the "dangerous" adjective is applied by air heads who cannot point to a death toll on the order of 70,000 deaths over the whole life time of commercial nuclear energy, never mind a single summer, and nothing like the 70,000,000 people who died in the last ten years from dangerous fossil fuel and biomass combustion wastes.

Tell me again, so I can understand it, just how dangerous so called "nuclear waste" is in comparison. )Only numerical historical data can be worthy of respect, wild-assed paranoid speculations don't count.)

We live on an insane planet, and not all of the insanity derives from the ugly orange ignoramus racist in the White House.

Have a nice weekend.


3 replies = new reply since forum marked as read
Highlight: NoneDon't highlight anything 5 newestHighlight 5 most recent replies
Correcting datasets leads to more homogeneous early-twentieth-century sea surface warming. (Original Post) NNadir Jul 2019 OP
that's alot of stuff to plow through to show support of the nuclear waste industry nt msongs Jul 2019 #1
I'm a scientist. I think in terms of science; I read scientific publications. I reference them... NNadir Jul 2019 #2
Hardly surprised the numbers were off as it just seemed to be that the whole warming trend has been cstanleytech Jul 2019 #3

NNadir

(33,516 posts)
2. I'm a scientist. I think in terms of science; I read scientific publications. I reference them...
Fri Jul 19, 2019, 09:00 PM
Jul 2019

...in many of the posts originating here with me.

However, I am acquainted with the dangerous and deadly notion that science is too much to "plow through."

It's funny, with all the wonderful retrospectives on the Apollo program how far we've come from times in which scientists and engineers were respected.

I also surely don't expect some person emoting about some bullshit crap about so called "nuclear waste" to appreciate science.

I asked a simple and direct question of anyone who is concerned about the concept of so called "nuclear waste."

Valuable used nuclear fuels have been accumulating for more than 60 years in the commercial sphere. I understand the science of these materials intimately. I challenged someone to produce data that it kills something like the 70 million people who died from air pollution.

Here is the most recent full report from the Global Burden of Disease Report, a survey of all causes of death and disability from environmental and lifestyle risks: Global, regional, and national comparative risk assessment of 79 behavioural, environmental and occupational, and metabolic risks or clusters of risks, 1990–2015: a systematic analysis for the Global Burden of Disease Study 2015 (Lancet 2016; 388: 1659–724) One can easily locate in this open sourced document compiled by an international consortium of medical and scientific professionals how many people die from causes related to air pollution, particulates, ozone, etc.

Where exactly in this publication is the death toll from so called "nuclear waste," or a putative "nuclear waste industry?"

If someone has an answer to this very simple question, it should be fairly easy to produce it. I mean, used nuclear fuel has been accumulating for more than half a century. Where, exactly, are the dead?

If, in contrast to producing real numbers, someone complains about the obvious inference that someone can draw from the results of attack on the nuclear industry - that would be climate change, heat deaths, and air pollution deaths - attacks on an industry which has prevented the dumping of more than 30 billion tons of carbon dioxide, and might have done far more were it not for the ignorant and fearful, easily interpreted from data, well, I'm unimpressed.

Prevented Mortality and Greenhouse Gas Emissions from Historical and Projected Nuclear Power (Pushker A. Kharecha* and James E. Hansen Environ. Sci. Technol., 2013, 47 (9), pp 4889–4895)

I'm used to ignorance, as we live in obvious times where it is celebrated, largely but hardly only on the right.

The fact that anti-nukes hold scientific publications in contempt is hardly news to me. I'm used to that.

Really though, these people just piss me off. Their ignorance is destroying a future that did not belong to them, betting the future on horseshit "by 2050" and "by 2100" bull about so called "renewable energy" that is not sustainable, did not work, is not working, and won't work.

Mostly these days I put these awful people with their Trump type distortions of reality on my ignore list here, but here and there, I forget a few, at least until they show up whining rather than producing real numbers.

Have a nice life.

cstanleytech

(26,291 posts)
3. Hardly surprised the numbers were off as it just seemed to be that the whole warming trend has been
Fri Jul 19, 2019, 10:09 PM
Jul 2019

an ongoing issue for a few hundred years.
Partly due to a natural warming trend of course as we are leaving the last ice age but also partly man made as the industrial revolution started and we started to use fossil fuels in abundance not to mention the waste heat from all our industry has to go somewhere which it seems is ultimately the oceans.

Latest Discussions»Culture Forums»Science»Correcting datasets leads...