Science
Related: About this forumConstraints on global mean sea level during Pliocene warmth: Sea level was 16-17 meters higher.
The paper I'll discuss is this one: Constraints on global mean sea level during Pliocene warmth (Onac, et al, Nature 574, 233–236 (2019)).
Currently, carbon dioxide accumulations are the highest recorded ever (although the record extends only to the mid 20th century), about 2.4 ppm per year and rising. We are currently reaching (or have reached) the annual minimum that comes every September. (It may end up being in October this year as the Northern Hemisphere's summer is extending with climate change.) The weekly low for this year was recorded at the Mauna Loa Carbon Dioxide Observatory for the week ending September 9, 2019, a reading of 407.96 ppm. The high for this year was recorded during the week ending May 12, 2019, when the reading was 415.39 ppm, the highest value ever recorded at Mauna Loa.
At 2.4 ppm per year, our current rising rate of increase, we should see 450 ppm in about 15 years, "by 2035" in the kind of language Greenpeace has been using for the last 50 years to describe when we will all live in a "renewable energy" nirvana powered solely be wind, solar, and all be driving electric cars, although in the old days, when I was a kid, that renewable energy nirvana was supposed to arrive "by 2000."
It didn't, but who's counting? We should do things on a faith basis, no, and only read Greenpeace "studies," because they always make you feel warm and fuzzy.
Warm, definitely. It's getting very hot these days. Fuzzy? I don't know. How does "fuzzy" feel?
The reason that this 450 number sticks in my mind, other than the 350 number about which Bill McKibben likes to talk, is the cited paper refers to a period, the Pliocene, which was relatively recent in geological history when carbon dioxide briefly was above 450 ppm. Let me jump the gun a little and post a figure from the paper before excerpting any text. Here it is, figure 3:
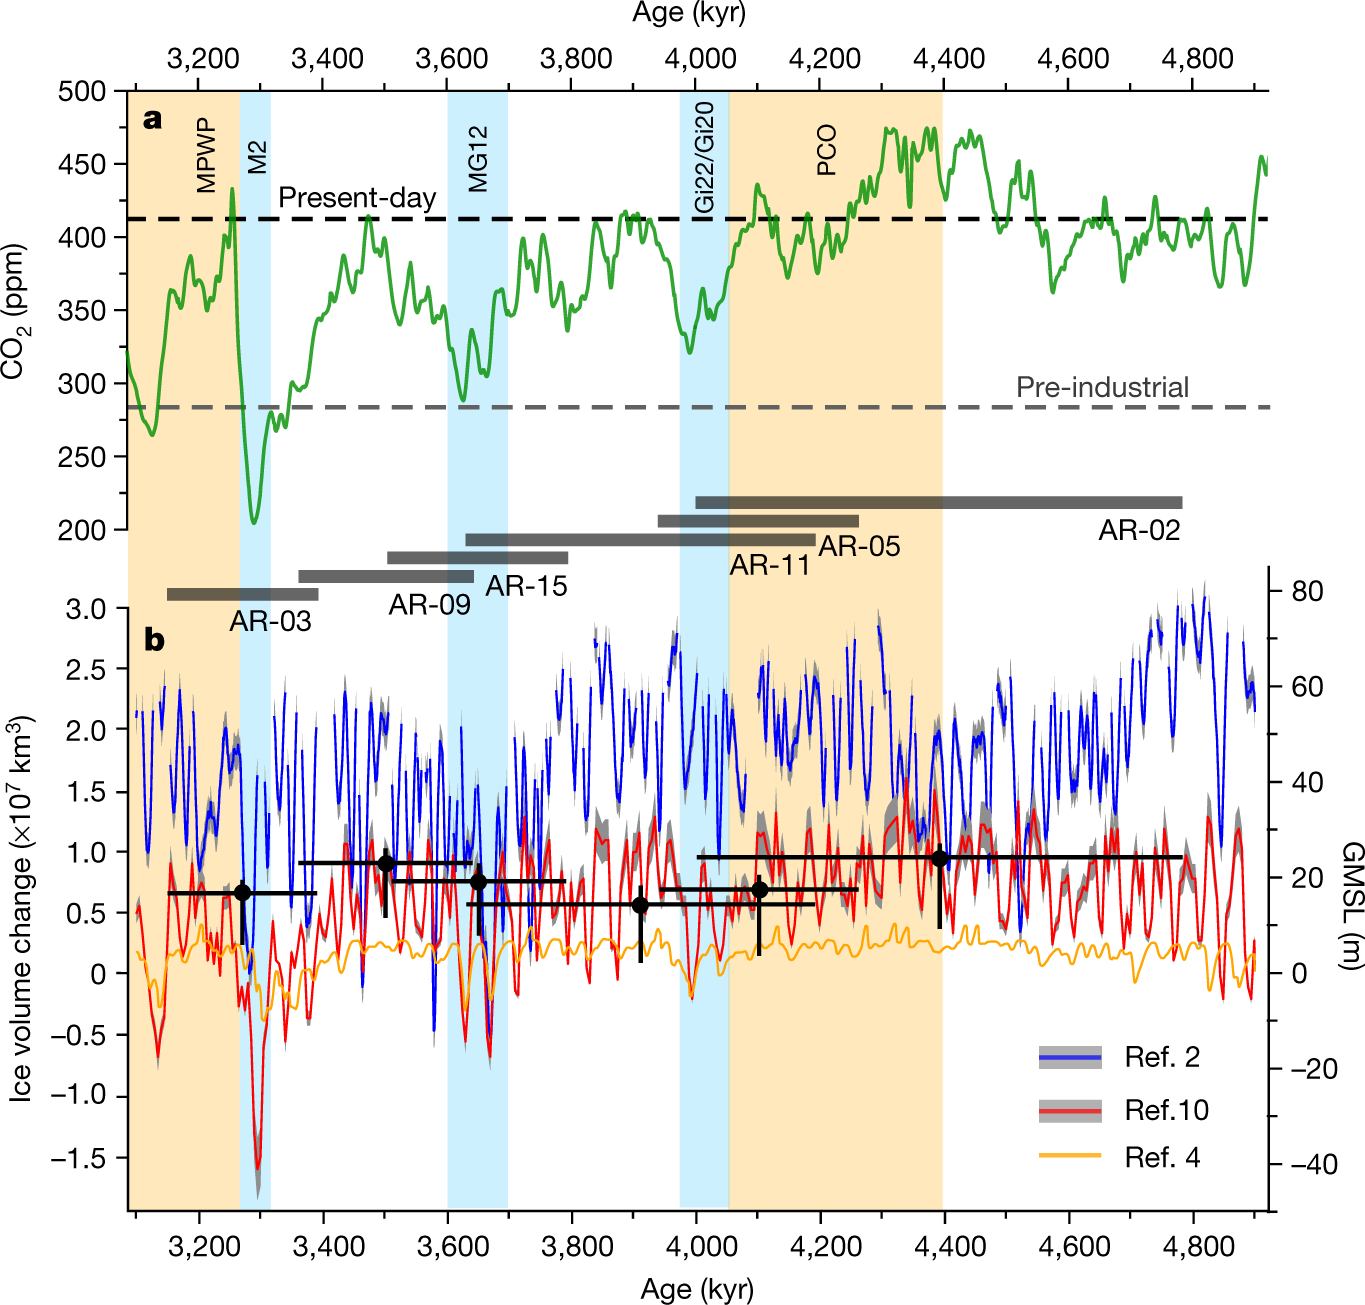
The caption:
Some text from the abstract, which should be open sourced:
From the paper's introduction:
Oxygen isotope ratios from benthic foraminifera10 paired with deep ocean temperature estimates have been used to approximate ice-volume-equivalent GMSL changes over the Pliocene11,12. While invaluable, these approaches are limited by uncertainties in the methodology and a number of factors (for example, post-burial diagenesis, long-term changes in seawater chemistry and salinity) that are poorly constrained and may bias the sea-level estimates3. Field mapping of palaeoshorelines has been a complementary approach...
A few other means of estimating sea level height are given. The authors however choose a new approach:
"Phereatic overgrowths on speleotherms" refer to deposits that form on stalactites and stalagmites when they go under water.
Table 1:

Some other pictures in the paper:
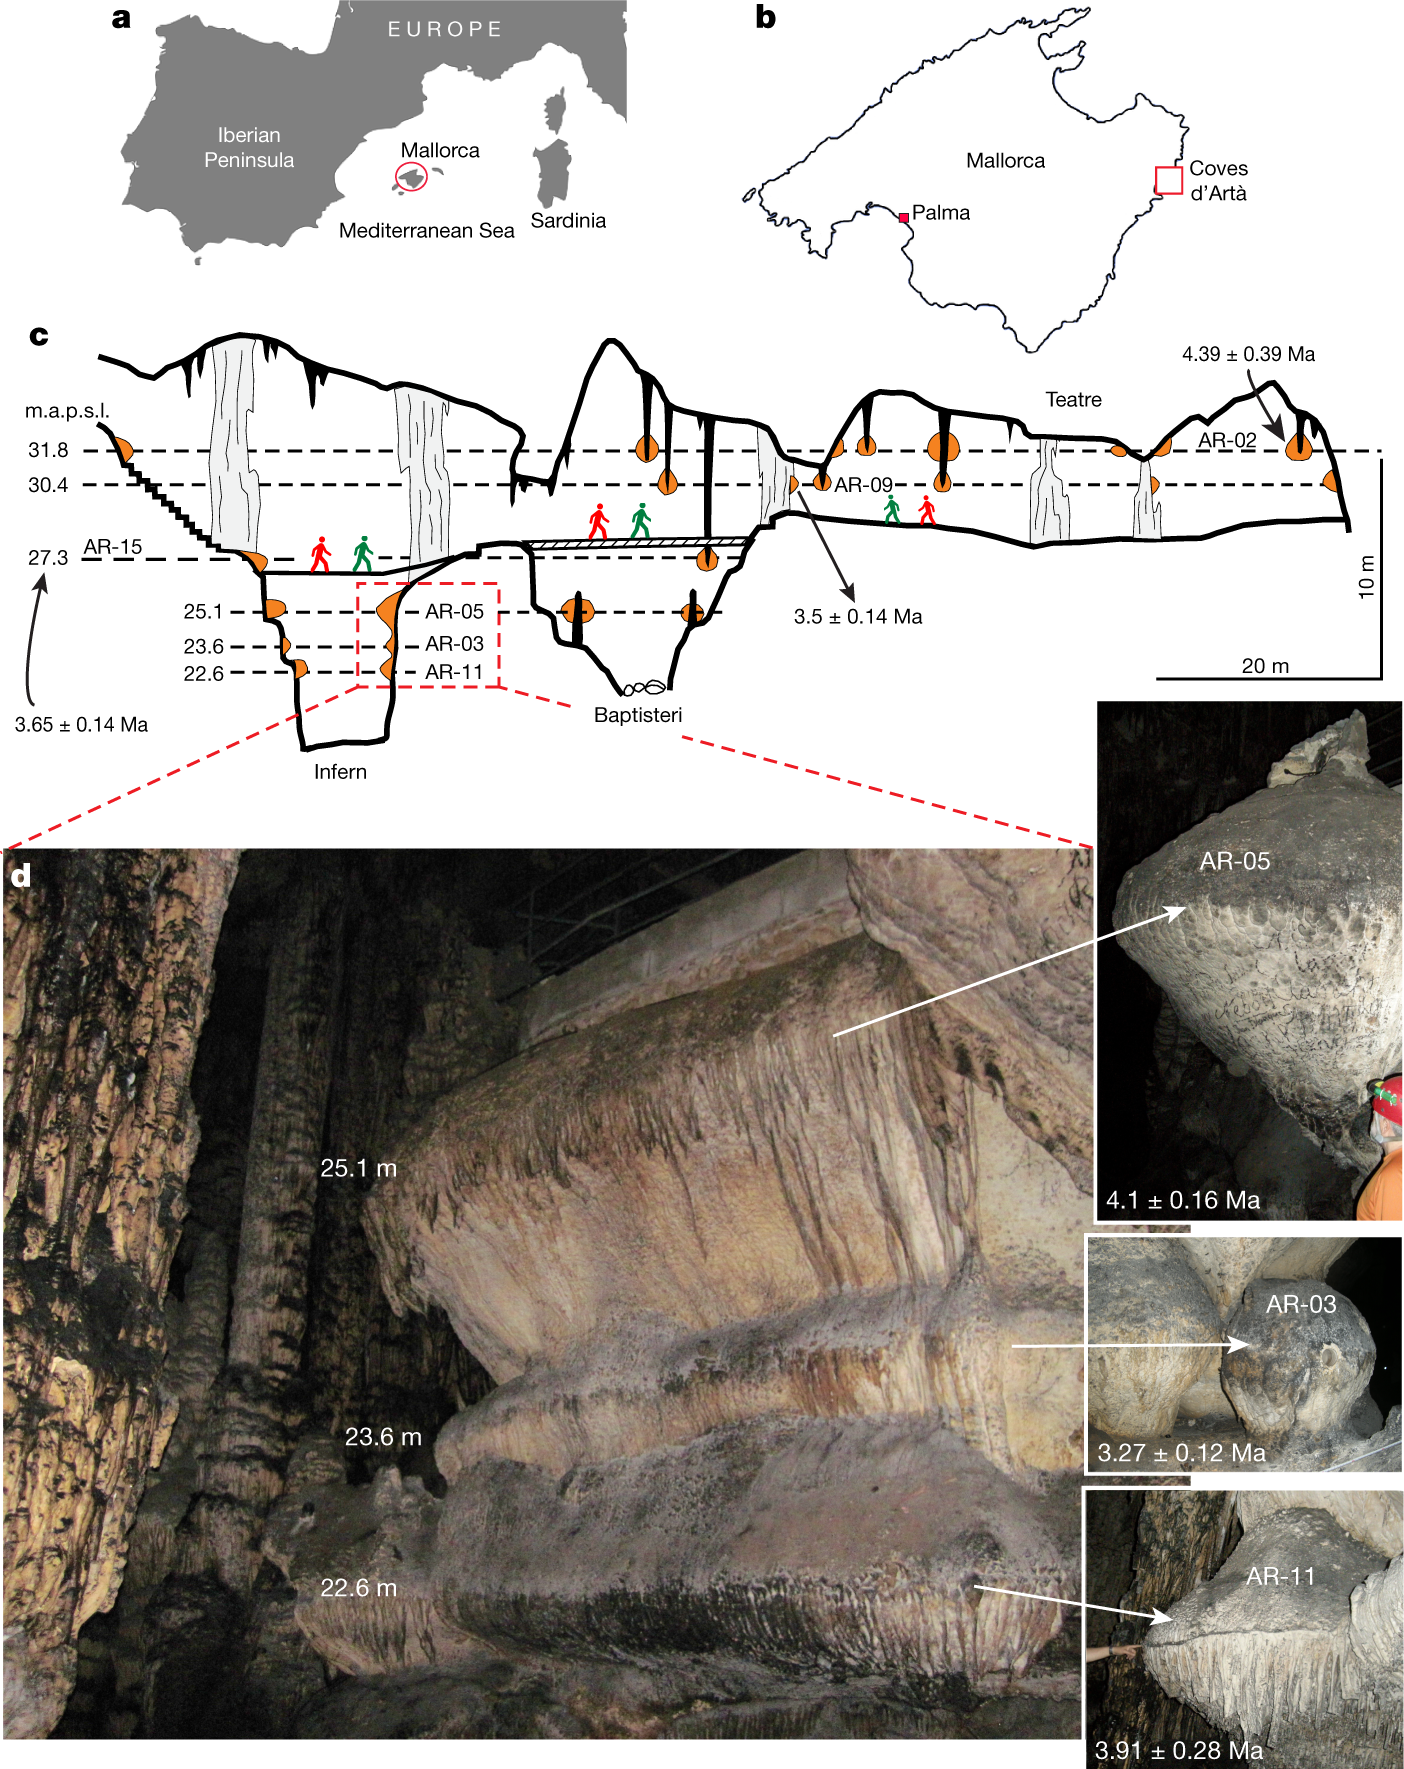
The caption:
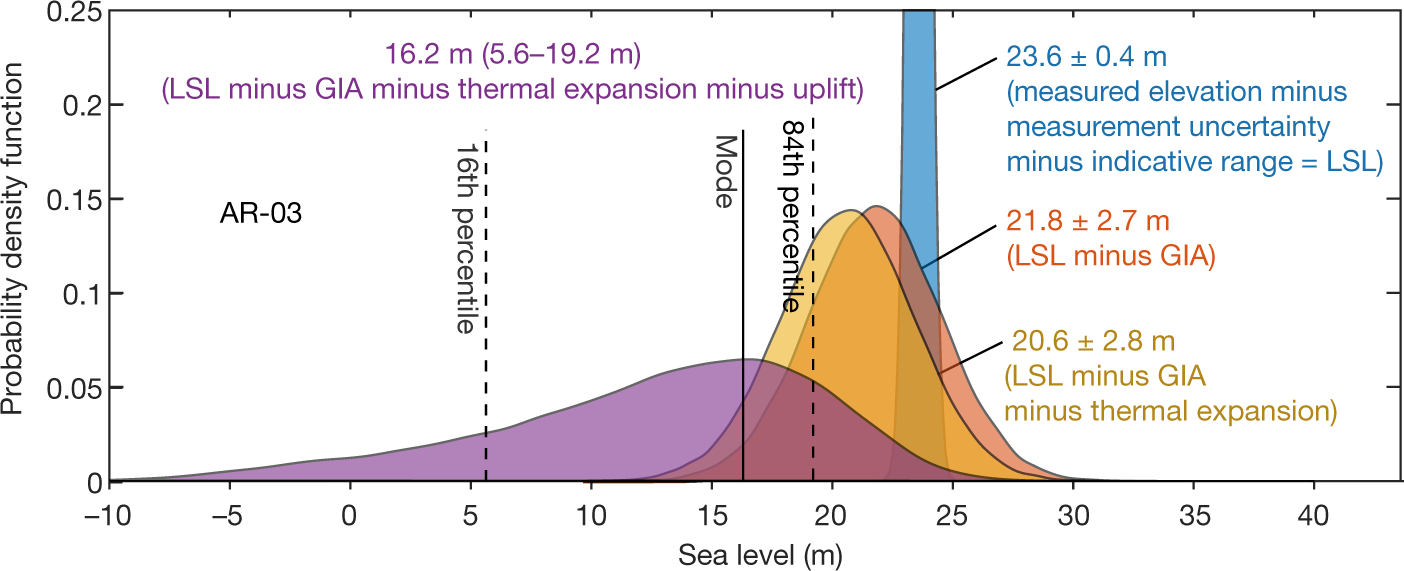
The caption:
Figure 3 was produced here earlier.
An excerpt of the conclusion:
"m.a.p.s.l" is an unnecessary abbreviation of "meters above present sea level."
Don't worry. Be happy. It's not your problem. You'll be dead "by 2100" just like the people who bet the planet on so called "renewable energy," but happily will be dead when future generations will almost certainly not be able to achieve, because we have insisted blithely, that it will be easy for them to do what we could not do ourselves.
Most likely, the reality is that future generations, much as was the case for all generations before the 19th century will actually experience living by "renewable energy" the way those generations did: Then, as in the future I predict - may I be proved wrong - even more so than today, the bulk of humanity lived short, miserable lives of dire poverty.
History will not forgive us, nor should it.
I hope you enjoy the upcoming weekend.
 = new reply since forum marked as read
Highlight:
NoneDon't highlight anything
5 newestHighlight 5 most recent replies
= new reply since forum marked as read
Highlight:
NoneDon't highlight anything
5 newestHighlight 5 most recent replies
Ghost Dog
(16,881 posts)you've made it into the elite, brother.
It's called "civilisation",. However much energy you have power over, as elite, it should always be more than that of all peasants and proles combined.

NNadir
(37,787 posts)...much stratified.
It's much worse when one extends one's vision throughout the world rather than the simple provincial focus that many of us in the United States have.
Ghost Dog
(16,881 posts)of all things (phenomena), is it not?
Thanks for all we learn from your posts, NNadir.
NNadir
(37,787 posts)
Eko
(9,923 posts)Guess that was wrong.
