Premature mortality related to United States cross-state air pollution.
The paper I'll discuss in this post is this one: Premature mortality related to United States cross-state air pollution (Barrett et al., Nature 578, pages 261–265 (2020))
Ultimately the most dangerous fossil fuel wastes will be those associated with climate change, but dangerous fossil fuel waste has been killing people all over the world for a century. The de-industrialization of the United States, along with political laws associated with automotive and power plant emissions, the latter being part of the Clean Air Act now in the process of being gutted, and the substitution of dangerous natural gas for dangerous coal in the United States has lead overall to a decrease in the deaths here; we now export air pollution deaths to import trinkets for our bourgeois lifestyle, but people still die here from air pollution.
This paper is an attack on the ever popular theory advanced by the racists who dominated the Democratic Party in the 19th century, and in the big switch, the Republican party in the late 20th and early 21st century. It shows that it rains particles in the lungs in the just and unjust alike.
From the abstract, which is surely open sourced:
Outdoor air pollution adversely affects human health and is estimated to be responsible for five to ten per cent of the total annual premature mortality in the contiguous United States1,2,3. Combustion emissions from a variety of sources, such as power generation or road traffic, make a large contribution to harmful air pollutants such as ozone and fine particulate matter (PM2.5)4. Efforts to mitigate air pollution have focused mainly on the relationship between local emission sources and local air quality2. Air quality can also be affected by distant emission sources, however, including emissions from neighbouring federal states5,6. This cross-state exchange of pollution poses additional regulatory challenges. Here we quantify the exchange of air pollution among the contiguous United States, and assess its impact on premature mortality that is linked to increased human exposure to PM2.5 and ozone from seven emission sectors for 2005 to 2018. On average, we find that 41 to 53 per cent of air-quality-related premature mortality resulting from a state’s emissions occurs outside that state. We also find variations in the cross-state contributions of different emission sectors and chemical species to premature mortality, and changes in these variations over time. Emissions from electric power generation have the greatest cross-state impacts as a fraction of their total impacts, whereas commercial/residential emissions have the smallest...
From the introductory text in the body of the paper:
Long-term exposure to fine particulate matter (PM2.5) and ozone leads to an increased risk of premature death7,8,9,10,11,12. Indeed, PM2.5 and ozone are the most prominent known causes of early deaths associated with outdoor air pollution, resulting in more than 90% of total air-pollution-related mortalities8,11. For this reason, PM2.5 and ozone have become the predominant pollutants for quantifying air quality2. These pollutants form mainly through atmospheric chemical reactions following the release of precursor emissions. PM2.5, which consists of particles and liquid droplets, forms from gaseous precursor emissions of nitrogen oxides (NOx), sulfur oxides (SOx), ammonia (NH3), and others. PM2.5 can also be emitted directly, as in the case of black carbon. Ozone forms from gaseous precursor emissions of NOx and volatile organic compounds (VOCs). The adverse health impacts due to exposure to PM2.5 and ozone can therefore be attributed to the precursor emissions that lead to their formation. Such attribution is useful, as it is these emissions that can be directly controlled, rather than the exposure that results from them.
Combustion emissions constitute the largest source of anthropogenic emissions in the USA, and therefore contribute to the formation of PM2.5 and ozone2. The health impacts attributable to these emissions have been estimated in various studies6,13,14, with estimates varying between 90,000 and 360,000 early deaths per year. In the context of the Environmental Protection Agency (EPA) Cross-State Air Pollution Rule (CSAPR) and individual state regulation, measures to further reduce the health impacts of pollution would benefit from a greater understanding of which sectors and which states are responsible for the health impacts in every other state.
The paper's goal:
In this work, we estimate the pollution exchange between the 48 contiguous US states, and form source–receptor relationships between them for combustion emissions from seven sectors: electric power generation; industry; commercial/residential; road transportation; marine; rail; and aviation. The commercial/residential sector includes residential combustion (for example, of biomass), nonindustrial commercial and institutional processes, and waste treatment, among other sources. This analysis yields estimates for the number of early deaths due to PM2.5 (primary and secondary, excluding secondary organic aerosols) and ozone exposure in every state, with attribution of impacts to each sector and each emitted chemical species from every state. We estimate combustion emissions for the seven sectors for 2005 (based on the 2005 National Emissions Inventory (NEI)), 2011 (based on NEI2011) and 2018 (based on the NEI2011 forecast), and present these findings in Extended Data Table 1. Lists of the specific sources that are grouped in each sector are included in the associated data repository (see Methods).
Some graphics from the paper:
The caption:
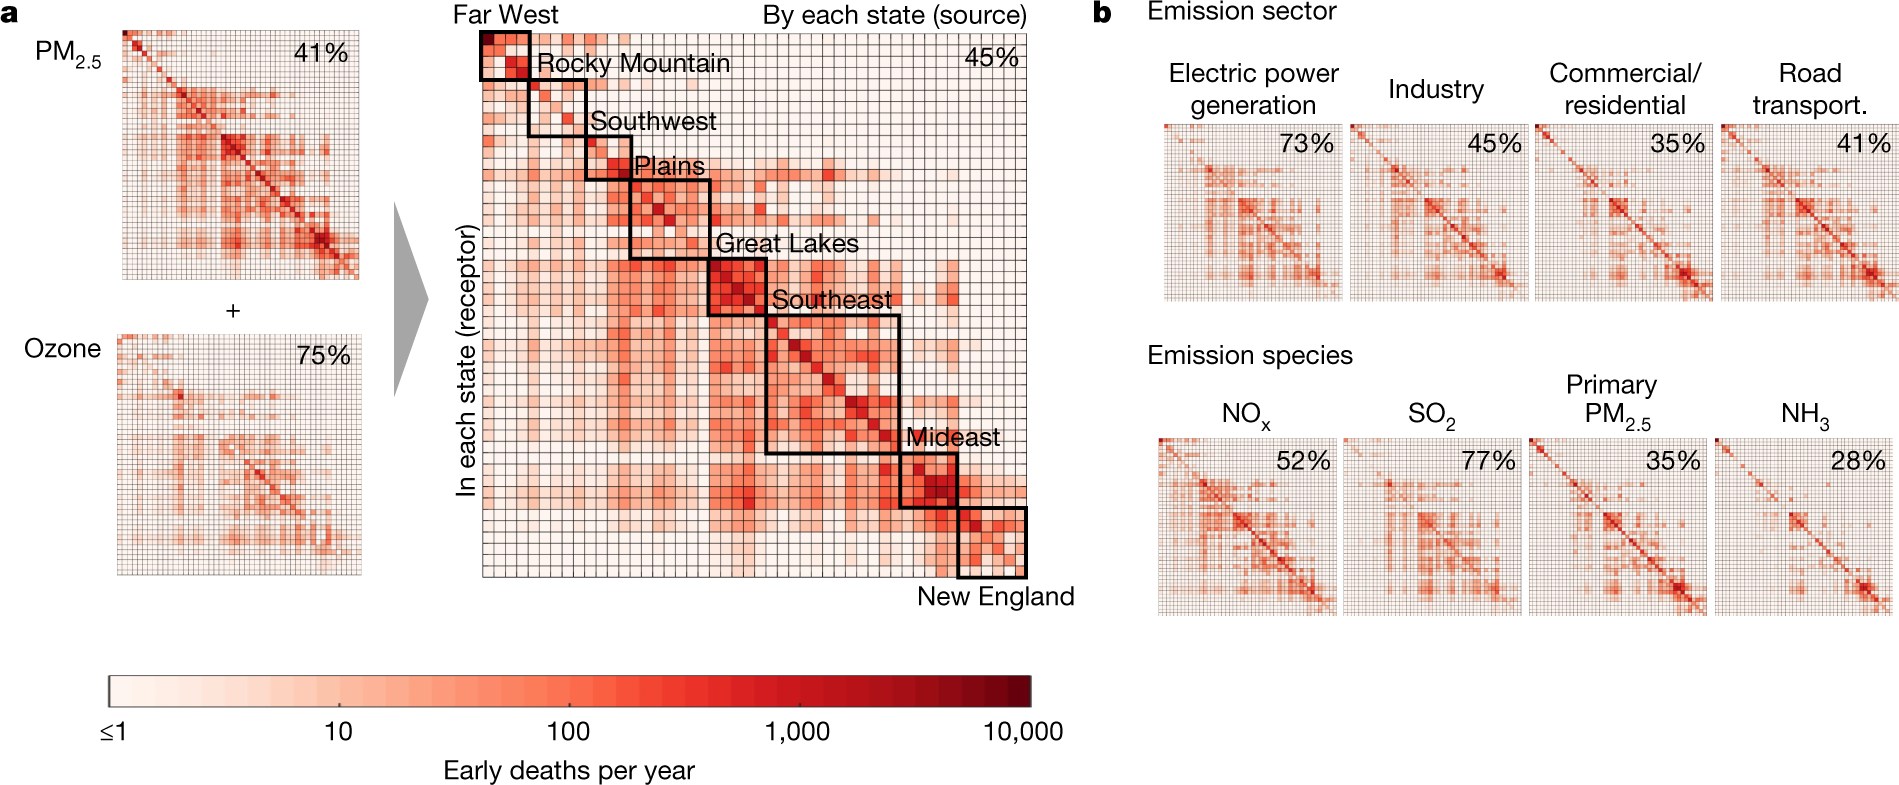
a, Source–receptor matrix showing total early deaths per year for 48 × 48 states (right), and its breakdown into PM2.5- and ozone-attributable impacts (left). b, Source–receptor early-death attribution to emission sectors (top) and emission species (bottom) that lead to the formation of PM2.5 and/or ozone. States are grouped into US Bureau of Economic Analysis regions24 and ordered west (left) to east (right) (ordering presented in Extended Data Fig. 1). Boxed percentages represent the fraction of impacts that occur out of the state that caused the corresponding emissions. Obtaining the summarized matrices shown using conventional approaches (‘forward difference’) would require 433-year-long simulations. Extended Data Fig. 2 presents corresponding matrices for 2005 and 2018.
The caption:
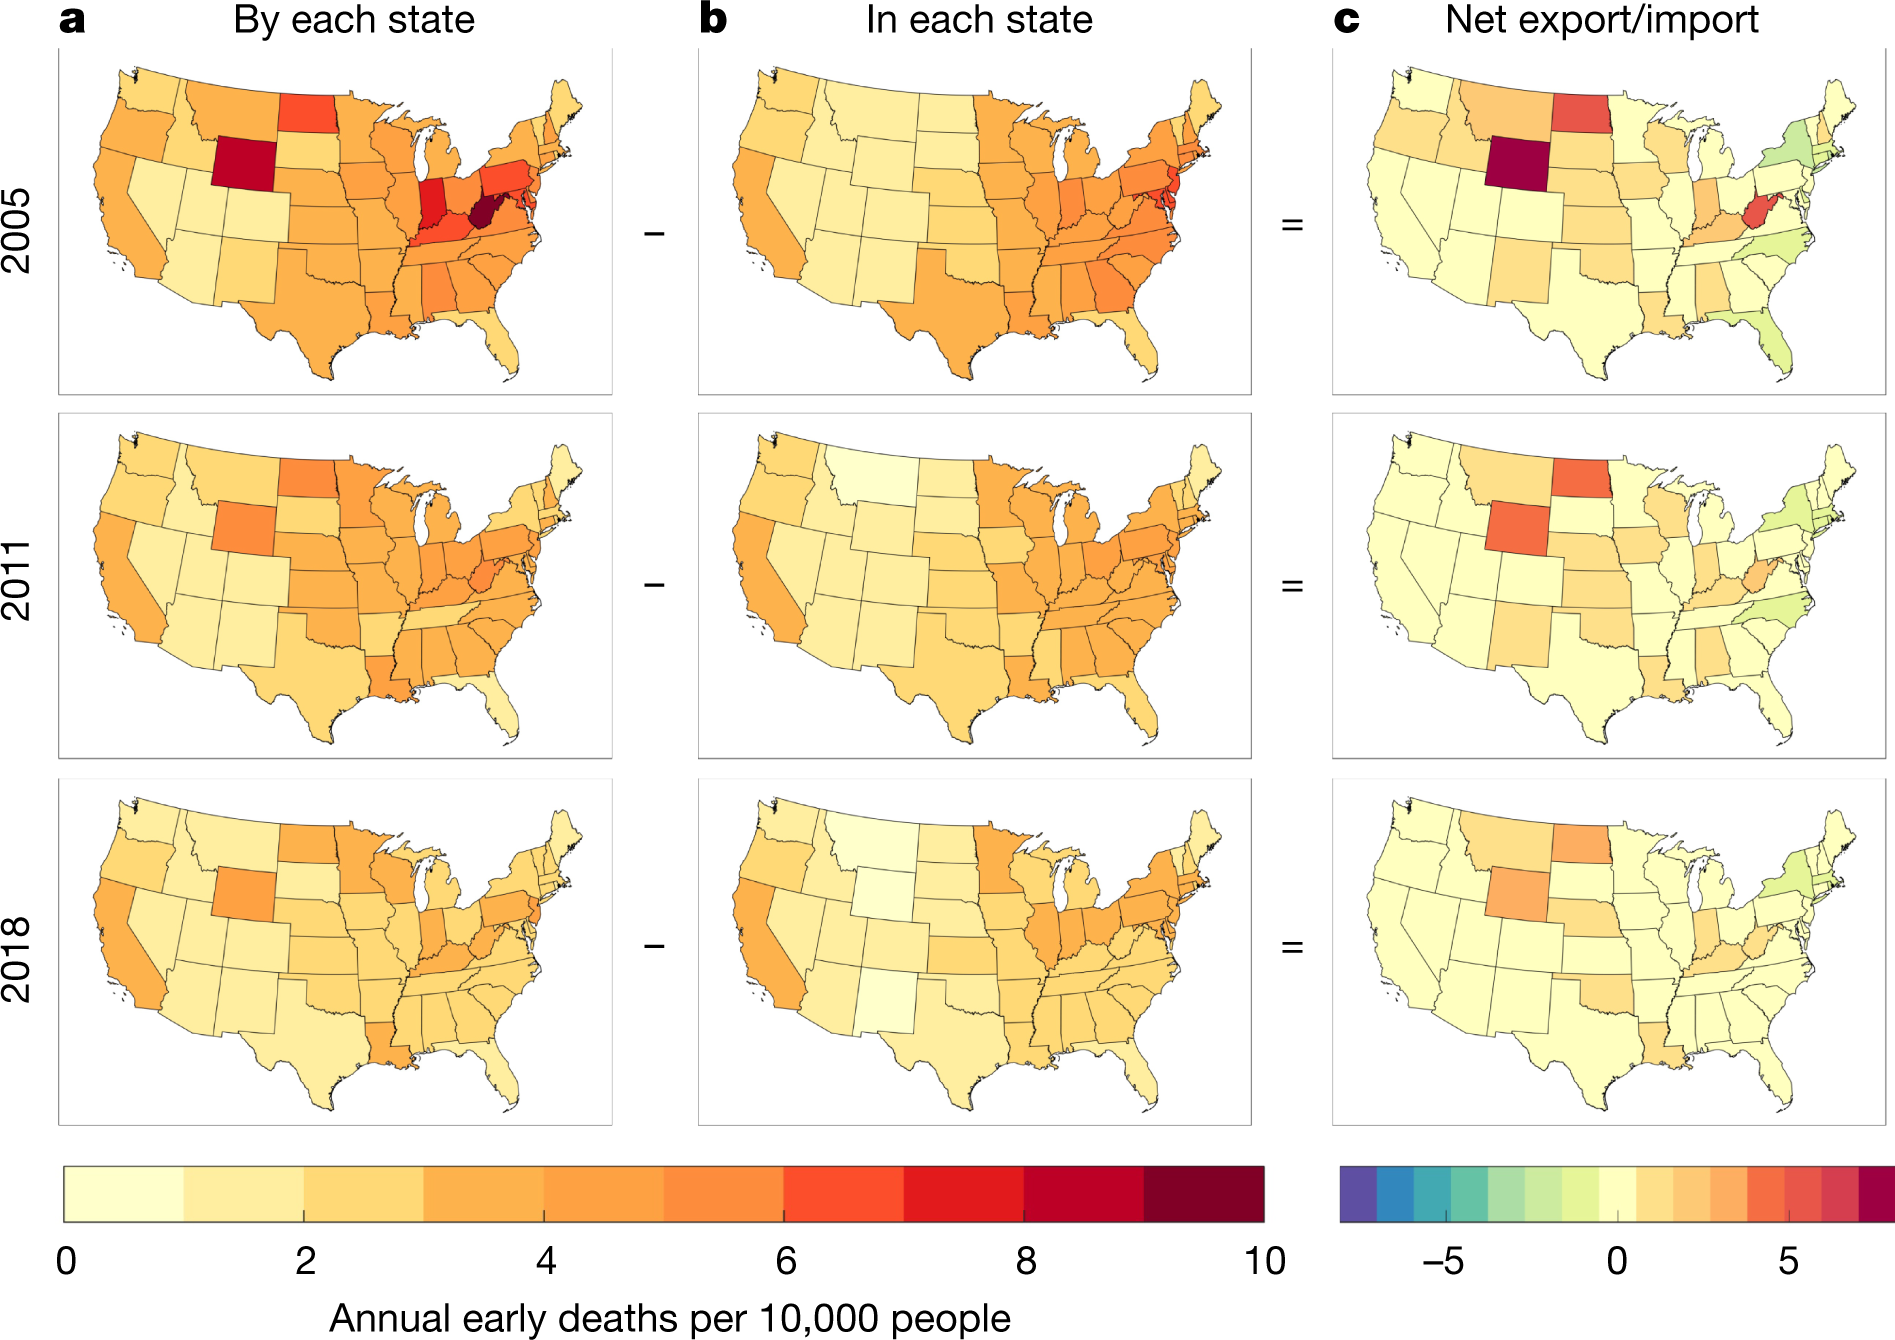
The left plots (a) show the total aggregate early deaths caused by emissions in each state, divided by the population of the emitting state. The middle plots (b) show the total early deaths caused in each state, divided by the population of the state. The right plots (c) show the total early deaths exported by each state, divided by the population of the state (that is, the difference between plots a and b). These impacts are based on summed contributions from each emitted species (see Fig. 3).
The caption:
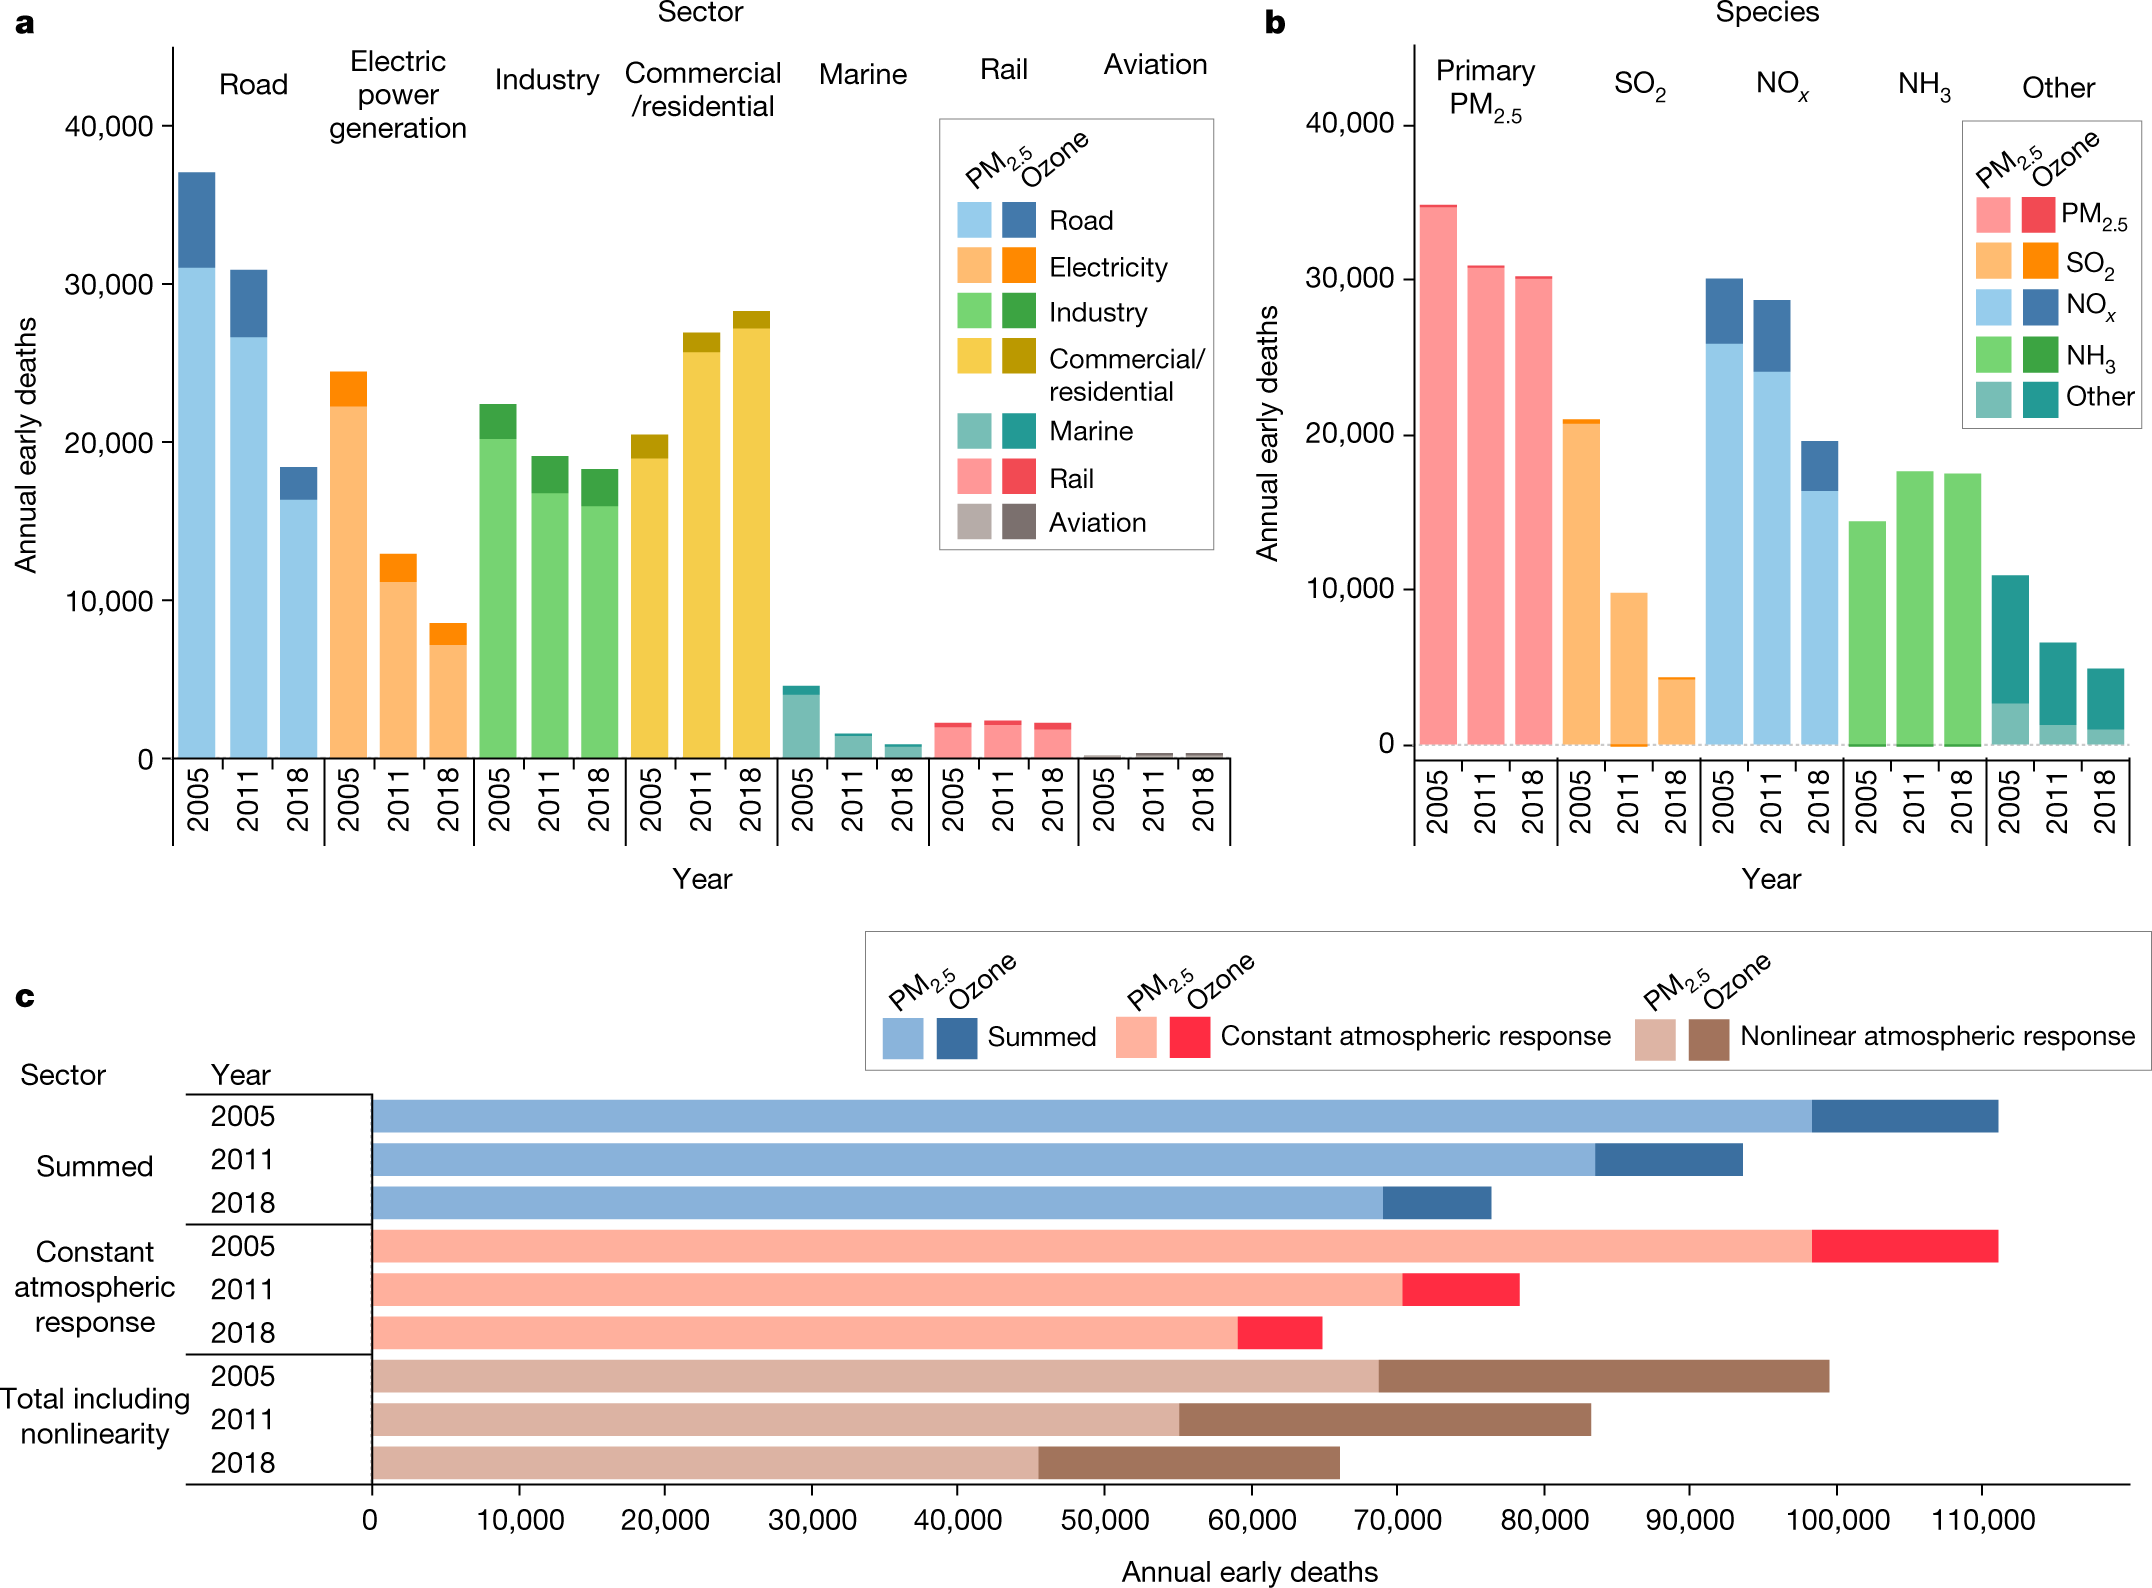
a, Total annual early deaths attributable to each emission sector. b, Total annual early deaths attributable to each emission species that leads to the formation of PM2.5 and/or ozone. c, Total annual early deaths. Data are shown for 2005, 2011 and 2018, and for PM2.5 and ozone. In c, three totals are presented: the sum of all sectors/species (‘Summed’), which does not account for nonlinear interactions between species; the sum of all sectors/species with varying emissions, but constant (2005) atmosphere (‘Constant atmospheric response’); and the total impacts after accounting for nonlinear interactions between species. Tabulated results are presented in Extended Data Table 3.
Some more text:
In terms of speciated impacts—that is, emissions species that contribute to the formation of, and exposure to, PM2.5 and/or ozone—primary PM2.5 emissions had the greatest impact in all three model years. They also stayed relatively consistent, with a 13% reduction in health impacts from 2005 to 2018. SO2—which was the third-greatest contributor to impacts in 2005, making up 19% of the summed impacts—was contributing less than 6% by 2018. This was due to an approximately 80% reduction in SO2 emissions.
Ammonia-attributable impacts increased by around 21% between 2005 and 2018. This difference was driven by an increase in the sensitivity of PM2.5 exposure with respect to a unit of ammonia emissions between 2005 and 2011. Owing to the decline in the importance of SO2, ammonia impacts went from being the fourth-greatest to the third-greatest contributor to total impacts over this period, increasingly close to the contribution of NOx species. NOx remained the second-greatest contributor to impacts from 2005 to 2018. Despite the roughly 50% reduction in total NOx emissions between 2005 and 2018, impacts attributable to NOx reduced by only around 35% between the two years. This is largely due to the increased sensitivity of PM2.5 formation to NOx emissions between 2005 and 2011, as noted previously23
Here in the United States we think that coal is dead because we've begun burning gas by utilizing a system by which we pulverize the bedrock of the continent irreversibly and in the process, probably destroy or severely damage the groundwater supply for all generations that come after us. Don't worry, be happy. We're green.
It is true that dangerous natural gas can cause particulates via Boudouard Chemistry, but overall the particulates are lower for dangerous natural gas than for dangerous coal. However the fastest growing source of energy on the planet as a whole - not that people in our racist country care about people in other countries where poor people make and/or recycle our precious stuff - has been coal.
We couldn't care less.
Don't worry; be happy. The steel for all those wind turbines we've bet the future of the planet on will be made in Chinese blast furnaces, and not in Pennsylvania. Here in New Jersey, we no longer have to breathe that shit from steel plants. They're closed and they're rotting. Pennsylvania just gives us our "clean" "transitional" natural gas now.
I trust you had a pleasant weekend. Mine was pretty good; not all the science I read was this depressing.
