A comprehensive quantification of global nitrous oxide sources and sinks
The paper I'll discuss in this post is this one: A comprehensive quantification of global nitrous oxide sources and sinks (Tian, H., Xu, R., Canadell, J.G. et al. Nature 586, 248–256 (2020))
Nitrous oxide, N2O, laughing gas, has always been a part of the nitrogen cycle, but with the invention of the Haber-Bosch process in the early 20th century, on which our modern food supply depends, the equilibrium has been severely disturbed. Since, like CFC's, nitrous oxide is both a greenhouse gas and an ozone depletion agent. I'm sure I've written in this space and elsewhere about this serious environmental issue, since it worries me quite a bit. So this paper in Nature caught my eye. The authors are a consortium of scientists from around the world, who have assembled what may be the most detailed account of accumulations of this gas in the atmosphere.
The abstract is open sourced, and may be found at the link in the paper. It is worth pointing out the cogent portions of it however:
Analysis of process-based model estimates reveals an emerging N2O–climate feedback resulting from interactions between nitrogen additions and climate change. The recent growth in N2O emissions exceeds some of the highest projected emission scenarios3,4, underscoring the urgency to mitigate N2O emissions.
From the introduction to the paper:
Nitrous oxide (N2O) is a long-lived stratospheric ozone-depleting substance and greenhouse gas with a current atmospheric lifetime of 116 ± 9 years1. The concentration of atmospheric N2O has increased by more than 20% from 270 parts per billion (ppb) in 1750 to 331 ppb in 2018 (Extended Data Fig. 1), with the fastest growth observed in the past five decades5,6. Two key biochemical processes—nitrification and denitrification—control N2O production in both terrestrial and aquatic ecosystems and are regulated by multiple environmental and biological factors including temperature, water and oxygen levels, acidity, substrate availability7 (which is linked to nitrogen fertilizer use and livestock manure management) and recycling8,9,10. In the coming decades, N2O emissions are expected to continue to increase as a result of the growing demand for food, feed, fibre and energy, and an increase in sources from waste generation and industrial processes4,11,12. Since 1990, anthropogenic N2O emissions have been reported annually by Annex I Parties to the United Nations Framework Convention on Climate Change (UNFCCC). More recently, over 190 national signatories to the Paris Agreement have been required to report biannually their national greenhouse-gas inventory with sufficient detail and transparency to track progress towards their nationally determined contributions. However, these inventories do not provide a full picture of N2O emissions owing to their omission of natural sources, the limitations in methodology for attributing anthropogenic sources, and missing data for a number of key regions (for example, South America and Africa)2,9,13. Moreover, a complete account of all human activities that accelerate the global nitrogen cycle and that interact with the biochemical processes controlling the fluxes of N2O in both terrestrial and aquatic ecosystems is required2,8. Here we present a comprehensive, consistent analysis and synthesis of the global N2O budget across all sectors, including natural and anthropogenic sources and sinks, using both bottom-up and top-down methods and their cross-constraints. Our assessment enhances understanding of the global nitrogen cycle and will inform policy development for N2O mitigation, which could help to curb warming to levels consistent with the long-term goal of the Paris Agreement.
The authors refer to "bottom up" analyses, which consists basically of multiple source terms such as known emissions, modeling of agricultural inputs based on field measurements, etc., and "top down" analyses which consist of measurements coupled to transport flux modeling. The utilize 43 N2O "flux estimates" 30 of which are "bottom up," 5 of which are "top down" and 8 models.
They write:
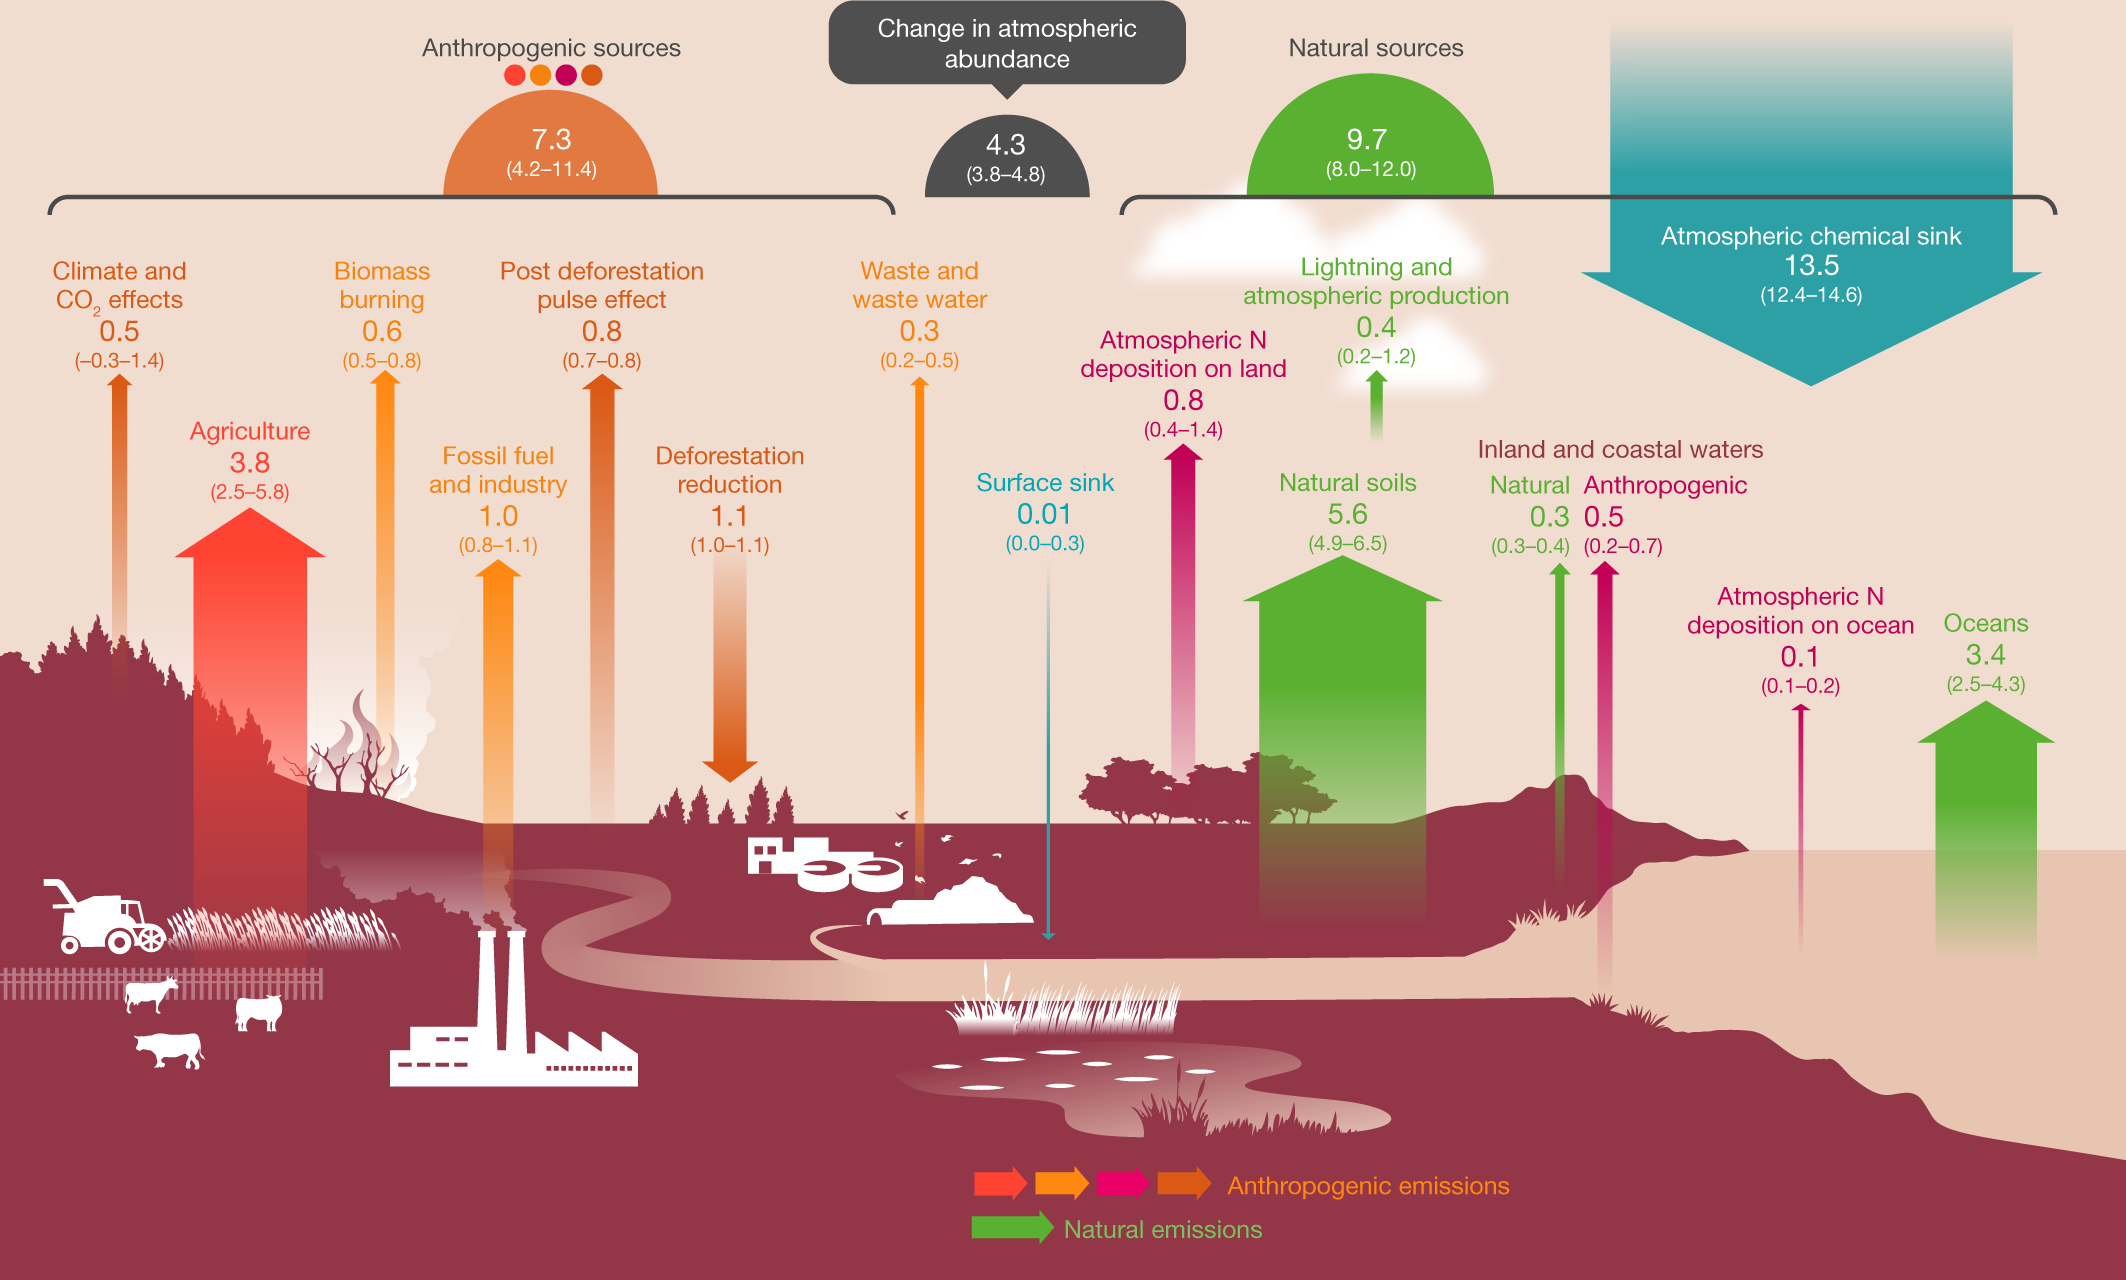
With this extensive data and bottom-up/top-down framework, we established comprehensive global and regional N2O budgets that include 18 sources and various different chemical sinks. These sources and sinks are further grouped into six categories (Fig. 1, Table 1): (1) natural sources (no anthropogenic effects) including a very small biogenic surface sink; (2) perturbed fluxes from ecosystems induced by changes in climate, carbon dioxide (CO2) and land cover; (3) direct emissions from nitrogen additions in the agricultural sector (agriculture); (4) other direct anthropogenic sources—including fossil fuel and industry, waste and waste water, and biomass burning; (5) indirect emissions from ecosystems that are either downwind or downstream from the initial release of reactive nitrogen into the environment—including N2O release after transport and deposition of anthropogenic nitrogen via the atmosphere or water bodies as defined by the Intergovernmental Panel on Climate Change (IPCC)14; and (6) the atmospheric chemical sink, for which one value is derived from observations and the other is derived from the inversion models
This cartoon figure gives a feel for sources:
Fig. 1: Global N2O budget for 2007–2016.
The caption:
The coloured arrows represent N2O fluxes (in Tg N yr−1 for 2007–2016) as follows: red, direct emissions from nitrogen additions in the agricultural sector (agriculture); orange, emissions from other direct anthropogenic sources; maroon, indirect emissions from anthropogenic nitrogen additions; brown, perturbed fluxes from changes in climate, CO2 or land cover; green, emissions from natural sources. The anthropogenic and natural N2O sources are derived from bottom-up estimates. The blue arrows represent the surface sink and the observed atmospheric chemical sink, of which about 1% occurs in the troposphere. The total budget (sources + sinks) does not exactly match the observed atmospheric accumulation, because each of the terms has been derived independently and we do not force top-down agreement by rescaling the terms. This imbalance readily falls within the overall uncertainty in closing the N2O budget, as reflected in each of the terms. The N2O sources and sinks are given in Tg N yr−1. Copyright the Global Carbon Project.
A Tg - terragram - is, of course, a million metric tons.
Isotopic analyses can show the sources, by the way, of N2O. For example, N2O in the troposphere is slightly enriched in the O17 isotope, which is believed to be connected with interactions of atmospheric ammonia and the dangerous fossil fuel combustion waste NO2.
The origin of the anomalous or “mass‐independent” oxygen isotope fractionation in tropospheric N2O (Crutzen, et al., Geophys. Res. Lett. Volume 28, Issue 3 1 February 2001 Pages 503-506)
In the paper under discussion there is a rather large table l will not reproduce here that breaks down various source inputs and outputs, natural and anthropogenic. The mean value for concentrations of nitrous oxide in the atmosphere have risen from a mean value of 1,462 Tg, 1.462 billion tons, to a mean value in the period between 2007 and 2016 of 1,555 Tg, 1.555 billion tons, an increase of 93 million tons.
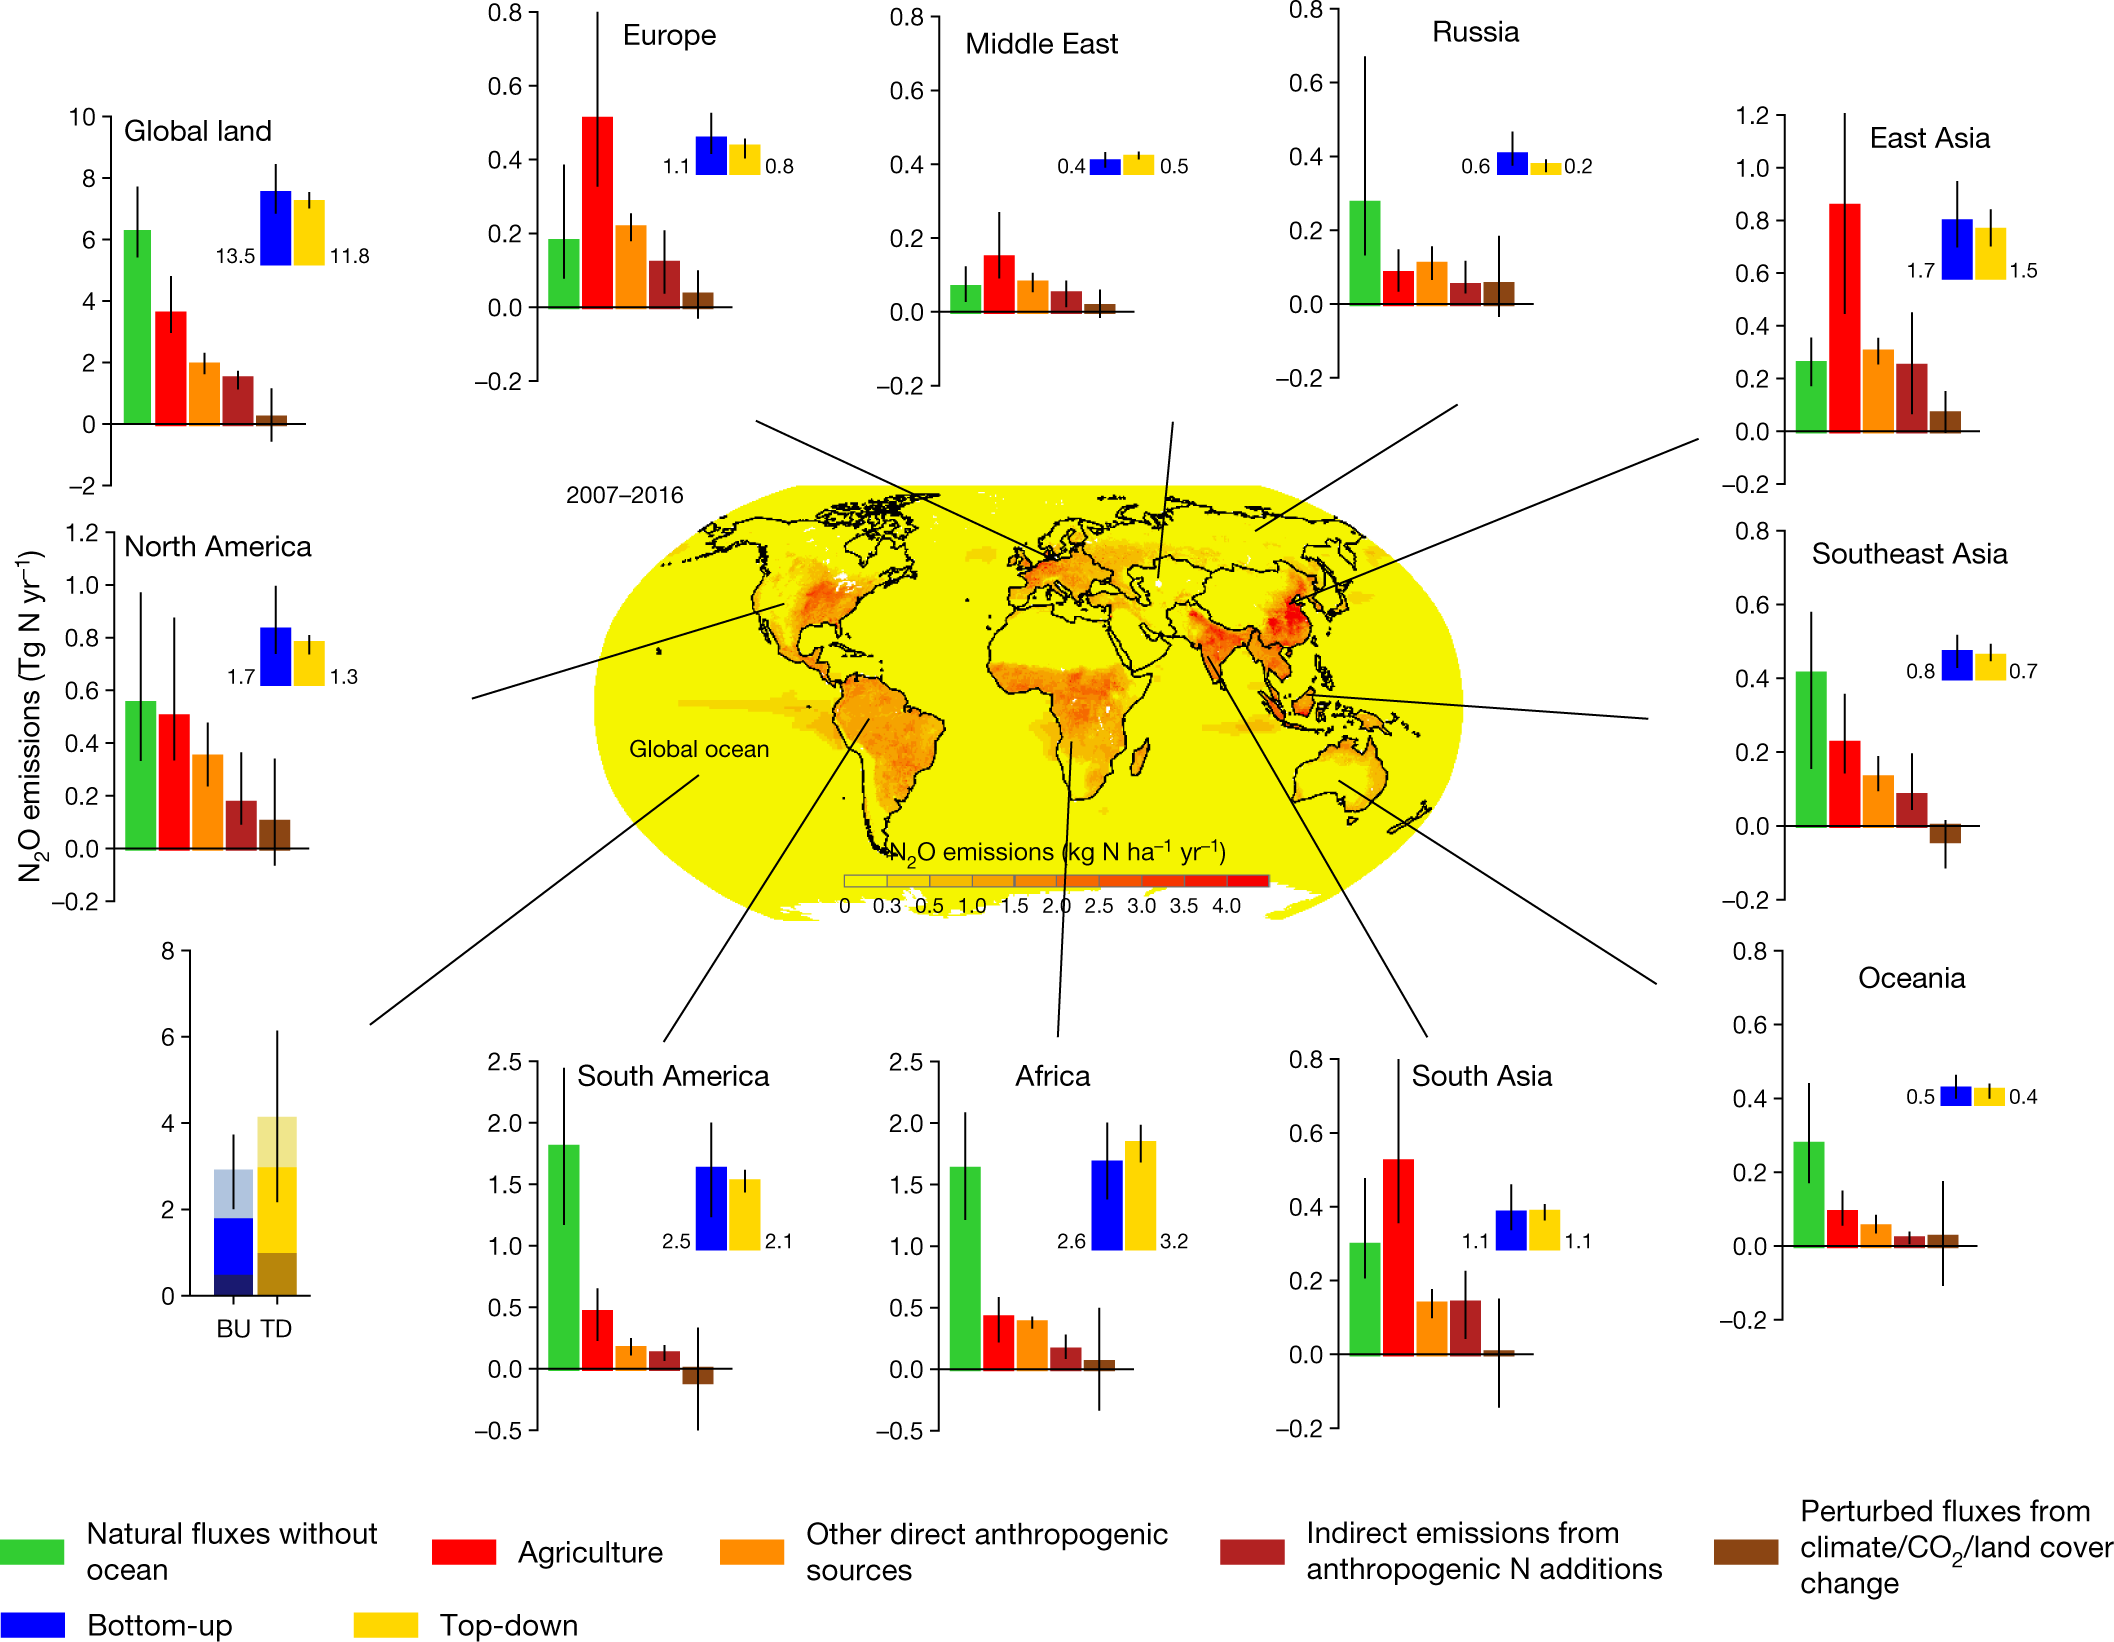
A breakdown of inputs represented graphically:
Fig. 2: Regional N2O sources in the decade 2007–2016.
The caption:
The Earth’s ice-free land is partitioned into ten regions: North America, South America, Europe, Middle East, Africa, Russia, East Asia, South Asia, Southeast Asia and Oceania. Each subplot shows the emissions from five sub-sectors using bottom-up approaches, followed by the sum of these five categories using bottom-up approaches (blue) and the estimates from top-down approaches (yellow). Bottom-up and top-down estimates of ocean emissions are shown at the bottom left (from bottom to top, lighter to darker, the contributions from the 30°–90° N, 30° S–30° N and 90°–30° S regions). Error bars indicate the spread between the minimum and the maximum values. The centre map shows the spatial distribution of 10-year average N2O emissions from land and ocean based on the land and ocean models. Per capita N2O emission (kg N per capita per year) during 2007–2016 is shown in Supplementary Fig. 2. The map was created using ESRI ArcMap 10.4.1.
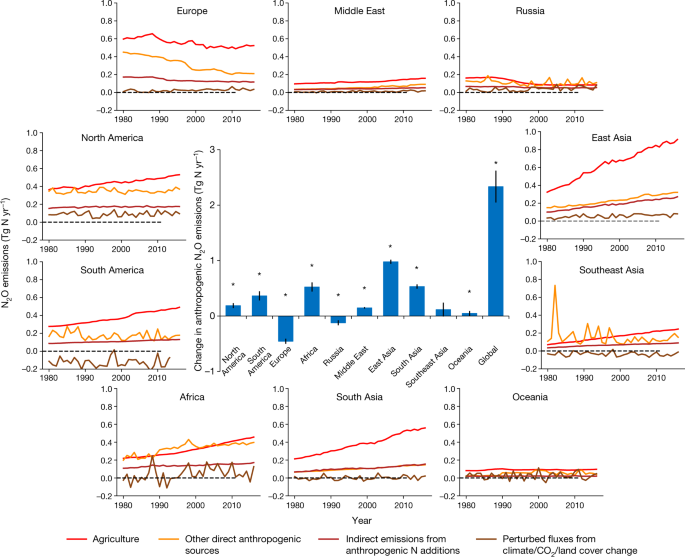
Fig. 3: Ensembles of regional anthropogenic N2O emissions over the period 1980–2016.
The caption:
The bar chart in the centre shows the accumulated changes in regional and global N2O emissions during the study period of 1980–2016. Error bars indicate the 95% confidence interval for the average of accumulated changes. The Mann–Kendall test was performed to examine a monotonic increasing or decreasing trend in the estimated ensemble N2O emissions globally and for each region over the period 1980–2016. The accumulated changes were calculated from the linear regressed annual change rate (Tg N yr−2) multiplied by 37 years. All regions except Southeast Asia show a significant increasing or decreasing trend in the estimated ensemble N2O emissions during the study period . *P < 0.05.
Predictions:
Fig. 4: Historical and projected global anthropogenic N2O emissions and concentrations.
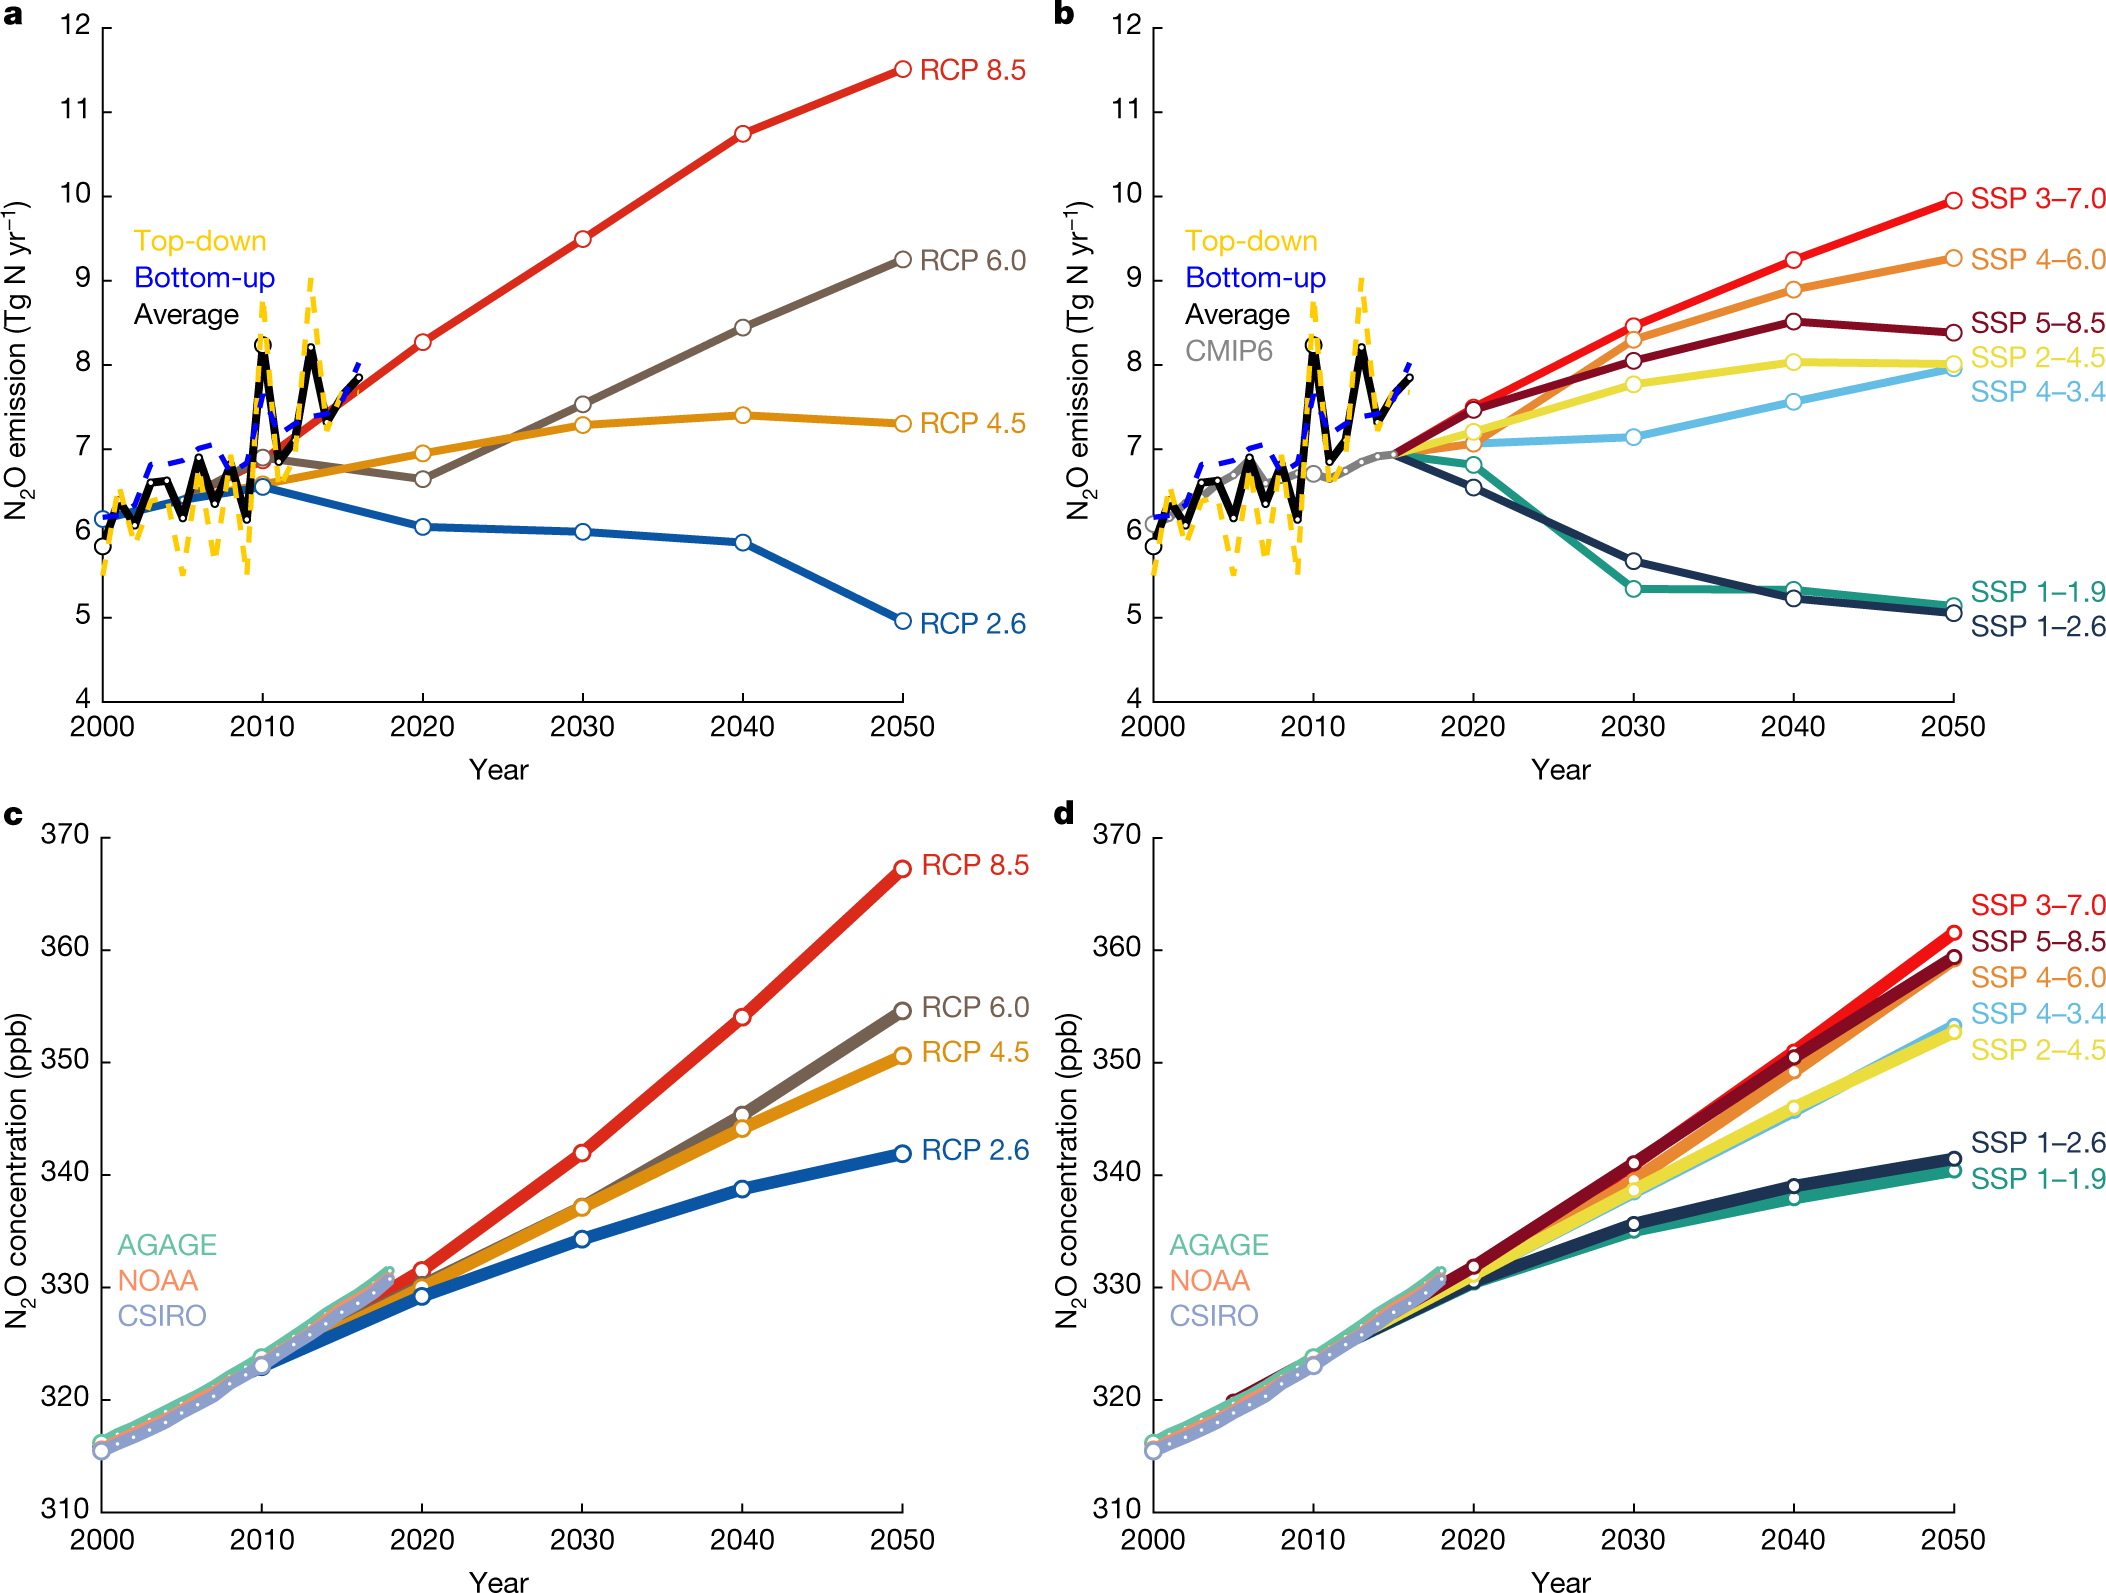
a–d, Global anthropogenic N2O emissions (a, b) and concentrations (c, d) compared to the four RCPs in the IPCC assessment report 5 (a, c; ref. 2) and the new marker scenarios based on the SSPs used in CMIP6 (b, d; ref. 48). The historical emissions data are represented as the mean of the bottom-up and top-down estimates of anthropogenic N2O emissions, whereas the historical atmospheric concentration data are from the three available observation networks: AGAGE, NOAA, and CSIRO. Top-down anthropogenic emissions were calculated by subtracting natural fluxes derived from bottom-up approaches. To aid the comparison, the four RCPs were shifted down so that the 2005 value is equal to the 2000–2009 average of the mean of top-down and bottom-up estimates. The SSPs are harmonized3 to match the historical emissions used in CMIP649; Extended Data Fig. 10 shows the unharmonized data.
These IPCC reports by the way, are bitterly comical in all of their optimistic scenarios, "RCP" Representative Concentration Pathways. Things are not even "business as usual" as described in the early editions. Things are
worse than business as usual.
This is true here. The authors write:
Observed atmospheric N2O concentrations are beginning to exceed predicted levels across all scenarios. Emissions need to be reduced to a level that is consistent with or below that of RCP 2.6 or SSP 1−2.6 in order to limit warming to well below the 2 °C target of the Paris Agreement. Failure to include N2O within climate mitigation strategies will necessitate even greater abatement of CO2 and methane. Although N2O mitigation is difficult because nitrogen is the key limiting nutrient in agricultural production, this study demonstrates that effective mitigation actions have reduced emissions in some regions—such as Europe—through technological improvements in industry and improved efficiency of nitrogen use in agriculture.
Nitrous oxide will support combustion; it is an oxidizing gas. In theory it would be reduced by fire, but in general, combustion also generates significant higher nitrates, NO and NO2 which are ultimately transformed into N2O.
The main sink is photolytic, at wavelengths below 230 nm, which is in the UV range. Singlet oxygen, a high energy state of oxygen gas, also can destroy N2O. It is also generated by radiation, as well as some chemical means.
In recent years, I have come to think of air as a working fluid in Brayton cycle/combined cycle power plants. I've returned to an old idea about which I thought much in the 1990s and early 2000's - although they were not directed at that time to Brayton cycles, but rather as Rankine cycles, which is to use highly radioactive materials as heat transfer agents, in those days, salts in the liquid phase, in these days salts and metals in the vapor phase. Under these circumstances, new sinks for highly stable or highly problematic greenhouse and ozone depleting agents, as well as particulates, might represent a new sink for not just nitrous oxide, but others.
I trust you are enjoying a safe, productive, and enjoyable weekend.

 = new reply since forum marked as read
Highlight:
NoneDon't highlight anything
5 newestHighlight 5 most recent replies
= new reply since forum marked as read
Highlight:
NoneDon't highlight anything
5 newestHighlight 5 most recent replies