Science
Related: About this forumA 10 per cent increase in global land evapotranspiration from 2003 to 2019
The paper I'll discuss in this post is this one: Pascolini-Campbell, M., Reager, J.T., Chandanpurkar, H.A. et al. A 10 per cent increase in global land evapotranspiration from 2003 to 2019. Nature 593, 543–547 (2021).
I have to make a guilty confession that back in the 1970's, when I was a young man, I used to take seriously articles about "studies" which "showed" that the world "could" run on "100% renewable energy" "by 1995" and then "by 2000," then "by 2010," then "by 2020." Now, I read about "by 2050," or "by 2040," even. Of course, I know longer take these prayerful chants seriously, since at least later in my life, I took it upon myself to seriously look at reality.
Reality consists of facts. Facts matter.
That huge powerful so called "renewable energy" device, the Hoover dam, holds back an artificial lake, Lake Mead.
Here is a compilation of the elevation of Lake Mead's surface, going back to the beginning of the reservoir's filling, beginning in 1935, thus destroying and strangling the Colorado River Delta ecosystem in Mexico: LAKE MEAD AT HOOVER DAM, END OF MONTH ELEVATION (FEET)
Since 1935, Lake Mead has been lower than 1080 feet at the end of any month, as it was at the end of April 2021, 61 times. Twenty eight of those times were recorded in the 1930's, while the "lake" was filling. The other 33 times have all taken place since April of 2015.
Lake Mead first reached an elevation of 1200 feet in 1941. The highest elevation ever recorded 1225.44 feet, was in July of 1983. The lowest ever recorded was 1071.64, recorded in July of 2016.
Anyone want to take any bets on whether there will be a new record low in 2021?
They're not taking bets over at CNN: First-ever Colorado River water shortage is now almost certain, new projections show
The US Bureau of Reclamation (USBR) forecasts the lake's levels to continue to decline, without any sign of recovery through at least the end of 2022.
Don't worry. Be happy. 100% "renewable energy" by...by...by...by...whatever.
Until the Godotian "renewable energy nirvana" breaks out, I wouldn't advise investing in Golf Courses in the Phoenix area, for that matter, in Las Vegas, or the LA area.
The global water cycle is severely disturbed. I personally attribute this fact - facts matter - to the mentality that states "nuclear energy is 'too dangerous.'" Climate change isn't "too dangerous," however, apparently, to the people proudly wearing this mentality. Also I hear "nuclear energy is 'too expensive.'" Drying out the entire western United States is not "too expensive," however.
Of course, I'm nowhere near as smart or as famous as say, Robert F. Kennedy, who is anti-nuke, anti-dam, anti-wind, anti-fossil fuels, anti-vax, anti-GMO, anti-this, anti-that. Of course, like most people born into wealth he did nothing to earn, he is decidedly not anti-poverty. He couldn't care less about people living in sun baked mud huts burning sticks and dung to cook their food, with no access to even primitive improved sanitation, people compelled to defecate in the open because well, Robert F. Kennedy Jr. thinks that vaccines, nuclear power plants, dams, etc. are "too dangerous." Children dying from diarrheal diseases because of a lack of sanitation, clean water, and energy, or for that matter from the lack of access to a vaccine, is not "too dangerous."
By the way, Robert F. Kennedy Jr. - as one can see in the first link involving him above - is suing Daily Kos, and although I have no use for Daily Kos, I certainly support Markos's efforts to prevail against Kennedy's case, which is about anonymity on blogs. It doesn't merely affect Kos; it affects all of us. So let's wish Markos "good luck!."
Markos banned me from Daily Kos after I cited a paper by the climate scientist who used to be a hero at Daily Kos, until he wasn't, Jim Hansen. The paper was this one, which I still cite often, as I find the statements, facts and conclusions therein irrefutable:
Prevented Mortality and Greenhouse Gas Emissions from Historical and Projected Nuclear Power (Pushker A. Kharecha* and James E. Hansen Environ. Sci. Technol., 2013, 47 (9), pp 4889–4895)
After citing the paper, I remarked, in crude language that I will only paraphrase as I've mellowed in the years since I was invited to leave Kos, that if what Jim Hansen wrote in the paper is true - and I contend it is true - then opposing nuclear energy is murder.
This, I'm sure, was and is a true statement.
Facts matter.
It's not like I claimed that the events January 6, 2021 at the US capitol involved excited tourists.
Go figure.
One anti-science anti-nuke suing another. It doesn't get any better than that, although, frankly, it's a little obscene, under the circumstances, to engage in Schadenfreude. We are all, every human being on the planet, suffering from the result. If it were possible that a reactionary return to so called "renewable energy" could save the world, if it had saved the world, no reasonable person could have objected.
But it didn't save the world. It isn't saving the world. It won't save the world.
But my small whiny personal concerns are trivial; in the not too distant future, certainly "by 2050," I will have "shuffled off this mortal coil," as Willie the Shake so eloquently put it. I will say though, that we on the left need to "think anew," about energy. Our thinking on the left has exactly the same result as what passes for "thinking" on the right:
The global water cycle is changing rapidly and the consequences are very real.
From the introduction to the paper:
Previous studies have shown that the estimation of continental to global ET is quite challenging, and it is likely that this flux still represents the most uncertain term in the global water budget. The lack of an observational constraint on global land ET makes it difficult to evaluate the trends and drivers of global ET calculated from different methodologies (Extended Data Table 1). Using eddy covariance observations and machine learning, a study found that global ET increased between 1982 and 1998, but then decreased from 1998 to 2008 due to limited water supply19. Other studies have also found evidence of increasing ET in recent decades: a study using the Global Land Evaporation: the Amsterdam Methodology (GLEAM) model constrained by satellite observations detected a positive trend over 1980 to 2011, and found that decadal ET was dominated by natural variability associated with El Niño–Southern Oscillation (ENSO)20, whereas a different study also found a positive trend, but detected varying relationships among models and remote-sensing products with tropical Pacific variability21...
...Here we present a direct mass-balance (that is, top down) estimate of monthly global land ET based on Gravity Recovery and Climate Experiment (GRACE) and GRACE-Follow On (GRACE-FO) satellite observations13. At basin scales, the mass conservation equation requires discharge (Q) at the mouth, total Pr over the basin and basin water storage change to calculate ET as a residual. With GRACE providing the water storage changes, water budget estimates of ET have proven effective in providing independent constraints regionally24,25,26,27,28,29 and globally30,31. In previous work, we applied this method to evaluate ET products for major basins in the continental United States, and found that even aggregating at the basin scale produced biases in remote-sensing and model-based methods compared with water-balance closure25.
At global scales, accurate knowledge of Q remains challenging given the sparsity of coastal stations32. However, this can be addressed by calculating global discharge with an ocean mass-balance approach33,34, and this study uses novel estimates of global Q that do not rely on gauges or models. The water-balance variables are entirely independent: the precipitation data are averaged over land areas, whereas the discharge estimates close the ocean mass balance using data exclusively from ocean areas...
Some images from the paper:
Fig. 1: Water-balance seasonal cycles.
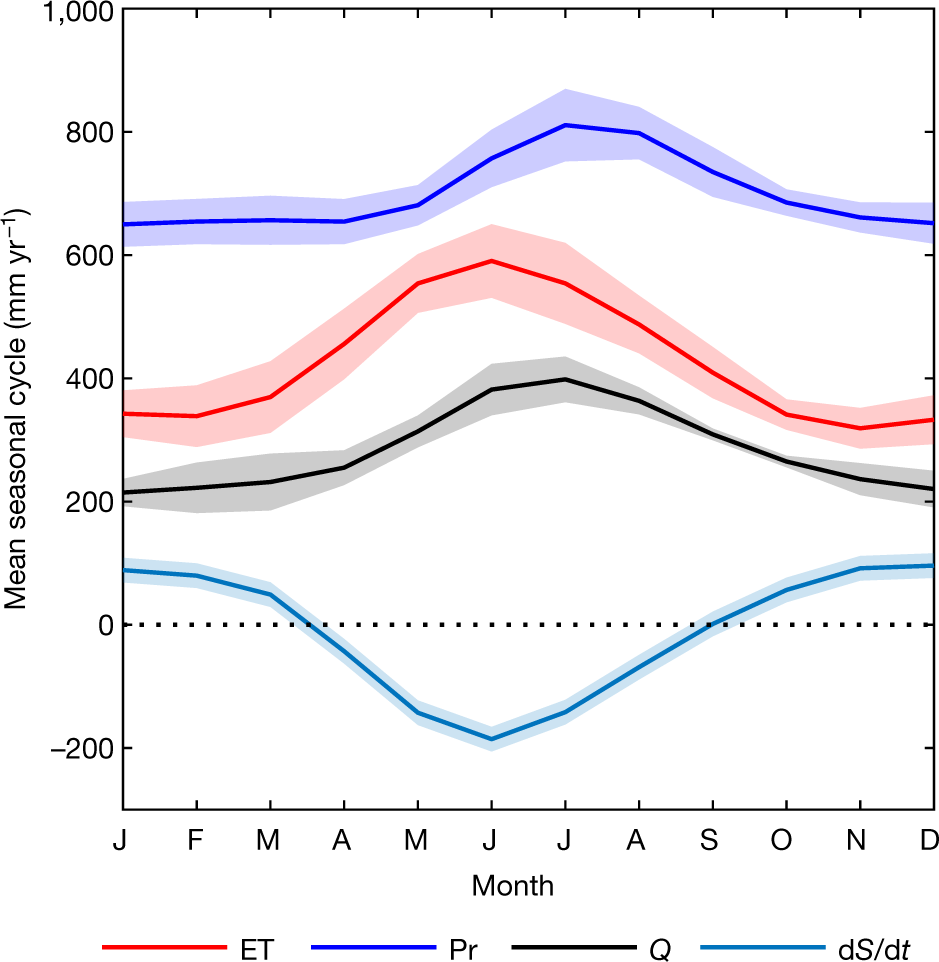
The caption:
As for what dS/dt is there's this text:
Fig. 2: Comparison of ET with other products.
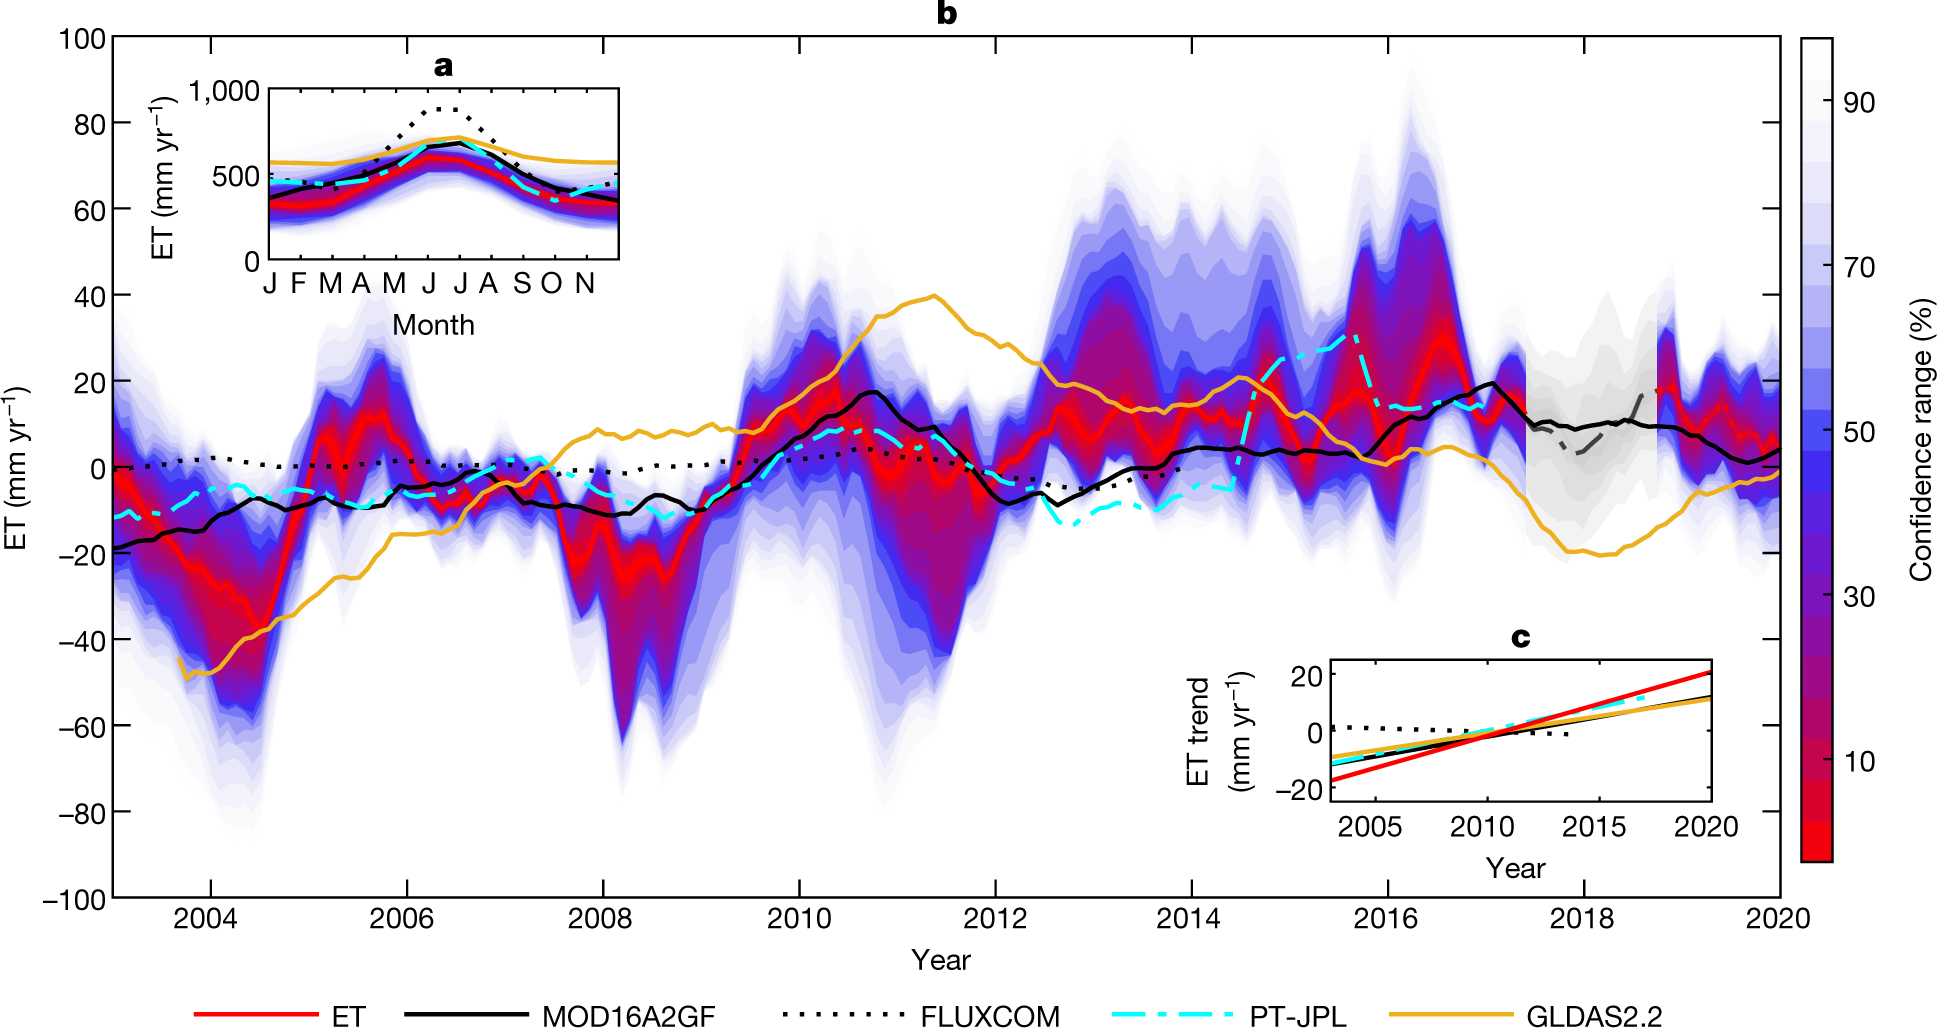
The caption:
Fig. 3: Trends in the water balance.
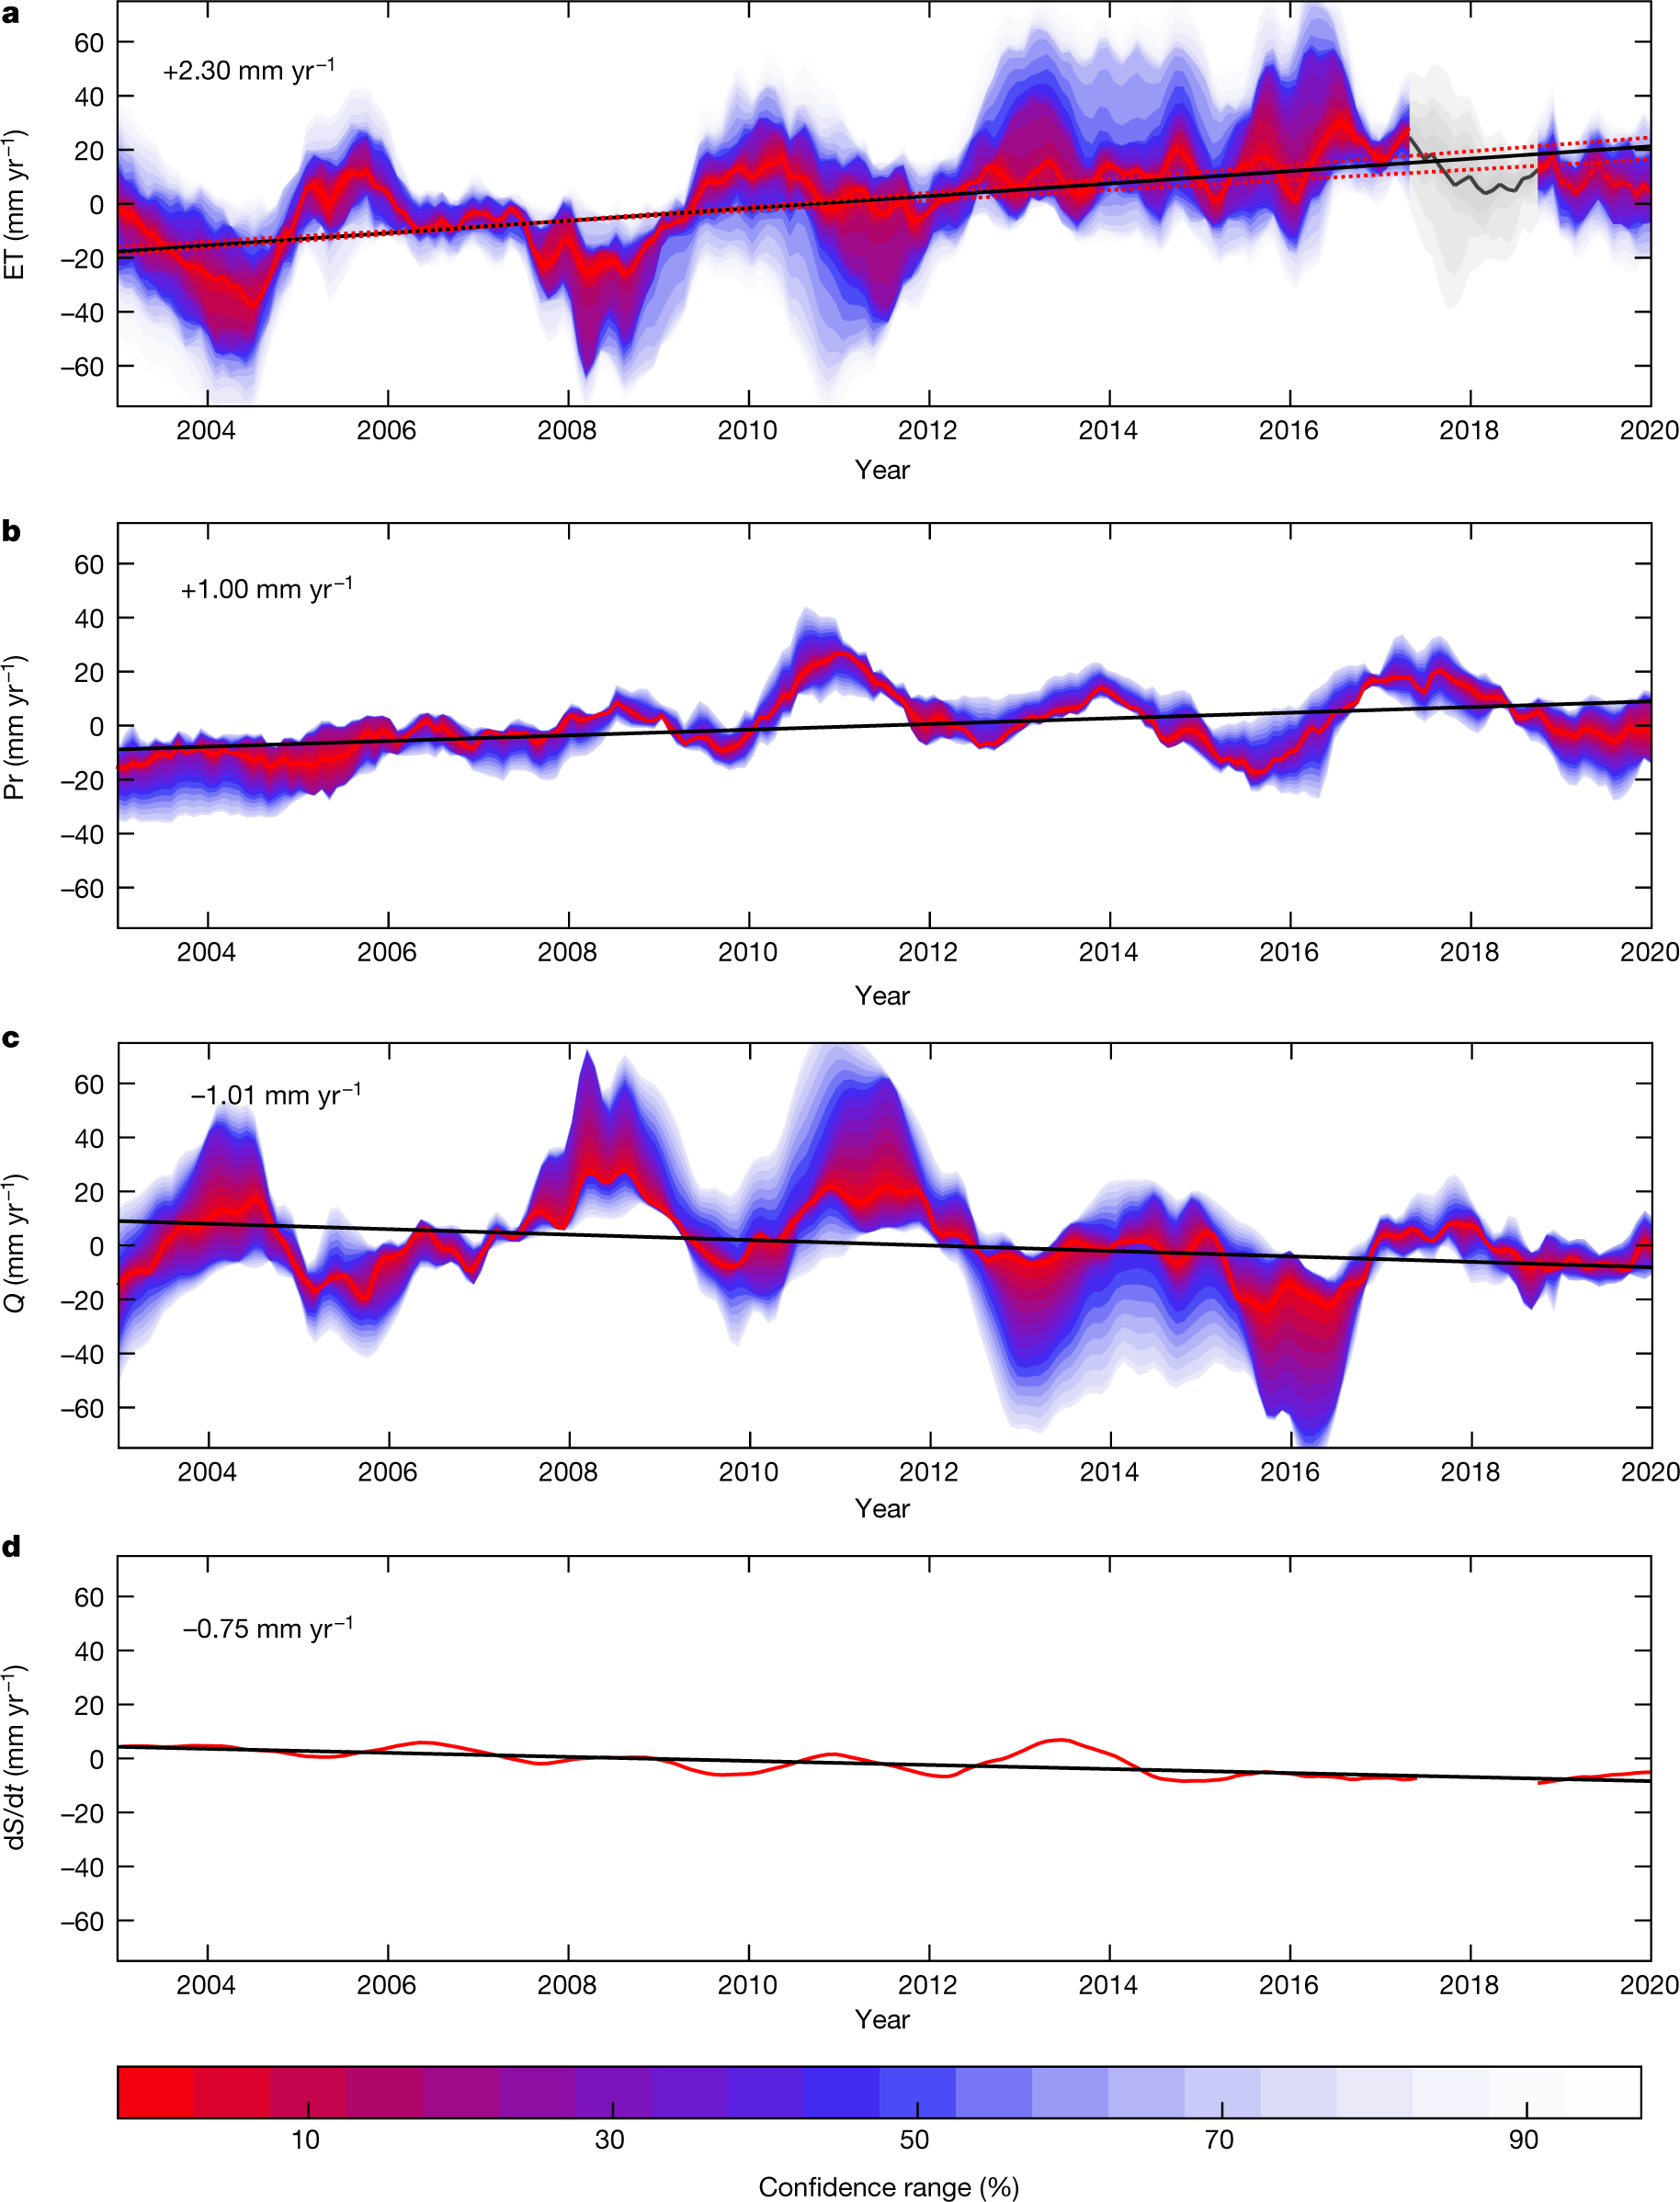
The caption:
Some additional text:
ET increased over 2003 to 2019 with a significant positive linear trend of 2.30 ± 0.52 mm yr−1, corresponding to an increase of approximately 10 ± 2% above the global mean ET. The trend is significant even in light of the gap filling and error of the input data. The positive trend results from the interaction of all water-balance components: a positive trend in Pr, coupled with negative trends in Q and dS/dt. Pr is also increasingly partitioned into ET and not Q, which has implications for water availability. The observed increase in ET is consistent with previous studies20,22,23.
A 10% increase in ET represents an increased loss of water from land with potential implications for water resources, climate and agriculture. Higher ET fluxes can also influence the land–atmosphere energy exchange and produce surface cooling from enhanced latent heat fluxes37. In the context of our results, which indicate that the positive ET trend is due to warming, this could create a negative feedback mechanism to counteract warming. We note that our global ET estimate is a bulk estimate, and therefore cannot highlight specific hotspots of global change, and future regionally based work is needed to identify regional variations.
On the basis of the present findings, there is more of an apparent effect of temperature rather than ENSO variability on the trend in ET. This finding is consistent with the premise that the water cycle will intensify in a warming climate due to greater atmospheric demand1. Global land surface temperature variability explains most of the variability in ET (54%), whereas natural climate variability associated with ENSO explains only 17%...
The conclusion of the paper is rather dire, but well...don't worry be happy.
"By 2050..."
I trust you will enjoy the Memorial Day weekend. It's going to rain most of the weekend in New Jersey, and that, I think, may be a good thing. I worry all the time about droughts, and it's not entirely an artifact of having once lived in Southern California.

 = new reply since forum marked as read
Highlight:
NoneDon't highlight anything
5 newestHighlight 5 most recent replies
= new reply since forum marked as read
Highlight:
NoneDon't highlight anything
5 newestHighlight 5 most recent replies

cstanleytech
(28,312 posts)causing problems as it only stands to reason that its bound to have some sort of impact.