2016 Postmortem
Related: About this forumAbout the latest angst from 538...
fivethirtyeight.com came out with this late yesterday:
http://fivethirtyeight.com/features/election-update-national-polls-show-clintons-lead-stabilizing-state-polls-not-so-much/
It's been interesting to watch 538's national trend as it hacks into into Hillary's lead every day:
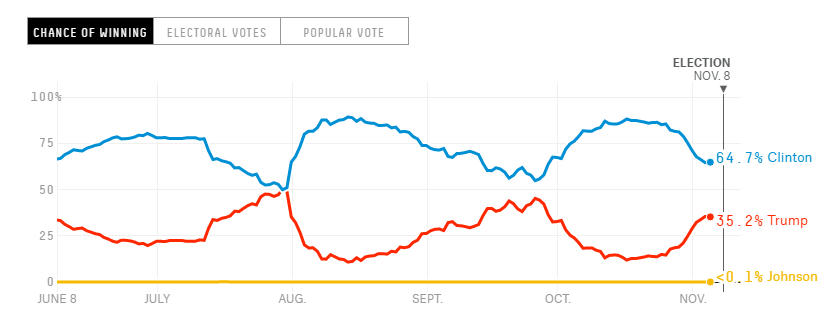
But, we all know that the national poll is meaningless -- it's ONLY the state polls that matter. So, 538's article was disturbing.
As it happens, I decided to kill thirty minutes of my lunch hour yesterday, and I loaded all 538's "predicted margin of victory" data into a spreadsheet (current as of noon Friday EDT). I do this to let me push the numbers around and draw my own conclusions. So, being very familiar with their numbers, I found it quite curious to see all the hand wringing in this morning's article. So. I went back to the spreadsheet and entered all of today's numbers from 538 (as of 3 pm EDT). It was remarkable that, with only 6 exceptions, 538's predictions for every single state ticked toward Trump by at least 0.2% and as much as 2.5%, with an average of about 1%. This makes no sense. Polling data doesn't move like that in 24 hours with absolutely nothing else going on. This swing, by the way, was indeed ground shaking for Clinton. Her "solid" electoral votes (using this 538 data set) dropped by about 10; Florida and Nevada swung from virtual ties into the Trump column.
The only way this trend in 538's predictions could make sense would be if new polling data showed an across-the-board swing toward Trump. So, I checked the polls, and the only new data were from Survey Monkey, who released data for just about every state. There was movement both ways, but Florida and New Hampshire were most interesting. Florida, which 538 had in 24 hours swung from 0.2 for Clinton to 0.2 for Trump, showed no change in Survey Monkey, who continue to show HRC with a 2% lead. Only one poll in Florida during the last week has favored Trump (Remington), while the other seven polls favor Clinton. New Hampshire, according to 538, dropped from a 3% HRC lead to less than 2% overnight, whereas the only new poll (Survey Monkey) gives HRC a 10 point lead.
538 also brought up Michigan as an example of concern: they ticked their projection from 4.2% victory for Clinton to 3.8%. The new Survey Monkey poll was unchanged and a new PPP poll gives MI to HRC by 5%.
I am not buying into 538's pronouncement of a tightening race. It's stable. Clinton's lead is comfortable. If you take the straight polling numbers from pollster.com and add up the electoral votes, you get this:
Electoral votes in states with a lead significantly greater than margin of error:
HRC: 268, Trump 164
Add in those states at the margin of error:
HRC: 301, Trump 170
 = new reply since forum marked as read
Highlight:
NoneDon't highlight anything
5 newestHighlight 5 most recent replies
= new reply since forum marked as read
Highlight:
NoneDon't highlight anything
5 newestHighlight 5 most recent replies

StrictlyRockers
(3,934 posts)He's been so wrong lately. Sure he was accurate four years ago and eight years ago, but lately, nahhh.
Buzz Clik
(38,437 posts)...when his projections essentially all shift toward Trump with no data in the polls to support that shift, then I throw up my hands.
I have some very cynical explanations for this, but not now. I'm content to wait, relying more on these guys:
http://election.princeton.edu/electoral-college-map/
http://elections.huffingtonpost.com/pollster

AgadorSparticus
(7,963 posts)Thanks for posting your findings!

manicraven
(901 posts)
dogindia
(1,345 posts)Talking to the FBI perhaps. This is strange and sad.

redstateblues
(10,565 posts)More like the cable media.
Buzz Clik
(38,437 posts).... yeah. That's pretty close to my cynical explanation.

underpants
(197,834 posts)Your totals at the bottom don't add up to 538.
Buzz Clik
(38,437 posts)A handful of states fall within the gray area of "statistical tie." I did not add their electoral votes to the totals.
But, for the sake of completeness:
All states with even a slight lead for a given candidate:
HRC: 322
Trump: 216
underpants
(197,834 posts)Below is not the best version I have do this but, I think, it gives a good picture of the scope of the difficulty any Republican faces in a national election.
I'd heard numbers bandied about on where Democrats START national campaigns.
2012 is a good starting point. 2008 included the Indiana anomaly.
Obama 332
Romney 206
Take away from Obama's total
Nevada 6
Colorado 9
New Mexico 5
Iowa 6
Virginia 13
Ohio 18 AND Florida 29
You get 246. A Democrat has to pick up 23 Electoral College votes in any of those states to win.
The Republicans start with 206 and that includes N. Carolina.

obamanut2012
(29,678 posts)as you, because I'm not a numbers/maths expert.
VERY well done btw!