It's a couple of years old.
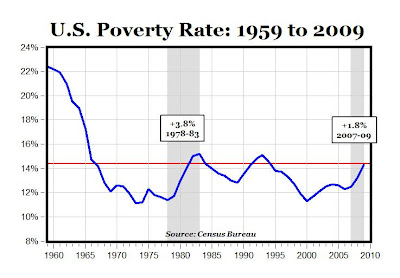
Except that the numbers mask a lot of changes. GS kicked in with the poverty rate plummeting; it was already down to 15% and kept going down. (A lot of the '60s big pushes were like that: The problem had been bad, was getting a lot better, but people remembered how bad it was and didn't notice or wanted to accelerate the improvements).
There are a lot of things in those numbers, some cyclical and some secular.
The biggest short-term factor is employment. You can track recessions in the poverty rate.
The biggest factor long-term is family structure changes. If we had the same proportion of two-parent families we had in 1965 you'd see a much smaller poverty rate. Changes in family structure give an upward tilt to the entire graph after about 1970. One-parent families tend to be much more sensitive to employment patterns and amplify the effects of a recession. They're less resilient. This drowned out the effects of late '80s prosperity, and made the mild early '90s recession look at lot like the much harsher late '70s/early '80s recession.
If fertility was constant across socio-economic statuses, you'd see a much smaller poverty rate. As it is now, single-parent households are more likely to have more kids than upper-middle class households. That means a smaller wealthy population so most population growth is among those more likely to be poor. That gives a slight upward tilt to the graph after about 1980.
Other things also matter. The uneven increase in wages and health care has an effect. Baby booms matter. Even the incidence of part-time and summer jobs matters.
What's stunning is that this graph is
after taking into account most transfer payments. In 1970 structural unemployment was considered to be something like 6%. 4.5% unemployment 35 years later should have lowered the poverty rate by a lot--but the rate was the same. Much higher transfer payments and much lower unemployment were completely defeated by the combined effect of family structure, wage stagnation, and differential fertility rates.

 = new reply since forum marked as read