Welcome to DU!
The truly grassroots left-of-center political community where regular people, not algorithms, drive the discussions and set the standards.
Join the community:
Create a free account
Support DU (and get rid of ads!):
Become a Star Member
Latest Breaking News
Editorials & Other Articles
General Discussion
The DU Lounge
All Forums
Issue Forums
Culture Forums
Alliance Forums
Region Forums
Support Forums
Help & Search
General Discussion
In reply to the discussion: For anyone who doesn't believe entitlements + interest on the debt will crowd out all other spending [View all]
DreamGypsy
(2,252 posts)57. I am not disputing the fact that the MyGovCost website is spinning data to support its purposes...
...or that the Mother Jones article is spinning the data to support its purposes.
It just happens that the charts shown on the MyGovCost site, labeled Chart 5 and Chart 6, are exactly the same as the charts identically labeled on pages 5 and 6 of the pdf for A Citizen's Guide to the 2012 Financial Report of the U.S. Government downloaded from the US Treasury website. Did you happen to notice that? Yes, they made a copy of the graphics ... probably because they couldn't link directly to the pdf.
Both charts appear in the section of the report entitled Where We Are Headed, which begins on page 5 (well, actually page v - the page numbers are Roman numerals). The text on pages v and vi that surround the first graphic reads as follows:
Receipts, Spending, and the Debt
Chart 5 shows historical and current policy projections for receipts, non-interest spending by major category, and total spending expressed as a percent of GDP. The difference between the receipts and noninterest spending shares of GDP - the primary deficit-to-GDP ratio, grew rapidly in 2009 due to the financial crisis and the recession, and the Federal Government’s response. The ratio stayed large from 2010 to 2012 despite shrinking in each successive year, but is projected to fall rapidly between 2013 and 2018 as the economy recovers and spending reductions called for in the BCA take effect, reaching primary balance in 2018, and remaining relatively flat and near zero until 2021. Between 2022 and 2039, however, increased spending for Social Security and health programs due to continued aging of the population and anticipated rising health costs is expected to cause the primary deficit- to-GDP ratio to steadily deteriorate, reaching 2.3 percent of GDP in 2039. After 2039, the ratio is projected to slowly decline to 1.7 percent of GDP in 2087 as the impact of the baby boom generation retiring dissipates. In these projections, the Affordable Care Act (ACA) 7 provision of health insurance subsidies and expanded Medicaid coverage boost federal spending, and other provisions significantly reduce per-beneficiary Medicare and Medicaid cost growth. Overall, the ACA is projected to substantially reduce
federal expenditures over the next 75 years. However, as noted in the Report, there is uncertainty about the effectiveness of the ACA’s provisions designed to reduce health care cost growth. Even if those provisions work as intended and as assumed in these projections, Chart 5 still shows a persistent gap between projected receipts and total non-interest spending.
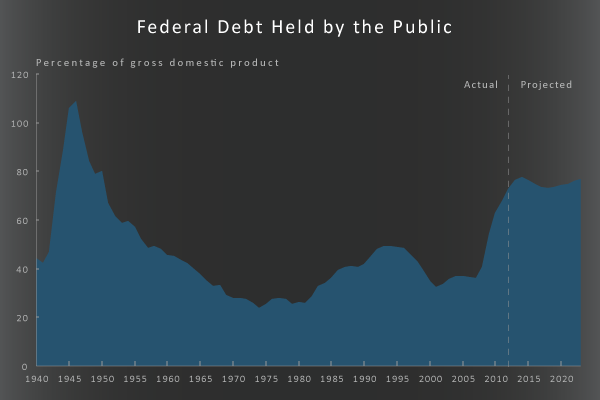
The chart shown by Mother Jones is from http://www.motherjones.com/files, the file is blog_cbo_public_debt_february_2013.jpg

As I highlight in bold in the text excerpted from the report, the Chart 5 data falls a bit and is flat until 2021, which is basically what the Mother Jones chart shows AND what Kevin Drum was banging on in the article. So, looks like Treasure Department and the CBO were talking to each other....which is a good thing. However, the Citizen's Guide covers projections out to 2080 and beyond (probably 2090, but that last label is missing) where things get more dicey and, of course, more vague.
My bottom line: Everybody who cares about the debt debate should download and read the Citizen's Guide and at least attempt to understand the implications. The guide is only viii pages. A lot more reading background reading material is available on the Treasury website.

BTW: The link " target="_blank">Here's the scary debt chart in the Mother Jones article actually gets to this diagram on the cbo website:
which is different, but provides the same data, just vertically rescaled
Edit history
Please sign in to view edit histories.
Recommendations
0 members have recommended this reply (displayed in chronological order):
92 replies
 = new reply since forum marked as read
Highlight:
NoneDon't highlight anything
5 newestHighlight 5 most recent replies
RecommendedHighlight replies with 5 or more recommendations
= new reply since forum marked as read
Highlight:
NoneDon't highlight anything
5 newestHighlight 5 most recent replies
RecommendedHighlight replies with 5 or more recommendations
= new reply since forum marked as read
Highlight:
NoneDon't highlight anything
5 newestHighlight 5 most recent replies
RecommendedHighlight replies with 5 or more recommendations
For anyone who doesn't believe entitlements + interest on the debt will crowd out all other spending [View all]
dkf
Apr 2013
OP
If you take the POV that entitlements are inviolate then everything else gets cut first.
dkf
Apr 2013
#2
No, if you decreased defense and non entitlement spending, you'd have a primary surplus
muriel_volestrangler
Apr 2013
#23
In the OECD, only Mexico and Chile collect a lower percent of GDP in taxes than us.
dawg
Apr 2013
#40
SS is self funded and doesn't cost the Fed Gov anything, Nor did it have anything to do with the
sabrina 1
Apr 2013
#8
No matter how many times that myth gets repeated, lowering SS payments would decrease the deficit
Recursion
Apr 2013
#13
I'm all for dropping the full SS age to 55, at least until unemployment drops below X%
Recursion
Apr 2013
#18
How? It does not claim it is part of the budget and says nothing to disagree with me
Dragonfli
Apr 2013
#84
No, just your misrepresentation of one of their projections, try reading the post
Dragonfli
Apr 2013
#86
Repeating a lie multiple times does not make it true, the treasury handles their money, so what?
Dragonfli
Apr 2013
#91
SS can not be funded out of General Revenue BY LAW. The myth is that SS has anything
Vincardog
Apr 2013
#80
The money comes from the trust fund's surplus when payments out exceed FICA in
Dragonfli
Apr 2013
#65
It's a lie. The SS trust fund is not "one area of the budget", you are talking about
Dragonfli
Apr 2013
#75
So is your concept of government that you can't trust future congresses?
muriel_volestrangler
Apr 2013
#25
I am not disputing the fact that the MyGovCost website is spinning data to support its purposes...
DreamGypsy
Apr 2013
#57
Social Security is paid for with the payroll tax, that should not be included.
AnnieK401
Apr 2013
#10
Social security payments do not contribute to the deficit and the debt.
freedom fighter jh
Apr 2013
#39
Why not pass the JObs Act that Obama proposed to get that tax revenue rolling in again?
CTyankee
Apr 2013
#12
I've been reading Krugman since he started his NYT column over 10 years ago. He has
CTyankee
Apr 2013
#73
This contradicts the post you put up yesterday that shows interest isn't a major factor.
leveymg
Apr 2013
#24
Oh, just come out and say you think Social Security should be done away with, and get it over with.
djean111
Apr 2013
#26
Umm, Cost of Living Increases are designed so that benefits can be paid in constant dollars
Tom Rinaldo
Apr 2013
#43
Yes he has, and the near unamimous concensus of independent economic experts is
Tom Rinaldo
Apr 2013
#52
Seniors today certainly have a higher standard of living than seniors 10, 20, or 30 years ago
Recursion
Apr 2013
#54
For anyone who doesn't believe that tax fraud and offshore banking, along with defense and ..
ananda
Apr 2013
#31
Don't forget that thr Social Security spending assumes the big benefit cut which will occur
bornskeptic
Apr 2013
#77
Gee dawg, your chart makes it look like our low tax philosophy is the entirety of our problem.
dawg
Apr 2013
#47
OK, but isn't about 2/3 of that interest payable to the Social Security Administration?
1-Old-Man
Apr 2013
#61