Any Hope Of American Equality Died In The 1980s (And Here's Proof) - HuffPo [View all]
LINKS TO THIS ARTICLE SHOULD BE POSTED IN COMMENTS ALL OVER THE INTERNET - esp. M$M sites!
http://www.huffingtonpost.com/2013/12/20/angry-chart_n_4480633.html?ref=topbar
?5
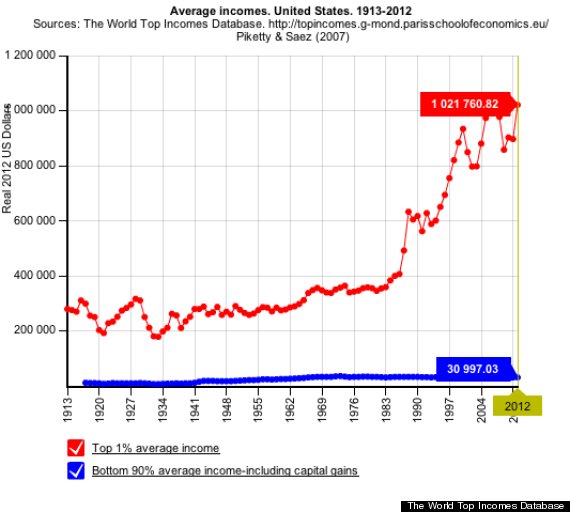
Actually, the average incomes of the top 1 percent of Americans have grown steadily over the last century or so, especially when compared to the flat-lining incomes for the bottom 90 percent of Americans. But as you can see in the above chart, it wasn't until the 1980s that the rich really started to pull away from the normals.
We created the chart using the World Income Database, a collection of data compiled by a group of economists who focus on the incomes of the rich, poor and middle-class. The chart plots the average income of the top 1 percent of American earners against the average income for the bottom 90 percent of Americans between 1913 and 2012, using real 2012 dollars.
In 2012, the top 1 percent took home more than $1 million on average, while the average income of the bottom 90 percent of Americans was $30,438. Compare that to 1917, when the top 1 percent's average income was just under $300,000 and the bottom 90 percent took home slightly more than $11,000 on average.
So how is it that the U.S. income gap has grown large enough for us to claim the title of
worst inequality in the developed world? There are a variety of explanations:
(more)
The U.S. Has The Worst Income Inequality In The Developed World, Thanks To Wall Street: Study
A new paper by economists Facundo Alvaredo, Anthony B. Atkinson, Thomas Piketty, and Emmanuel Saez lays out just how much better at making inequality the U.S. is than everybody else and tries to explain how it got that way.
Since the 1970s, the top 1 percent of earners in the U.S. has roughly doubled its share of the total American income pie to nearly 20 percent from about 10 percent, according to the paper. This gain is easily the biggest among other developed countries, the researchers note. You can see this in the chart below, taken from the paper, which maps the income gains of the top 1 percent in several countries against the massive tax breaks most of them have gotten in the past several decades. (Story continues after chart.)
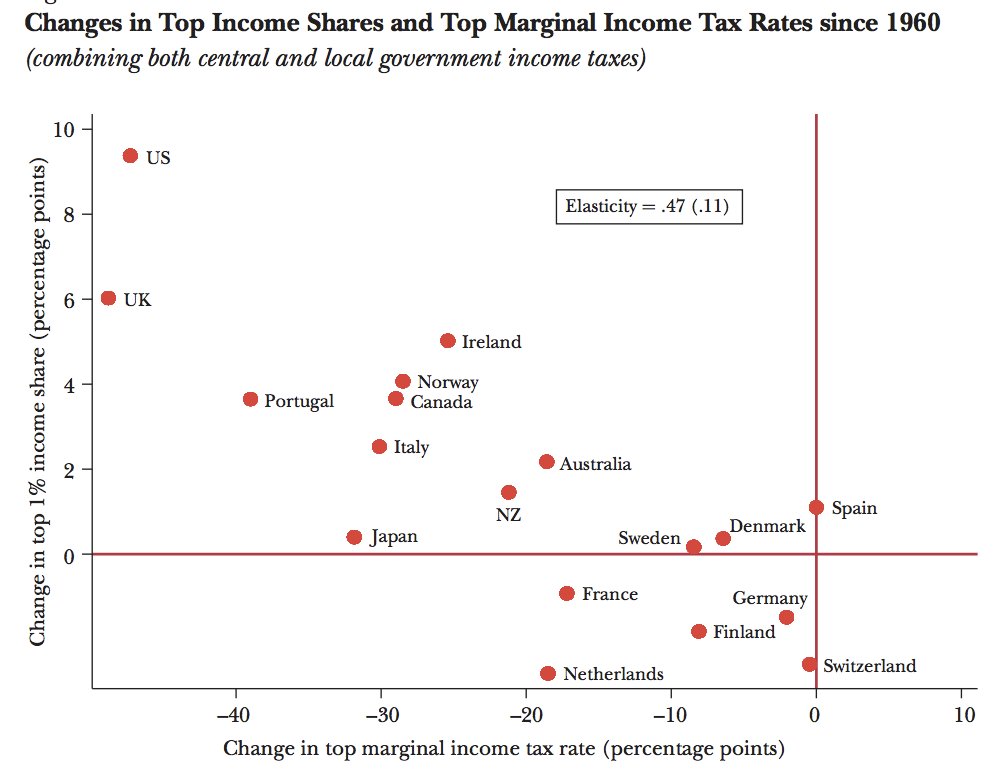
The higher the dot, the more income inequality has grown in that country. See the red dot waaaay up in the left-hand corner, far away from everybody else? That is the United States, where the top earners have made more while getting their taxes slashed by over 40 percent.
This echoes an OECD study from earlier this year that found
the U.S. had the highest income inequality in the developed world. It followed only Chile, Mexico and Turkey among all nations.
(more)
 = new reply since forum marked as read