Welcome to DU!
The truly grassroots left-of-center political community where regular people, not algorithms, drive the discussions and set the standards.
Join the community:
Create a free account
Support DU (and get rid of ads!):
Become a Star Member
Latest Breaking News
Editorials & Other Articles
General Discussion
The DU Lounge
All Forums
Issue Forums
Culture Forums
Alliance Forums
Region Forums
Support Forums
Help & Search
Economy
In reply to the discussion: EF-0. Economy Stats with links to original sources. Links to LBN jobs threads thru 1/9/26 [View all]
progree
(12,770 posts)5. EF-5. National Debt. Deficits and Surpluses
Last edited Sun Jan 11, 2026, 03:58 PM - Edit history (49)
{#} National Debt# URL: http://www.treasurydirect.gov/NP/BPDLogin?application=np
# Under Reagan the debt nearly tripled (2.87 X)
# Under Bush I the debt increased by 56% (1.56 X)
# Under Bush II the debt nearly doubled (1.86 X)
# The debt under the two Bushes together nearly tripled -- it increased 1.56 * 1.86 = 2.89 X
# The last 3 Republican presidents (Reagan and the two Bushes) increased the national debt by 2.87 * 1.56 * 1.86 = 8.3 times, yes they more than octupled the national debt in their combined 20 years of office.
# Under Clinton the debt only increased 37% (1.37 X)
# Secret information: Under Obama the national debt increased 88%. You might see claims that he that he has doubled it -- if so, they are talking about the "debt held by the public" which is one of two components of the national debt. The other component is the Intragovernmental Debt: what one part of the federal government owes to another part of the government -- mostly the Social Security and the Medicare trust funds. [ Note to myself: I have the below at normal.xls Sheet 2 ]
National Debt in Billions of Dollars
Date ` ` ` ` ` ` ` ` Public IntraGov Total
1/20/2009 ` `` ` ` ` 6,307 4,320 10,627 ` Obama inaugurated
1/20/2017 ` ` ` ` ` 14,404 5,544 19,947 ` Trump inaugurated
Obama % Increase ` 128% ` 28% ` 88%
1/20/2020 ` ` ` ` ` 17,181 6,030 23,211 ` Trump 3 year anniversary
Trump % Increase `` 19.3% 8.8% `16.4% ` Not bad percentage-wise, but consider
. . . that he was handed an economy with nearly the lowest unemployment rate and inflation rate in decades, and yet increased the debt by $3.26 Trillion in just 3 years
* Public: debt held by the public. Intragov: Intragovernmental debt
* The annoying backquote symbols (`) are used for spacing, because DU compresses multiple spaces into one. Please try to ignore
# URL: http://www.treasurydirect.gov/NP/BPDLogin?application=np
# Factoid number two is when comparing the debt to GDP version of different countries to each other, economists don't usually include intragovernmental debt {citation needed}. So when some rightie says that Obama ran us up to almost a 100% debt to GDP ratio -- approaching that of some of the in-trouble European countries, point out that the equivalent debt for comparison is the Publicly held debt: 17,181 B$. The latest GDP number (2019 Q4, 1st estimate) as of 2/8/20 is 21,730 B$ (https://www.bea.gov/data/gdp/gross-domestic-product , click on the "Current Release" button, and then on the page that comes up, search the page for "Current-dollar GDP" and include the hyphen). Thus the debt to GDP ratio on this basis is: 17,181 / 21,730 = 79%. (Using the total national debt, the debt to GDP ratio is 23,211 / 21,730 = 107%).
See the back of The Economist magazine where they compare Debt / GDP ratio of several countries (and many other statistics). I can't find those numbers at the Economist site online (I didn't look real hard) but I found a graph at http://www.economist.com/blogs/graphicdetail/2012/01/daily-chart-8 (click on the GOVERNMENT tab)
as I read the graph for the U.S. it is 80%, so I'll have some figuring out to do (why is it not closer to the 73% I calculated by the above methodology at the time -- the Economist link above is dated Sept 2012).
# Uncomfortable Factoid To be Aware Of - The national debt during the Bush II administration increased from 5,728 B$ to 10,627 B$, an increase of 4,899 B$ (86%). The debt during the Obama administration increased from 10,627 B$ to 19,947 B$, an increase of 9,320 B$ -- a larger dollar increase ($4.4 trillion more) in Obama's 8 years than in G.W. Bush's 8 years.
However, under G.W. Bush, the accumulation of debt was totally unnecessary and pointless -- the last 4 years under his predecessor (Clinton) were all years of budgetary surplus. Bush quickly returned us to deficits and debt accumulation via massive tax cuts, 2 wars (one based on lies about weapons of mass destruction), and the Medicare Part D drug benefit (which was written by and for the insurance and drug companies and forbid Medicare from negotiating prices with the drug companies!!) -- all of which were totally unpaid for (unlike Obamacare which the non-partisan Congressional Budget Office -- the official arbiter of the fiscal cost of legislation -- scores as creating a slight 10-year surplus through cuts elsewhere and to a wide assortment of fees and taxes). Whereas the debt increase under Obama was to stop the plunging economy he inherited (4.3 million jobs lost in the last 10 months of the Bush admimistration) and to get the economy pointed in the right direction.
National Debt as Percent of GDP
January 1, 2001: 56.8 % (19 days before Clinton left office and Bush took office)
January 1, 2020: 106.8 % ( 23,201 / 21,730 )
In 19 years the debt AS A PERCENT OF GDP has almost doubled (1.88 X)
Italy with a debt to GDP ratio of 120% (Feb. 26, 2013) is one of the five "PIIGS" countries of the European debt crisis. Thanks to the unpaid-for tax cuts and 2 wars on the national credit card, the Medicare Part D give-away to the pharmaceutical companies and the Great Recession, G.W. Bush! And Trump's unpaid for $1.5 Trillion+ tax cut mostly for the wealthy ($2.0 trillion when interest is included)
http://research.stlouisfed.org/fred2/series/GFDEGDQ188S?cid=5
http://research.stlouisfed.org/fred2/data/GFDEGDQ188S.txt
National Debt as Percent of GDP
62.7% 1993 Q1 - When Bush I left office and Clinton took office
54.9% 2001 Q1 - When Clinton left office and Bush II took office
77.4% 2009 Q1 - When Bush II left office and Obama took office
103.6% 2017 Q1 - When Obama left office and Putin/Trump took office
105.5% 2019 Q3 - latest on this graph as of 2/3/20
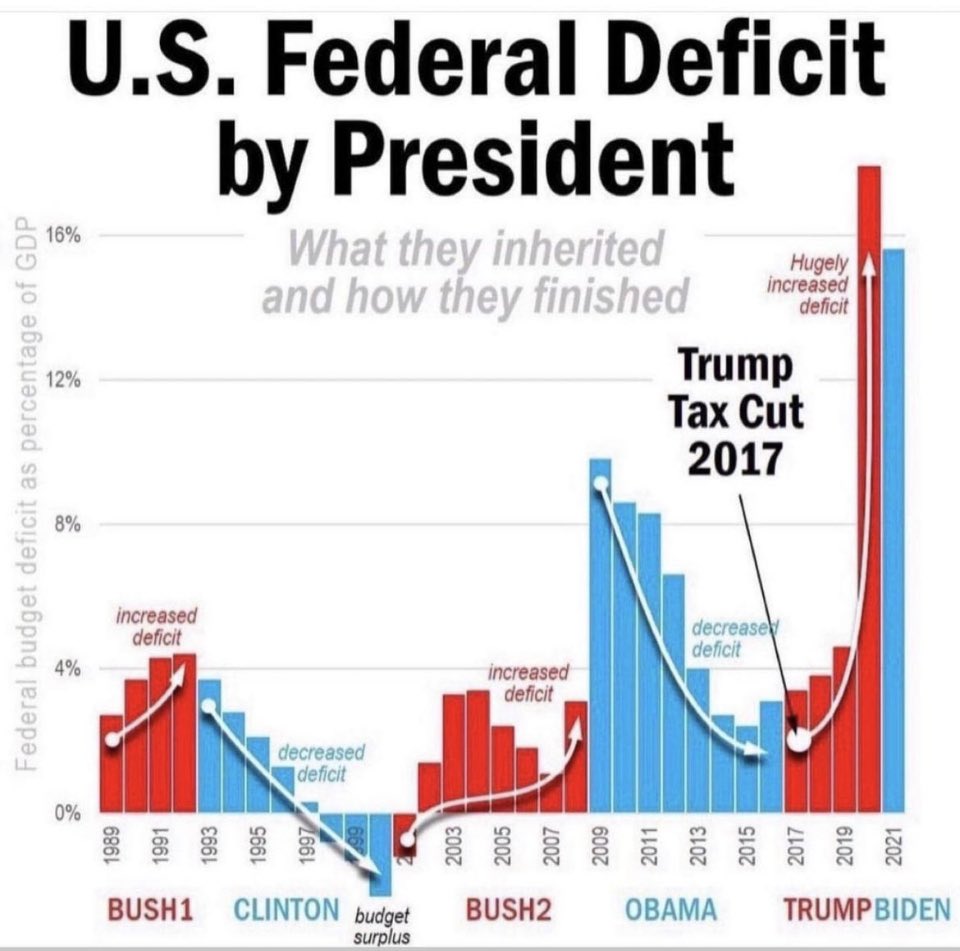
Federal Deficit as % of GDP by president, 1989-2021 - yes it rose under all the Repukes and declined under all the Dems
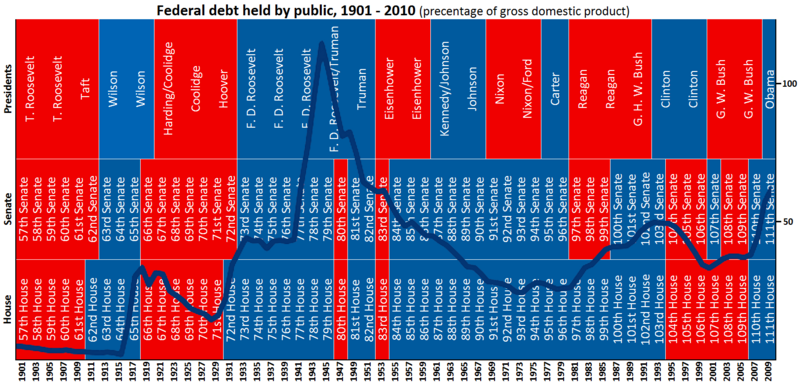
The Debt Held By The Public (as a % of GDP) superimposed on a chart of which party held the presidency, the House, and the Senate
Visible URL: http://en.wikipedia.org/wiki/File:Federal_Debt_1901-2010.png
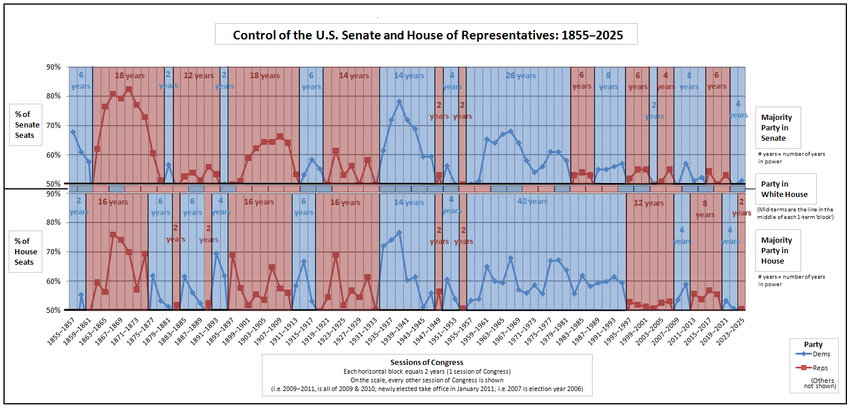
Here's a more detailed view of who controlled Congress from 1798 - 2021:
"Party divisions of United States Congresses" http://en.wikipedia.org/wiki/Party_divisions_of_United_States_Congresses
"United States Presidents and control of Congress" http://en.wikipedia.org/wiki/United_States_presidents_and_control_of_congress
Here is a textual view starting from 1977 (Jimmy Carter's first year) through 2020 that is easier to read.
(BOLD is Democratic, FAINT is Republican) :
Dem House, Dem Senate, Dem President (Carter) < -- 1977, 1978, 1979, 1980
Dem House, Rep Senate, Rep President (Reagan) < -- 1981, 1982, 1983, 1984, 1985, 1986
Dem House, Dem Senate, Rep President (Reagan) < -- 1987, 1988
Dem House, Dem Senate, Rep President (Bush I) < -- 1989, 1990, 1991, 1992
Dem House, Dem Senate, Dem President (Clinton) < -- 1993, 1994
Rep House, Rep Senate, Dem President (Clinton) < -- 1995, 1996, 1997, 1998, 1999, 2000
Rep House, Dem Senate, Rep President (BushII) < -- 2001, 2002
Rep House, Rep Senate, Rep President (BushII) < -- 2003, 2004, 2005, 2006
Dem House, Dem Senate, Rep President (BushII) < -- 2007, 2008
Dem House, Dem Senate, Dem President (Obama) < -- 2009, 2010
Rep House, Dem Senate, Dem President (Obama) < -- 2011, 2012, 2013, 2014
Rep House, Rep Senate, Dem President (Obama) < -- 2015, 2016
Rep House, Rep Senate, Rep President (Trump) < -- 2017, 2018
Dem House, Rep Senate, Rep President (Trump) < -- 2019, 2020
Dem House, Dem Senate, Dem President (Biden) < -- 2021, 2022
Rep House, Dem Senate, Dem President (Biden) < -- 2023, 2024
Rep House, Rep Senate, Rep President (Trump) < -- 2025, 2026
The history of control of these 3 instituiongs since 1857:
https://history.house.gov/Institution/Presidents-Coinciding/Party-Government/
Actually, in Obama's first term, with Republicans filibustering everything they could, Democrats had control of Congress for about 2 months (when Democrats had 60 votes in the Senate): http://www.democraticunderground.com/?com=view_post&forum=1002&pid=1643195
So if any rightie tells you Obama had 2 years of Democratic control of Congress to fix the economy, you can point them to the above link.
And at the end of 2019, the debt to GDP ratio was 106.8%
Another debt as percent of GDP, going back to 1790 and projected to 2038:
http://en.wikipedia.org/wiki/History_of_the_United_States_public_debt#mediaviewer/File:Federal_Debt_Held_by_the_Public_1790-2013.png
The "debt doesn't matter" folks will point to the World War II peak and say -- see, we managed much more debt (relative to GDP) than today, no big deal. What they leave out is that after World War II, the U.S. had no serious competition in manufacturing -- former competitors Europe and Japan were devastated, and the Soviet Union was uncompetitive in world markets. Contrast that to today where most of the rest of the world are serious competitors. Also remember that now we have a much older population with a much higher proportion of seniors and retired than we had in the post-WWII years -- and that proportion, as well as the cost to federal and state budgets, is expected to continue to grow rapidly.
Wikipedia on History of the U.S. Public Debt (more graphs and tables)
http://en.wikipedia.org/wiki/History_of_the_United_States_public_debt
The Last 3 Republican Presidents (before Trump) Have Accounted For $9.2 Trillion Of The Increase In The National Debt
Source of this section: http://bureaucountydems.blogspot.com/p/national-debt.html
Every President, from Truman to Carter, steadily paid down the staggering debt that was run up in our fight against Nazi Germany and Imperial Japan. That pattern came to a screeching halt with Reagan/Bush and Bush II. Clinton’s fiscal policy was a brief respite during this orgy of deficit spending.
Clinton's economic policies balanced 5 budgets, which is 5 more balanced budgets than the last 5 Republican presidents combined. {see next section - I count 4 balanced (actually surplus) budgets -Progree}
As for Trump, in his first three years, he's added $3.26 Trillion more:
1/20/2017 ` 19,947 ` Trump inaugurated
1/20/2020 ` 23,211 ` Trump 3 year anniversary
Source: http://www.treasurydirect.gov/NP/BPDLogin?application=np
{#} Deficits and Surpluses
# The U.S. Federal Deficit By Year - There were surpluses in the last 4 Clinton years: FY 1998, 1999, 2000, 2001 (well, the last 8 months of FY 2001 fell into the G.W. Bush administration). Anyway G.W. Bush inherited a string of surpluses and managed to turn that around into 8 straight years of deficits and to nearly double the national debt.
# URL: http://www.whitehouse.gov/omb/budget/Historicals
. . # Table 1.1 - http://www.whitehouse.gov/sites/default/files/omb/budget/fy2013/assets/hist01z1.xls
Note: although there were 4 straight years of surpluses during the last 4 Clinton years, the national debt went up every year, thanks to (I think) trust funds accounting, -- FFI: http://www.democraticunderground.com/111621802#post12
Some righties telling you that Obama doubled the last Bush deficit, from less than 500 B$ to more than a trillion dollars?
Two weeks before Bush left office, the Congressional Budget Office (CBO) projected -- under existing laws and policies -- a deficit of $1.2 Trillion for fiscal year 2009 https://www.cbo.gov/publication/41753 :
"Under the rules governing CBO’s budget projections —- that is, an assumption that federal laws and policies regarding spending and taxation remain unchanged -— the agency’s baseline reflects these key points: CBO projects that the deficit this year will total $1.2 trillion ...
Fiscal Year 2009 covers 10/1/08 - 9/30/09 -- the last 3 2/3 months of the Bush Administration plus the first 8 1/3 months of the Obama administration. According to FactCheck.org:
Shortly before Obama assumed office, the nonpartisan Congressional Budget Office {on January 7, 2009} projected that the deficit for fiscal year 2009 would be $1.2 trillion ( https://www.cbo.gov/publication/41753 ). {Bush left office and Obama assumed office on January 20, 2009 at noon}.
The fiscal year ended on Sept. 30, 2009, with the deficit at $1.4 trillion. But only some of that was Obama’s doing. We conducted an exhaustive study of the spending bills Obama signed for that year, and concluded that Obama can be fairly assigned responsibility for a maximum of $203 billion in additional spending for fiscal 2009. Others put the amount lower: Economist Daniel J. Mitchell of the libertarian CATO Institute — who once served on the Republican staff of the Senate Finance Committee — has put the figure at $140 billion.
More: http://factcheck.org/2012/09/romney-obama-court-moms-distort-facts/
Note: the link to the CBO report "The Budget and Economic Outlook: Fiscal Years 2009 to 2019", January 7, 2009 contained in the FactCheck.org article no longer works. I replaced it with one that does work in the above excerpt.
[ 20.AAU ]
{#} ACTUAL Federal Spending and Deficits - Fiscal Years 2008 - 2019, in $Billions
Fiscal year 2019 ended September 30, 2019. Similarly for all the other fiscal years.
Note: all figures in this section are actual, not budgeted. I only point out that Bush signed the FY 2009 budget, and that Obama signed the FY 2017 budget.

And yes, the above numbers include payroll tax receipts (including Social Security) and Social Security benefits expenditures, since the above are unified budget numbers.
Source:
. . . https://www.cbo.gov/publication/55824 which links to the complete document at
. . . https://www.cbo.gov/system/files/2019-11/55824-CBO-MBR-FY19.pdf . . . See also
. . . https://www.whitehouse.gov/sites/whitehouse.gov/files/omb/budget/fy2018/hist01z1.xls
. . . https://www.whitehouse.gov/sites/whitehouse.gov/files/omb/budget/fy2019/hist01z1.xls
` ` ` https://www.fiscal.treasury.gov/files/reports-statements/treasury-bulletin/b2019_4ofs.doc [I have this saved]
` ` ` 6/30/2019: Total public debt: 22,023 , Foreign and International: 6,638 ( =30.1% of 22,023 )
` ` ` 9/30/2019: Total public debt: 22,719 , Foreign and International: Not Available Yet
Federal Debt: Total Public Debt (GFDEBTN) (Calendar Years)
http://research.stlouisfed.org/fred2/series/GFDEBTN?cid=5
(To see data: click "+ more" after the "Observation" on the left side just above the graph on the left side).
Why the National Debt Matters
The interest that the government pays on the debt -- which mostly goes to foreigners and the top 1% in the U.S. -- sucks up a lot of tax revenue, leaving less for spending on programs that help the rest of us.
See below on the interest on the national debt.
Beyond a certain point, of course, like with the PIIGS nations and Puerto Rico, investors will demand higher returns, which could lead to a death spiral if the growth of debt relative to the size of the economy continues.
When the Great Recession began, the U.S. debt-to-GDP ratio was 63%. Trillions were spent in stimulus to keep the recession from getting worse and begin a recovery. Now, in Q3 of 2019 it is nearly double that, at 106%. Meaning we have less ability to spend trillions in stimulus until we reach PIIGs levels. And the interest on the federal debt (see below) goes to mostly very wealthy bondholders and foreigners -- money that could instead go to programs.
Debt to GDP ratio, FRED graph: https://fred.stlouisfed.org/series/GFDEGDQ188S
Some people point out that the national debt as a percentage of GDP was higher right after World War II than currently. But remember that during those early post-WWII years, the U.S. had virtually no competition -- most of Europe's and Japan's manufacturing capacity was wreckage, and the Asian Tigers and China were decades from emerging as significant competition. Also remember that now we have a much older population with a much higher proportion of seniors and retired than we had in the post-WWII years -- and that proportion, as well as the cost to federal and state budgets, is expected to continue to grow rapidly.
{#} Interest on the national debt
At the end of fiscal year 2000 it was $362 Billion, and at end of FY 2019 it was $575 Billion (apparently including interest to government trust funds like Social Security) per
https://www.treasurydirect.gov/govt/reports/ir/ir_expense.htm
It has increased $116 billion in the last 2 years (end of FY 2017 to end of FY 2019, a 25% increase in just 2 years). Again, this is money that could have gone to programs instead of to wealthy bondholders.
This one -- counting only the debt held by the public (i.e. excluding government trust funds), said the interest on that part of the federal debt in 2017 was $263 billion, or 7% of the federal budget. This is a 9.6% increase over last year. The below is a good read, by the way, on all aspects of federal spending. It is periodically updated. On 2/3/2019 it went up through Fiscal Year 2017.
http://www.cbpp.org/research/policy-basics-where-do-our-federal-tax-dollars-go
****THE BELOW ARE IN REVERSE CHRONOLOGICAL ORDER - MOST RECENT AT THE TOP****
CBO projects a decade of trillion-dollar deficits and soaring US debt, CNN, 1/28/20
https://www.cnn.com/2020/01/28/politics/cbo-us-record-federal-deficits/index.html
The annual congressional report (released Tuesday January 28, 2020) projects that the US budget deficit is likely to blast through the symbolic threshold of $1 trillion this year despite a healthy economy with record low unemployment.
And that number is expected to widen each year over the next decade through 2030. As a result of the rising deficits, US government debt held by the public will soar from nearly $18 trillion at the end of 2020 to $31.4 trillion by the end of 2030.
Over that same period, that debt held by the public as a share of the economy will grow from 81% of GDP this year to 98% by 2030 -- the highest percentage since 1946.
The CBO warned that rising federal debt would likely reduce national savings and income, boost the government's interest payments, limit policymakers' ability to respond to unforeseen events and increase the likelihood of a fiscal
The CBO estimated that the US economy would grow by 2.2% this year, modest growth but far less than Trump's goal of hitting 3% annual growth.
The deficit -- the gap between how much the government spends versus how much it takes in -- is now expected to rise from 4.6% of gross domestic product this year to 5.4% in 2030.
The CBO forecast assumes that Congress will stay the course on its current spending plans.
The CBO report is at https://www.cbo.gov/publication/56080 , the full report is at: https://www.cbo.gov/publication/56020
Some additional information from the report:
Net interest is about 1/3 of the deficit in 2020, and about 1/2 of the deficit in 2030. Net interest will expand from 1.7% of GDP in 2020 to 2.6% of GDP in 2030. (( These interest payments go mostly to the wealthy, and foreigners get a bit more than 1/4 of it. Keep this in mind when some idiot says the interest cost doesn't matter because we're just paying it to ourselves.))
All of the above assumes that the individual tax cuts of the 2017 tax act (TCJA) expire at the end of 2025 as scheduled. The above numbers would be be substantially worse if these tax cuts were instead renewed after 2025.
"Real bracket creep and related effects" increases from about 0.03% to about 0.45% of GDP from 2021 to 2030 ((from my measurements of the graph)). So the 2017 tax act (TCJA)'s changing to chained CPI for adjusting the income tax brackets for inflation in future years will bite harder and sooner than I expected. Another CBO report, from June, projects that this bracket creep will increase annual tax revenues to about 1.5% of GDP by 2049 ((in today's dollars, 1.5% of today's GDP, $21.730 trillion, comes to $326 billion)). https://www.cbo.gov/publication/55331
An overview of the slide shows, directors's statement, and summary is at https://www.democraticunderground.com/?com=view_post&forum=1002&pid=12923063
U.S. deficit to expand by $800 billion more than previously expected over 10 years, CBO says, Washington Post, 8/21/19
https://www.democraticunderground.com/10142357691
Interest on the public debt shot up by $65 billion, or 14%, in fiscal year 2018, which ended September 30, 2018 - MarketWatch, 10/15/18
The increase was in part because the Treasury had to increase the principal on its inflation-protected securities. Rising interest rates and a bigger debt also played a role.
https://www.democraticunderground.com/10142179484
https://www.marketwatch.com/story/us-budget-deficit-jumps-to-779-billion-2018-10-15
Under current law, national debt held by the public projected to expand from 78% of GDP currently to 152% of GDP by 2048 (30 years from now). By 2048, interest on the debt is projected to nearly quadruple as a percent of GDP (from 1.6% in 2018 to 6.3% of GDP in 2048) and reach the same level as spending on Social Security - CBO 6/26/18
In the CBO's projection, Social Security remains at promised levels even after the trust funds run out, so this is one exception to the "under current law" (i.e. the CBO assumes that Congress does something to prevent the SS benefit cuts that will otherwise result after the SS trust funds are exhausted)
Sources: (1) The 2018 Long-Term Budget Outlook, Congressional Budget Office, 6/26/18 https://www.cbo.gov/publication/53919
(2) Director’s Statement on The 2018 Long-Term Budget Outlook (it's just 1 page) - https://www.cbo.gov/publication/54107
(3) Projected Social Security expenditures and net interest in Fig 2 of https://www.cbo.gov/sites/default/files/recurringdata/51119-2018-06-ltbo.xlsx (later: link went bad, am having trouble finding a good link)
(4) Projected interest rates on the publicly held debt - Fig 10 of above bad link (sigh)
Deficit to top $1 trillion per year by 2020, CBO says - Washington Post, 4/9/18
https://www.democraticunderground.com/10142033147
The actual 2017 deficit: $665 B. Projected for 2018: $804 B, a 21% increase. ((Later Edit: the 2018 deficit officially came in at $779 B in 2018, but would have been $823 billion except for a fortuitous calendar (1) )). The tax cut plus the extra $300 billion in spending over the next 2 years approved in March 2018 is together expected to add $1.6 T to the deficits over the next decade
(1) Outlays in 2018 were reduced by a shift in the timing of certain payments; those payments were instead made in fiscal year 2017 because October 1, 2017 (the first day of fiscal year 2018), fell on a weekend. If not for that shift, the deficit in 2018 would have been $823 billion, or 4.1 percent of GDP.
-- Source: https://www.cbo.gov/system/files?file=2018-11/54647-MBR.pdf
"The U.S. will spend more on interest payments than on the military by 2027, according to projections by the Congressional Budget Office" ((that's just 7 years from now!! -Progree))
Source: "By Adding to the Debt, Tax Cuts Could Complicate Next Downturn", Wall Street Journal, 1/21/18
https://www.wsj.com/articles/by-adding-to-the-debt-tax-cuts-could-complicate-next-downturn-1516549269
# Yes, the WSJ article is paywalled. There are no more details or source information about this quote in the article than what it in the quote. I did find a March 2017 CBO report with information that was consistent with the above quote. Note the March 2017 CBO report does not include the effects of the $1.5 trillion tax cut enacted in December 2017.
[ [ Note to myself: see 18.AAY a2.d for that ] ]
The CBO foresees federal interest payments rising from 1.4 percent of GDP this year to 2.9 percent in 2027, AP, via Yahoo News, 11/6/17
https://www.yahoo.com/news/why-debt-gop-tax-cuts-204005245.html (this does not include any impact from the then-proposed Republican tax cuts)
U.S. debt held by public to reach 150 percent of GDP in 30 years: CBO, Reuters, 3/30/17
## Expects the interest cost on the national debt to be 1.4% of GDP in 2017 and 6.2% in 2047 (30 years from now)
https://www.yahoo.com/news/cbo-says-u-debt-reach-150-percent-gdp-140959250--business.html
National Debt On Track To Hit 141% Of GDP As Outlook Worsens -- CBO ((actually the debt held by the public to hit 141% of GDP by 2046, up sharply from last year's forecast of 111%. Its currently at 75.4% per the article)), IBD 7/12/16.
## Annual deficits to increase from 2.9% of GDP this year to 8.0% of GDP in 2046.
## Interest payments to shoot up from 1.4% of GDP now to 5.8% of GDP in 2046.
## Social Security Trust Fund exhaustion date: 2030 per CBO, just 14 years from now (2034 per SS Trustees) ),
Source: Investors Business Daily, 7/12/16 http://www.investors.com/politics/commentary/the-nations-debt-crisis-just-got-a-whole-lot-worse/
National debt burden could increase by almost $10 trillion in the coming decade - CBO 3/24/2016.
After a $96 billion increase in the deficit this fiscal year, the U.S. will go deeper and deeper into the red to pay for Social Security and Medicare, projections from the Congressional Budget Office show. The public debt burden could swell by almost $10 trillion in the coming decade as a result ( https://www.cbo.gov/publication/51384 ).
As debt maturities loom, U.S. needs to extend (the average maturity of federal government debt is only 5.2 years) - Reuters, 9/1/11 (followed by a September 2019 update where the situation is virtually unchanged)
http://www.reuters.com/article/2011/09/01/us-bonds-debt-extension-idUSTRE7803QD20110901
The average maturity of marketable U.S. debt ($9 Trillion) is only 5.2 years. 70% of bonds mature in less than 5 years. We're financing long-term liabilities with short-term debt. With such short average maturity, a substantial rise in overall market interest rates will be followed relatively quickly by a substantial rise in interest on the national debt.
==========================================================
Apparently investors are worried about going out 30 years, at least more so than a few years ago -- as of 5/2/16 the yield gap between 10 year and 30 year bonds is 0.83 percentage points, up from 0.20 percentage points in mid 2007. Later, 2/3/20: but the spread has gone down to 0.47%.
Treasury Yields: 5/2/16: 10 Year: 1.88%, 30 Year: 2.71%, difference: 0.83%
` ` ` `` ` ` ` ` 1/2/19: 10 Year: 2.66%, 30 Year: 2.97%, difference: 0.31%
` ` ` `` ` ` ` `2/3/20: 10 Year: 1.54%, 30 Year: 2.01%, difference: 0.47%
. . https://www.treasury.gov/resource-center/data-chart-center/interest-rates/Pages/TextView.aspx?data=yield
I think the maturity information in the Reuters article above comes from the below link, which I updated to September 2019.
Federal Debt (Word document) - Obtained from:
. . https://www.fiscal.treasury.gov/fsreports/rpt/treasBulletin/treasBulletin_home.htm
. . Click on Current Issue
. . Click on Federal Debt ==> https://www.fiscal.treasury.gov/files/reports-statements/treasury-bulletin/b2019_4fd.doc
Per this link, from Table FD-5, In September 2019, 70.1% of the $14.225 Trillion in privately held interest-bearing marketable debt has a maturity of less that 5 years, and 88.5% has a maturity of less than 10 years. The average maturity was 65 months (5.4 years).
So we're sure not taking advantage of historically near-record-low long-term interest rates to lock in these rates for decades.
Update per visit of 11/18/21: In June 2021, 71.1% of the $16.550 Trillion in privately held interest-bearing marketable debt has a maturity of less that 5 years, and 88.2% has a maturity of less than 10 years. The average maturity was 62 months (5.2 years).
CBO: Interest on federal debt will triple over coming decade (Washington Post Wonk Blog 1/26/15)
http://www.washingtonpost.com/blogs/wonkblog/wp/2015/01/26/cbo-interest-on-federal-debt-will-triple-over-coming-decade/
Interest payments are also poised to rise, both because of an expected rise in interest rates from the recent historic lows and because of a rising government debt, which the CBO said would hit 100 percent of GDP in 25 years ((talking about just the publicly held portion of the debt -Progree)). The interest payments ((on the publicly held debt)) alone are expected to hit $227 billion this year, more than double to $480 billion by 2019 and more than triple to $722 billion by 2024.
It said that federal spending would rise from 20.3 percent of GDP in 2015 to 22.3 percent in 2025 largely because of the aging population and increases in Social Security and Medicare programs.
But it said that there would be “a significant projected decline in discretionary spending relative to the size of the economy.” Unless Congress chooses to alter spending caps in current budget law, that would result in a squeeze on a variety of programs including defense, education, homeland security and a host of other areas. ((So the CBO is apparently assuming in its projections that the sequester budget caps will remain in effect))
Interest on the national debt to rise from 1.0% of GDP to 3.0% by 2023 (in just 4 years!), per CBO, says CEPR.net, 3/6/13
http://www.cepr.net/index.php/blogs/beat-the-press/has-npr-joined-peter-petersons-crusade-against-social-security-and-medicare? - one thing that caught my eye is that net interest is slated to rise from 0.5% or 1.0% of GDP to 2.8% or 3.0% of GDP, according to the CBO (the upper figure in each case is the nominal amount, the lower figure deducts the amount of interest paid to its own accounts, so its the amount of interest actually paid externally.)
Federal Reserve balance sheet
https://fred.stlouisfed.org/series/WALCL
Board of Governors of the Federal Reserve System (US), Assets: Total Assets: Total Assets (Less Eliminations From Consolidation): Wednesday Level [WALCL], retrieved from FRED, Federal Reserve Bank of St. Louis; -- shows the Federal Reserve's assets are back up above $4.1 trillion (1/29/20). Was around $4.5 trillion at the peak. It was around $800 billion in the years before the Great Recession.
Edit history
Please sign in to view edit histories.
Recommendations
0 members have recommended this reply (displayed in chronological order):
40 replies
 = new reply since forum marked as read
Highlight:
NoneDon't highlight anything
5 newestHighlight 5 most recent replies
RecommendedHighlight replies with 5 or more recommendations
= new reply since forum marked as read
Highlight:
NoneDon't highlight anything
5 newestHighlight 5 most recent replies
RecommendedHighlight replies with 5 or more recommendations
= new reply since forum marked as read
Highlight:
NoneDon't highlight anything
5 newestHighlight 5 most recent replies
RecommendedHighlight replies with 5 or more recommendations
EF-0. Economy Stats with links to original sources. Links to LBN jobs threads thru 1/9/26 [View all]
progree
Sep 2012
OP
EF-2. Unemployment Rate, Labor Force Participation Rate, Unemployment Insurance Claims
progree
Sep 2012
#2
EF-3. Recessions and Expansions - Official (NBER.org). Also GDP (Gross Domestic Product)
progree
Sep 2012
#3
Thanks for the thanks and slogging through it all. I just improved EF.2.'s readability a bit (same
progree
Sep 2012
#8
A lot of meaningful data and links to data. great post. A lot of work went into this! recommended,..
Bill USA
Sep 2012
#10
Thanks for the link, I haven't seen it before, I added to CabCurious's 125170175
progree
Sep 2012
#11
All numbers updated 10/7/12. Of particular interest is EF 1 and EF 2 - jobs -- updated for the
progree
Oct 2012
#12
Funny about oil prices, I disticntly remember $44 a barrel in the beginning of Reagans first term.
FogerRox
Oct 2012
#17
Kicking, Reccing, and Bookmarking. Will spend some more time checking out the specifics, but
Dark n Stormy Knight
Nov 2012
#22
A kick after 9 months of spending 3-4 hours per month quietly updating the numbers
progree
May 2014
#28
Kick for an update that took 1 1/2 days - hope you'll look at EF-0, the OP post
progree
Jul 2014
#29
5/6/16 update of all pages, 1st time in 4 months. Many years-old EF-5 numbers updated
progree
May 2016
#35
A kick to keep it from falling into the archives - I have to do this about every 2 1/2 years
progree
Oct 2022
#38
Another kick. Might now be in the archive. Miss you progree, wherever you are
question everything
Mar 2024
#39