Welcome to DU!
The truly grassroots left-of-center political community where regular people, not algorithms, drive the discussions and set the standards.
Join the community:
Create a free account
Support DU (and get rid of ads!):
Become a Star Member
Latest Breaking News
Editorials & Other Articles
General Discussion
The DU Lounge
All Forums
Issue Forums
Culture Forums
Alliance Forums
Region Forums
Support Forums
Help & Search
Economy
In reply to the discussion: EF-0. Economy Stats with links to original sources. Links to LBN jobs threads thru 5/8/26 [View all]
progree
(13,082 posts)20. EF-7. In Progress (mostly Dem presidencies v. Repub presidencies)
Last edited Sun Jan 11, 2026, 05:02 PM - Edit history (34)
Note: The inequality section has been moved to new page EF-9, and includes some income measuresSome of the content below may be placed on the earlier pages -- EF-1 through EF-6. These are sections I'm working on ... I was wishfully hoping that some may have found this useful before the election so I "rushed it to print".
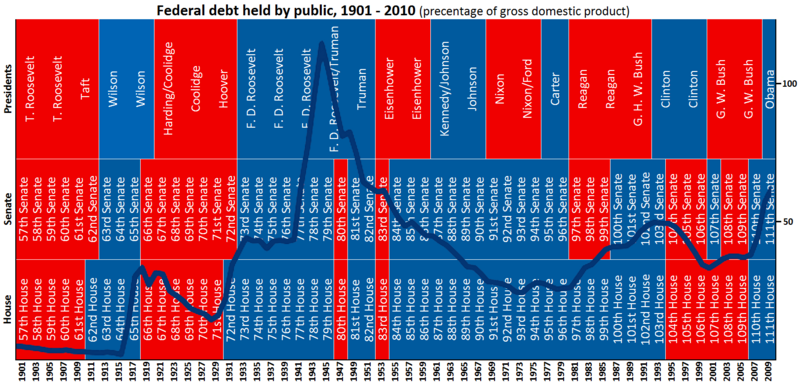
{#} Presidencies and House and Senate (when Republicans and Democrats held the presidency and had control of the House and Senate) from 1901-2010 (Chart). Bonus: the federal debt held by the public as a percentage of GDP is superimposed on it
(One complaint is that the federal debt held by the public is only one component of the federal debt. The other component of the federal debt aka the national debt is the trust fund debt -- what the federal government owes to the Social Security and Medicare and other trust funds. Please see EF-5. above for that breakdown).
From Wikimedia Commons (the link followed by the displayed graphic):
http://en.wikipedia.org/wiki/File:Federal_Debt_1901-2010.png
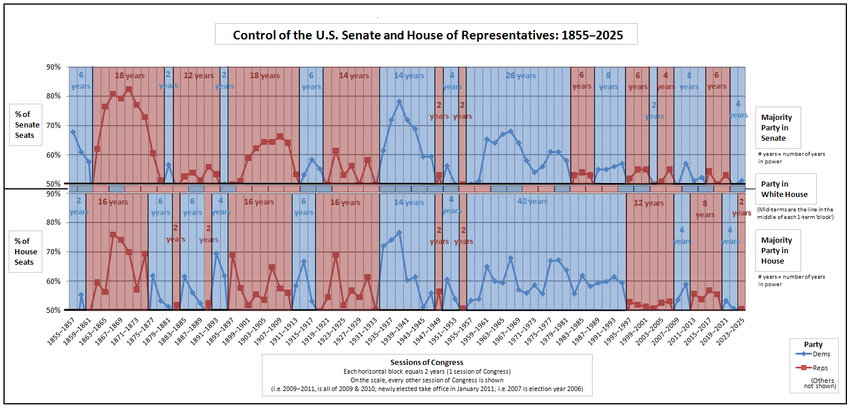
Here's a more detailed view of who controlled Congress from 1798 - 2021:
"Party divisions of United States Congresses" http://en.wikipedia.org/wiki/Party_divisions_of_United_States_Congresses
"United States Presidents and control of Congress" http://en.wikipedia.org/wiki/United_States_presidents_and_control_of_congress
Here is a textual view starting from 1977 (Jimmy Carter's first year) through 2020 that is easier to read.
(BOLD is Democratic, FAINT is Republican) :
Dem House, Dem Senate, Dem President (Carter) < -- 1977, 1978, 1979, 1980
Dem House, Rep Senate, Rep President (Reagan) < -- 1981, 1982, 1983, 1984, 1985, 1986
Dem House, Dem Senate, Rep President (Reagan) < -- 1987, 1988
Dem House, Dem Senate, Rep President (Bush I) < -- 1989, 1990, 1991, 1992
Dem House, Dem Senate, Dem President (Clinton) < -- 1993, 1994
Rep House, Rep Senate, Dem President (Clinton) < -- 1995, 1996, 1997, 1998, 1999, 2000
Rep House, Dem Senate, Rep President (BushII) < -- 2001, 2002
Rep House, Rep Senate, Rep President (BushII) < -- 2003, 2004, 2005, 2006
Dem House, Dem Senate, Rep President (BushII) < -- 2007, 2008
Dem House, Dem Senate, Dem President (Obama) < -- 2009, 2010
Rep House, Dem Senate, Dem President (Obama) < -- 2011, 2012, 2013, 2014
Rep House, Rep Senate, Dem President (Obama) < -- 2015, 2016
Rep House, Rep Senate, Rep President (Trump) < -- 2017, 2018
Dem House, Rep Senate, Rep President (Trump) < -- 2019, 2020
Dem House, Dem Senate, Dem President (Biden) < -- 2021, 2022
Rep House, Dem Senate, Dem President (Biden) < -- 2023, 2024
Rep House, Rep Senate, Rep President (Trump) < -- 2025, 2026
The history of control of these 3 instituiongs since 1857:
https://history.house.gov/Institution/Presidents-Coinciding/Party-Government/
Actually, in Obama's first term, with Republicans filibustering everything they could, Democrats had control of Congress for about 2 months (when Democrats had 60 votes in the Senate): http://www.democraticunderground.com/?com=view_post&forum=1002&pid=1643195
So if any rightie tells you Obama had 2 years of Democratic control of Congress to fix the economy, you can point them to the above link.
{#}Democratic Presidencies better than Republican Presidencies
# Obama's Accomplishments -- A compilation LIST of links regarding President Obama, http://www.democraticunderground.com/10022255
# Job Creation of record of post-WWII Presidents, Average Annual % Increases. -- Sorted from best to worst by average annual percentage increase in jobs. Republicans in red, Democrats in blue. Notice that -- with the tiny exception (0.02% difference) of Nixon to Kennedy -- the worst Democrat has a better record than the best Republican -- that is, until Obama, who inherited an economy that was losing several hundred thousand jobs a month.
Also, Kennedy did not have a chance to complete his term -- had he done so, and had he had the same job creation numbers in December 1963 through January 1965 as Johnson had (a 3.48%/year annualized rate of increase), he would have easily topped Nixon.
(updated 2/7/20 after new jobs report released - it has revisions going back decades. Unfortunately, Ford edges out Obama on average annual percentage job increase by 0.01% (1.09% to 1.08%)

Remember, Obama inherited the deepest recession since World War II, which lost 4.2 million jobs in the last 10 months of his predecessor, and in the last 3 months of his predecessor was losing 753,000 jobs a month. With that momentum, job losses continued for the first 13 months of the Obama presidency -- through February 2010 -- totalling 4.3 million jobs lost during those 13 months.
Anyway, despite the 4.3 million jobs lost in his first 13 months because of the Bush crash, Obama still beats 3 of the last 6 post-WWII Republican presidents with completed terms.

# Real annual corporate profit growth 3X higher under Obama than under Reagan, even when measured from the 2008 peak. (both Bushs oversaw profit declines in case you were wondering).
http://thinkprogress.org/economy/2012/10/26/1097301/anti-business-obama-is-is-best-president-for-corporate-profits-since-1900/
Corporate profits: http://www.fool.com/investing/general/2012/10/24/the-best-presidents-for-the-economy.aspx
Also at the above fool.com link - Stock market performance, Average annual real GDP growth per capita, Inflation (average annual change in the Consumer Price Index), Change in unemployment rate during their presidencies,
Adam Hartung, a contributor at Forbes Magazine: Democratic presidents beat Republican ones: Disposable income, GDP, profits, stock market, national debt,... at http://www.democraticunderground.com/10021593080
(There is a disclaimer at the top of the Forbes article saying "Opinions expressed by Forbes Contributors are their own", so it is dishonest to make it sound like it is the opinion of Forbes Magazine, or even "according to Forbes Magazine". Just like Fox News, Forbes Magazine has one or two token liberals so as to appear "fair and balanced" )
The stock market gained 166% under Obama -- 166% above where it was at the last close before inaugural day (speaking of the S&P 500. That's a doubling plus an additional 66%, or 2.66 X) (GW Bush's 8-year record: Minus 37% -- yes, It declined 37% from the beginning of the GW Bush presidency to the end of the Bush presidency.). Details: EF-4. at http://www.democraticunderground.com/111622439#post4
Corporate profits? Stock market? How is that relevant to regular Americans?
Well, the main reason to include these aspects is if some rightie calls Obama a socialist and/or says that businesses and investors lack confidence in him, you can point out his record on the stock market and corporate profits.
The other reason, is that given that many tens of millions of Americans have a substantial part of their nest eggs in stocks -- through direct ownership or via pension funds -- do you really wish for the opposite - a severe decline in stock prices?
And if there isn't much trickle-down of corporate profits, at least there is potential there (via higher taxes on top earners and closing corporate tax loopholes).
”While most Americans think they are not involved with the stock market, truthfully they are. Via their 401K, pension plan and employer savings accounts 2/3 of Americans have a clear vested interest in stock performance."
-Source: Bob Deitrick in http://www.forbes.com/sites/adamhartung/2014/09/05/obama-outperforms-reagan-on-jobs-growth-and-investing/
Consider also that the Great Depression began with a stock market crash in 1929. When those 2/3 of Americans become fearful of their future prospects and cut back on their spending, and when businesses likewise hold back on business investments and hiring, that affects everyone.
Edit history
Please sign in to view edit histories.
Recommendations
0 members have recommended this reply (displayed in chronological order):
40 replies
 = new reply since forum marked as read
Highlight:
NoneDon't highlight anything
5 newestHighlight 5 most recent replies
RecommendedHighlight replies with 5 or more recommendations
= new reply since forum marked as read
Highlight:
NoneDon't highlight anything
5 newestHighlight 5 most recent replies
RecommendedHighlight replies with 5 or more recommendations
= new reply since forum marked as read
Highlight:
NoneDon't highlight anything
5 newestHighlight 5 most recent replies
RecommendedHighlight replies with 5 or more recommendations
EF-0. Economy Stats with links to original sources. Links to LBN jobs threads thru 5/8/26 [View all]
progree
Sep 2012
OP
EF-2. Unemployment Rate, Labor Force Participation Rate, Unemployment Insurance Claims
progree
Sep 2012
#2
EF-3. Recessions and Expansions - Official (NBER.org). Also GDP (Gross Domestic Product)
progree
Sep 2012
#3
Thanks for the thanks and slogging through it all. I just improved EF.2.'s readability a bit (same
progree
Sep 2012
#8
A lot of meaningful data and links to data. great post. A lot of work went into this! recommended,..
Bill USA
Sep 2012
#10
Thanks for the link, I haven't seen it before, I added to CabCurious's 125170175
progree
Sep 2012
#11
All numbers updated 10/7/12. Of particular interest is EF 1 and EF 2 - jobs -- updated for the
progree
Oct 2012
#12
Funny about oil prices, I disticntly remember $44 a barrel in the beginning of Reagans first term.
FogerRox
Oct 2012
#17
Kicking, Reccing, and Bookmarking. Will spend some more time checking out the specifics, but
Dark n Stormy Knight
Nov 2012
#22
A kick after 9 months of spending 3-4 hours per month quietly updating the numbers
progree
May 2014
#28
Kick for an update that took 1 1/2 days - hope you'll look at EF-0, the OP post
progree
Jul 2014
#29
5/6/16 update of all pages, 1st time in 4 months. Many years-old EF-5 numbers updated
progree
May 2016
#35
A kick to keep it from falling into the archives - I have to do this about every 2 1/2 years
progree
Oct 2022
#38
Another kick. Might now be in the archive. Miss you progree, wherever you are
question everything
Mar 2024
#39