Welcome to DU!
The truly grassroots left-of-center political community where regular people, not algorithms, drive the discussions and set the standards.
Join the community:
Create a free account
Support DU (and get rid of ads!):
Become a Star Member
Latest Breaking News
Editorials & Other Articles
General Discussion
The DU Lounge
All Forums
Issue Forums
Culture Forums
Alliance Forums
Region Forums
Support Forums
Help & Search
Economy
In reply to the discussion: Weekend Economists Watch the Stars Falling June 12-14, 2015 [View all]Demeter
(85,373 posts)66. AND FINALLY, THE US ECONOMY
Two of the Most Economically Sensitive Commodities Suggest a Crash is Coming
http://www.zerohedge.com/news/2015-06-13/two-most-economically-sensitive-commodities-suggest-crash-coming
If the foundation of the financial system is debt… and that debt is backstopped by assets that the Big Banks can value well above their true values (remember, the banks want their collateral to maintain or increase in value)… then the “pricing” of the financial system will be elevated significantly above reality. Put simply, a false “floor” was put under asset prices via fraud and funny money.
Consider the case of Coal.
In the US, Coal has become a political hot button. Consequently it is very easy to forget just how important the commodity is to global energy demand. Coal accounts for 40% of global electrical generation. It might be the single most economically sensitive commodity on the planet. With that in mind, consider that Coal ENDED a multi-decade bull market back in 2012. In fact, not only did the bull market end… but Coal has erased virtually ALL of the bull market’s gains (the green line represents the pre-bull market low).

Those who believe that the global is in an economic expansion will shrug this off as the result if the US’s shift away from Coal as an energy source. The US accounts for only 15% of global Coal demand. The collapse in Coal prices goes well beyond US changes in energy policy. What’s happening in Coal is nothing short of “price discovery” as the commodity moves to align itself with economic reality. In short, the era of “growth” pronounced by Governments and Central Banks around the world ended. The “growth” or “recovery” that followed was nothing but illusion created by fraudulent economic data points.
We get confirmation of this from Oil. For most of the “so called” recovery, Oil gradually moved higher, creating the illusion that the world was returning to economic growth (demand was rising, hence higher prices).

That blue line could very well represent the “false floor” for the recovery I mentioned earlier. Provided Oil remained above this trendline, the illusion of growth via higher energy demand was firmly in place. And then Oil fell nearly 60% from top to bottom in less than six months.

As was the case for Coal, Oil’s drop was nothing short of a bubble bursting. From 2009 until 2014 Oil’s price was disconnected from economic realities. Then price discovery hit resulting in a massive collapse. Moreover, the damage to Oil was extreme. Not only did it collapse 60% in a matter of months. It actually TOOK out the trendline going back to the beginning of the bull market in 1999.

This is a classic “ending” pattern. Breaking a critical trendline (particularly one that has been in place for several decades) is one thing. Breaking it and then failing to reclaim it during the following bounce is far more damning. We’ve just reclaimed the line a week or so ago. But unless we hold here, Oil will be dropping down to $30 per barrel if not lower.
In short, the era the phony recovery narrative has come unhinged. We have now entered a cycle of actual price discovery in which financial assets fall to more accurate values. This will eventually result in a stock market crash, very likely within the next 12 months.
In Minnesota, high employment and weak wages show Fed's quandary
http://www.reuters.com/article/2015/06/12/us-usa-fed-wages-insight-idUSKBN0OS0C320150612
By all rights wages should be soaring in Minnesota, a Midwestern state that boasts one of the best educated and well-paid workforces in the United States and where the unemployment rate stands at a 14-year low.
But explain that to Bernie Hesse, projects director for the United Food and Commercial Workers Union. For every bright spot - the 5 percent across the board pay rise just negotiated for the union's nursing home workers - there is a drag in the other direction.
Retail workers, who account for 6,000 of the union's 10,000 Minnesota members, agreed to keep wages flat to avoid an increase in health care premiums.
Health care is "where our members are in demand...There are no bodies," Hesse said, while "the retailers are saying: 'we will bargain pay for health care'."
...After more than five years of steady national job growth and with the U.S. economy perhaps approaching full employment, sustained pressure on wages is a final missing piece for the Fed's puzzle - necessary to conclude that the economy is near full capacity.
MORE
http://www.zerohedge.com/news/2015-06-13/two-most-economically-sensitive-commodities-suggest-crash-coming
If the foundation of the financial system is debt… and that debt is backstopped by assets that the Big Banks can value well above their true values (remember, the banks want their collateral to maintain or increase in value)… then the “pricing” of the financial system will be elevated significantly above reality. Put simply, a false “floor” was put under asset prices via fraud and funny money.
Consider the case of Coal.
In the US, Coal has become a political hot button. Consequently it is very easy to forget just how important the commodity is to global energy demand. Coal accounts for 40% of global electrical generation. It might be the single most economically sensitive commodity on the planet. With that in mind, consider that Coal ENDED a multi-decade bull market back in 2012. In fact, not only did the bull market end… but Coal has erased virtually ALL of the bull market’s gains (the green line represents the pre-bull market low).
Those who believe that the global is in an economic expansion will shrug this off as the result if the US’s shift away from Coal as an energy source. The US accounts for only 15% of global Coal demand. The collapse in Coal prices goes well beyond US changes in energy policy. What’s happening in Coal is nothing short of “price discovery” as the commodity moves to align itself with economic reality. In short, the era of “growth” pronounced by Governments and Central Banks around the world ended. The “growth” or “recovery” that followed was nothing but illusion created by fraudulent economic data points.
We get confirmation of this from Oil. For most of the “so called” recovery, Oil gradually moved higher, creating the illusion that the world was returning to economic growth (demand was rising, hence higher prices).
That blue line could very well represent the “false floor” for the recovery I mentioned earlier. Provided Oil remained above this trendline, the illusion of growth via higher energy demand was firmly in place. And then Oil fell nearly 60% from top to bottom in less than six months.
As was the case for Coal, Oil’s drop was nothing short of a bubble bursting. From 2009 until 2014 Oil’s price was disconnected from economic realities. Then price discovery hit resulting in a massive collapse. Moreover, the damage to Oil was extreme. Not only did it collapse 60% in a matter of months. It actually TOOK out the trendline going back to the beginning of the bull market in 1999.
This is a classic “ending” pattern. Breaking a critical trendline (particularly one that has been in place for several decades) is one thing. Breaking it and then failing to reclaim it during the following bounce is far more damning. We’ve just reclaimed the line a week or so ago. But unless we hold here, Oil will be dropping down to $30 per barrel if not lower.
In short, the era the phony recovery narrative has come unhinged. We have now entered a cycle of actual price discovery in which financial assets fall to more accurate values. This will eventually result in a stock market crash, very likely within the next 12 months.
This Is the Housing Chart That Keeps One Economist Up at Night
http://www.bloomberg.com/news/articles/2015-06-12/scariest-u-s-housing-chart-shows-nasty-scar-years-after-bust
It’s the one chart that keeps Stan Humphries up at night.
A decade after U.S. home sales peaked, 15.4 percent of owners in the first quarter owed more on their mortgages than their properties were worth, according to a report Friday by Zillow Inc. While that’s down from a high of 31.4 percent in 2012, it’s still alarmingly above the 1 or 2 percent that marks a healthy market, said Humphries, the chief economist at the Seattle-based real-estate data provider. Worse yet: The pace of healing is losing steam.
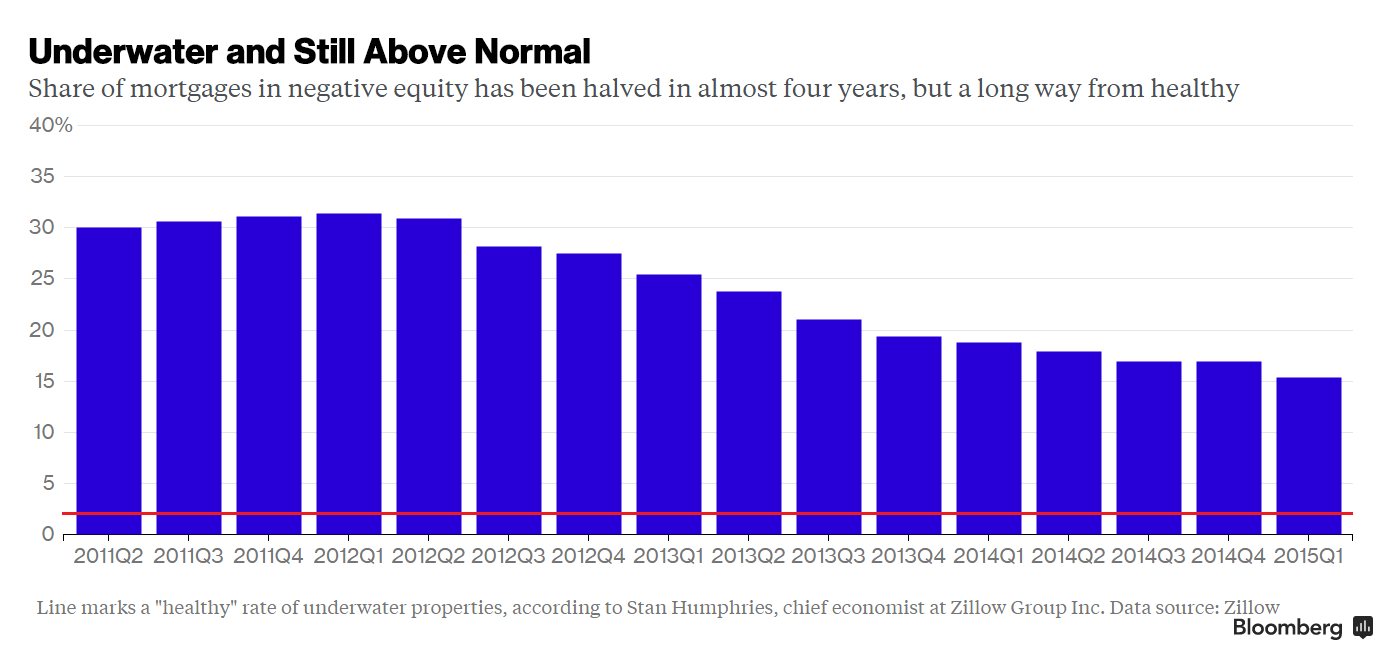
The blotch stains the economy by restraining the housing recovery and by preventing the job market from becoming even more vigorous. It also will probably exacerbate wealth inequality for years to come as homes valued in the bottom third of the market are more likely to be underwater.
“There’s a large swath of the housing market which could become quite static, which creates real long-term problems,” Humphries said.
The share of mortgage borrowers underwater in the first quarter was down 3.4 percentage points from 18.8 percent at the same time last year, according to the Zillow data. That’s a marked slowdown in the pace of improvement from the 6.6 point drop in the 12 months through March 2014. Just over half the owners were 20 percent or more away from breaking even...While the healthiest way for the underwater mortgages to heal is through home-price appreciation, those increases are diminishing. Residential property values nationally rose 4.14 percent in March from the prior year, according to the S&P/Case-Shiller index. The gauge has decelerated each month since the end of 2013, when it climbed 10.8 percent.
...The prospect of having so many properties lingering underwater, probably for another five or six years, is what unsettles Humphries.
MORE
http://www.bloomberg.com/news/articles/2015-06-12/scariest-u-s-housing-chart-shows-nasty-scar-years-after-bust
It’s the one chart that keeps Stan Humphries up at night.
A decade after U.S. home sales peaked, 15.4 percent of owners in the first quarter owed more on their mortgages than their properties were worth, according to a report Friday by Zillow Inc. While that’s down from a high of 31.4 percent in 2012, it’s still alarmingly above the 1 or 2 percent that marks a healthy market, said Humphries, the chief economist at the Seattle-based real-estate data provider. Worse yet: The pace of healing is losing steam.
The blotch stains the economy by restraining the housing recovery and by preventing the job market from becoming even more vigorous. It also will probably exacerbate wealth inequality for years to come as homes valued in the bottom third of the market are more likely to be underwater.
“There’s a large swath of the housing market which could become quite static, which creates real long-term problems,” Humphries said.
The share of mortgage borrowers underwater in the first quarter was down 3.4 percentage points from 18.8 percent at the same time last year, according to the Zillow data. That’s a marked slowdown in the pace of improvement from the 6.6 point drop in the 12 months through March 2014. Just over half the owners were 20 percent or more away from breaking even...While the healthiest way for the underwater mortgages to heal is through home-price appreciation, those increases are diminishing. Residential property values nationally rose 4.14 percent in March from the prior year, according to the S&P/Case-Shiller index. The gauge has decelerated each month since the end of 2013, when it climbed 10.8 percent.
...The prospect of having so many properties lingering underwater, probably for another five or six years, is what unsettles Humphries.
“The problem you could be creating is 15 to 20 percent of the housing stock becomes non-tradeable, which means inventory shortages continue, prices remain very spiky because liquidity is thin, and foreclosures remain very high,” he said.
MORE
In Minnesota, high employment and weak wages show Fed's quandary
http://www.reuters.com/article/2015/06/12/us-usa-fed-wages-insight-idUSKBN0OS0C320150612
By all rights wages should be soaring in Minnesota, a Midwestern state that boasts one of the best educated and well-paid workforces in the United States and where the unemployment rate stands at a 14-year low.
But explain that to Bernie Hesse, projects director for the United Food and Commercial Workers Union. For every bright spot - the 5 percent across the board pay rise just negotiated for the union's nursing home workers - there is a drag in the other direction.
Retail workers, who account for 6,000 of the union's 10,000 Minnesota members, agreed to keep wages flat to avoid an increase in health care premiums.
Health care is "where our members are in demand...There are no bodies," Hesse said, while "the retailers are saying: 'we will bargain pay for health care'."
...After more than five years of steady national job growth and with the U.S. economy perhaps approaching full employment, sustained pressure on wages is a final missing piece for the Fed's puzzle - necessary to conclude that the economy is near full capacity.
MORE
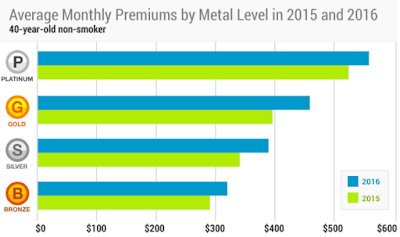
More Obamacare Sticker Shock: HMO Rates Up 20%, EPO Up 18%, 12% Overall; Death Spiral for Insurers?
http://globaleconomicanalysis.blogspot.com/2015/06/more-obamacare-sticker-shock-hmo-rates.html#ZwiYu0cmZxrTCP8E.99
If you did not have insurance before Obamacare, but do now, or if you are heavily subsidized, you may consider Obamacare a blessing.
If you are not in those select groups, then you are highly likely to be paying more for insurance now than before. And it's going to get worse. Some plan types really take a premium hit.
Premiums Jump 12% On Average
Health Pocket reports Obamacare Insurers Propose 12% Higher Premiums for 2016.

Plan Types
Bronze pays 60% of covered costs
Silver pays 70% of covered costs
Gold pays 80% of covered costs
Platinum pays 90% of covered costs
Network Types
Health maintenance organizations (HMOs)
Exclusive Provider Organizations (EPOs)
Point of Service (POS) plans
Preferred Provider Organizations (PPOs)
PPOs and POS plans cover out-of-network care, while HMOs and EPOs do not. EPO and PPO plans do not require referrals from primary care doctors to see specialists, but HMO and POS plans require referrals.
Sticker Shock Coming Up
67% have silver plans. The rates above are for a single 40-year old nonsmoker. Those 67% will see premium hikes ranging from 11% to 20% depending on the network type.
Bronze plans constitute another 22% of all plans. Those in Bronze network plans other than PPOs will see rates go up 15% to 20%.
Bronze PPO plans go up the least, only 4%, but PPO premiums started higher than the others.
Read more at http://globaleconomicanalysis.blogspot.com/2015/06/more-obamacare-sticker-shock-hmo-rates.html#ZwiYu0cmZxrTCP8E.99
http://globaleconomicanalysis.blogspot.com/2015/06/more-obamacare-sticker-shock-hmo-rates.html#ZwiYu0cmZxrTCP8E.99
If you did not have insurance before Obamacare, but do now, or if you are heavily subsidized, you may consider Obamacare a blessing.
If you are not in those select groups, then you are highly likely to be paying more for insurance now than before. And it's going to get worse. Some plan types really take a premium hit.
Premiums Jump 12% On Average
Health Pocket reports Obamacare Insurers Propose 12% Higher Premiums for 2016.
Plan Types
Bronze pays 60% of covered costs
Silver pays 70% of covered costs
Gold pays 80% of covered costs
Platinum pays 90% of covered costs
Network Types
Health maintenance organizations (HMOs)
Exclusive Provider Organizations (EPOs)
Point of Service (POS) plans
Preferred Provider Organizations (PPOs)
PPOs and POS plans cover out-of-network care, while HMOs and EPOs do not. EPO and PPO plans do not require referrals from primary care doctors to see specialists, but HMO and POS plans require referrals.
Sticker Shock Coming Up
67% have silver plans. The rates above are for a single 40-year old nonsmoker. Those 67% will see premium hikes ranging from 11% to 20% depending on the network type.
Bronze plans constitute another 22% of all plans. Those in Bronze network plans other than PPOs will see rates go up 15% to 20%.
Bronze PPO plans go up the least, only 4%, but PPO premiums started higher than the others.
Read more at http://globaleconomicanalysis.blogspot.com/2015/06/more-obamacare-sticker-shock-hmo-rates.html#ZwiYu0cmZxrTCP8E.99
Edit history
Please sign in to view edit histories.
Recommendations
0 members have recommended this reply (displayed in chronological order):
85 replies
 = new reply since forum marked as read
Highlight:
NoneDon't highlight anything
5 newestHighlight 5 most recent replies
RecommendedHighlight replies with 5 or more recommendations
= new reply since forum marked as read
Highlight:
NoneDon't highlight anything
5 newestHighlight 5 most recent replies
RecommendedHighlight replies with 5 or more recommendations
= new reply since forum marked as read
Highlight:
NoneDon't highlight anything
5 newestHighlight 5 most recent replies
RecommendedHighlight replies with 5 or more recommendations
Russia, China and the Battle Against Dollar Hegemony by MICHAEL HUDSON and THE SAKER
Demeter
Jun 2015
#2
How Big Business Invented the Theology of 'Christian Libertarianism' and the Gospel of Free Markets
Demeter
Jun 2015
#16
How a Corporate Cult Captures and Destroys the Best Graduates at British Universities
Demeter
Jun 2015
#17
Why the Super-Rich Pay Taxes on a Much Tinier Fraction of Their Income Than You Do
Demeter
Jun 2015
#25
I would pick this video for the end of this thread--but I'm likely to forget all about it by then
Demeter
Jun 2015
#33
How far south are you going? There's a tropical depression forming under the Yucatan
Demeter
Jun 2015
#40
Tomorrow 6/14/15 is the 50th anaversary of the 1965 flood here in Colorado (Denver)
Hotler
Jun 2015
#47
Obama Not Ruling Out U.S. Military Action In Congress ONLY IN THE ONION (AT THE MOMENT)
Demeter
Jun 2015
#75
U.S. Is Poised to Put Heavy Weaponry in Eastern Europe By ERIC SCHMITT and STEVEN LEE MYERS
Demeter
Jun 2015
#71
I am so sad to hear of Xchrom's passing. He had such heart and a beautiful sense of humor.
mother earth
Jun 2015
#82