Visits to "Places of Commerce" Still in Collapse Mode. Have Some of these Massive Shifts Become..... [View all]
Visits to “Places of Commerce” Still in Collapse Mode. Have Some of these Massive Shifts Become Permanent?
by Wolf Richter • Feb 15, 2021 •
People and businesses have changed how they do things. And it shows up in the GPS data.
By Wolf Richter for WOLF STREET.
One of the high-frequency data sets that came out of the Pandemic, and that we have been following to track the progress of the US economy, is an index by the American Enterprise Institute that tracks, based on cellphone GPS data, the number of people visiting “places of commerce” in the current week compared to the number of visits in the pre-Pandemic week ended January 15, 2020.
These “places of commerce” include offices, stores, malls, restaurants, hotels, movie theaters, airports, hospitals, other places of commerce and other points of interest in the 40 largest metro areas. The “Foot Traffic Index” measures how many people arrived at these locations, regardless of how they got there – by car, on foot, or by whatever other means.
What is stunning is the lack of recovery since June, and the deterioration in recent months to where the indexes of the 40 metros have dropped into a range that is between 71% and 38% of their foot traffic in January 2020 – the range between the two parallel red lines – according to the AEI’s index for the week through February 7, 2021 (click on the chart to enlarge it):
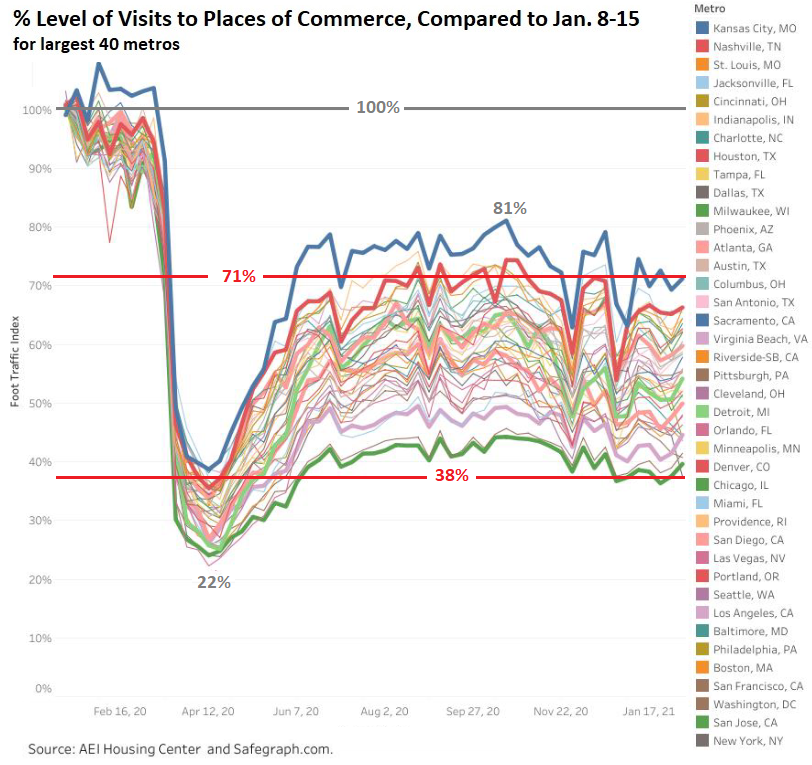
The top bold blue line is Kansas City (at 71% of January 2020 foot traffic). The bottom bold green line is San Jose (40%) and the thin gray dropping below San Jose is New York (38% of January 2020 foot traffic).
The bold lines in between Kansas City and San Jose represent Nashville (66%), Atlanta (60%), Detroit (54%), San Diego (50%), and Los Angeles (45%). Source: AEI Housing Center and Safegraph.com
Some of the obvious reasons.
Tourism: In San Francisco (41%), international tourism has collapsed, and domestic tourism is down too, many hotels remain closed, and others are nearly empty. New York City (at 38% of January 2020 foot traffic), Las Vegas (at 48%), Miami (at 51%) and some other cities with a big tourism industry are also impacted by the collapse of international tourism. ..............(more)
https://wolfstreet.com/2021/02/15/visits-to-places-of-commerce-still-in-collapse-mode-have-some-of-these-massive-shifts-become-permanent/

 = new reply since forum marked as read