Welcome to DU!
The truly grassroots left-of-center political community where regular people, not algorithms, drive the discussions and set the standards.
Join the community:
Create a free account
Support DU (and get rid of ads!):
Become a Star Member
Latest Breaking News
Editorials & Other Articles
General Discussion
The DU Lounge
All Forums
Issue Forums
Culture Forums
Alliance Forums
Region Forums
Support Forums
Help & Search
Markets - auto-self-updating embedded graphs: Dow, Oil, Dollar, Pound, Euro. Also: bonds and Listmania [View all]
This discussion thread is pinned.
Last edited Sat Dec 20, 2025, 12:26 PM - Edit history (33)
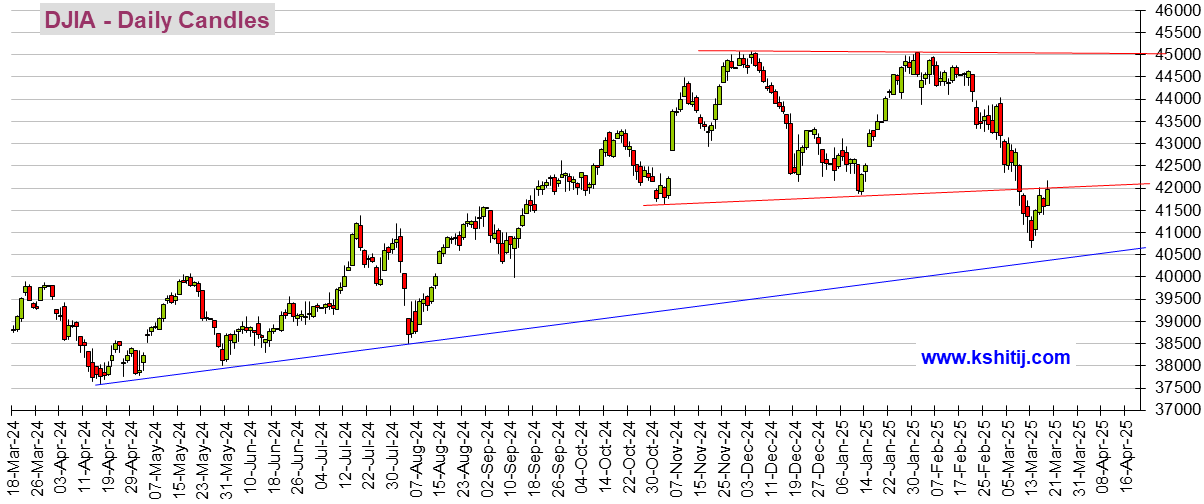
Dow, Oil, and Dollar (last 6 months) - they update a few hours (like about 6 hours) after the closeDow 30,
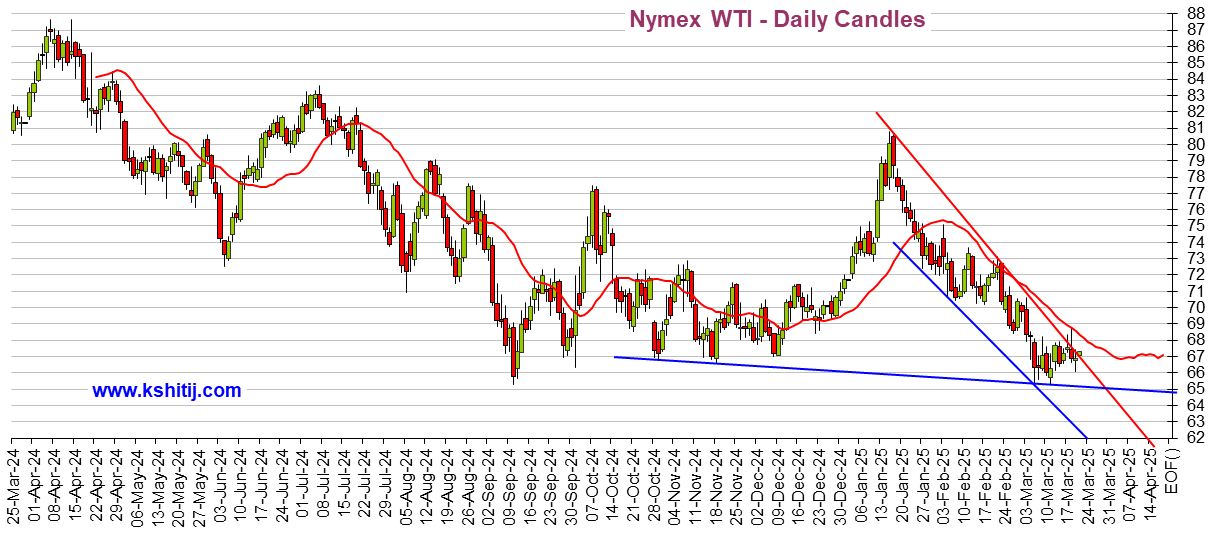
Crude Oil
US Dollar Index (DX-Y.NYB)
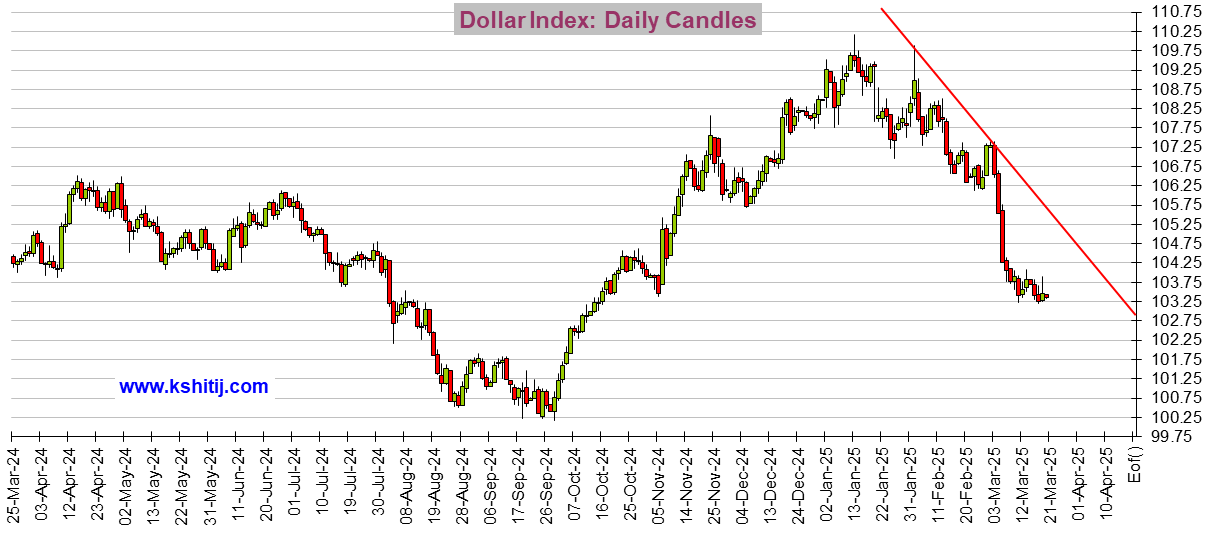
The graphs above and in the old Stock Market Watch update automatically. So they are up-to-date a few hours after each close.
There should be 3 graphs above. If you see little image squares and no graphs, right click on each such image square and choose Load Image.
Click LINKS TO GRAPHS (last Stock Market Watch - but note the graphs update automatically)
Or look above at the top of this OP for the 3 most important graphs:: Dow, Oil, and Dollar (they also update automatically). The other 2 graphs available at the above link are two currencies: the Pound and the Euro
Click bond yields and interest rates (post#4 below)
LISTMANIA
# Better than Biden. Ways EVERYTHING is (NOT) better now, usonian , /111699331
# 238 ways Trump was/is bad AZLD4Candidate, /100220312186
# Notes on the Crises: Currently: Comprehensive coverage of the T&M Treasury Payments Crisis of 2025, usonian, (it's pinned in the Economy Group) /111699437
# NAACP lists companies that dump DEI in its tactical spending guide for Black Americans, BumRushDaShow, /10143397368
# List of DUers on BlueSky, Native, /100220012446
NEW 12/2025
# Project 2025 Tracker - “A comprehensive, community-driven initiative to track the implementation of Project 2025's policy proposals”, Hugin , /1116101438
# Horrible companies to think about refraining from doing business with . The title is of the OP is "Trump Supporting Companies You Can Boycott" by BoycottTwitter, but is broader than that. /100220880077
===========================================================================
Re: Stock Market Watch - I always enjoyed scrolling through the graphs to see the trends, THANKS TANSY_GOLD !!!
Fortunately, since the embedded graphs update on their own, we can still see the latest (as of today's close, about 6 hours after the close) or as of the preceding day's close, from any SMW no matter how old.
Unfortunately the text (e.g. Dow, S&P 500, and Nasdaq) don't update, maybe there's a source for those that can be embedded and updates itself like the graphs, I'm not willing to type these in every day. Maybe weekly at the end of the week. I'll ask General Computer Help for any ideas if somebody doesn't have a solution here.
Myself, I look at the "ribbon of market values" at the top of https://finance.yahoo.com ,
S&P 500, Dow 30, Nasdaq, Russell 2000 (small caps), Crude Oil, Gold, Silver, Euro, 10-Year Treasury, Pound, Yen, Bitcoin, XRP (some cryptocurrency thing), FTSE (UK market), Nikkei
US Dollar Index (DX-Y.NYB)
Trouble in paradise: Much of the time, after market close, when I click the above finance.yahoo.com or finance.yahoo.com/calendar link, it shows me futures. Sometimes that's what I want. But often I want to see the last closing price. And when the market is open, it shows the current moment's prices. That is usually what I want, but if I'm wanting to see the last closing prices, well, its additional work to get those, one at a time, e.g. click on Dow and then it will put up a page with last closing price and numerous other stats. Repeat above for the S&P 500 ... It's strange that in this day and age everything has to be so damn hard when it could be real easy.
Latest S&P 500 close, including its percent change since election day, since the last close before inauguration day, year-to-date, and since the February 19 all-time-high are updated daily at https://www.democraticunderground.com/111699775
Bonds Here's a mini-page on current yields of Treasuries: 13 week, 5Y, 10Y, and 30Y. https://finance.yahoo.com/bonds/
(The "CBOE Interest Rate 10 Year T No" is just the 10 year treasury yield. Why they couldn't label it "Treasury Yield 10 Years" -- the same as they label the 5 year version "Treasury Yield 5 Years", and the 30 year version "Treasury Yield 30 Years" -- I don't know
For more on bonds, see post#4 .
A few more useful links
GDPNow (estimate of GDP in next quarter) -
Latest Inflation graphs and summary table for all 3 major inflation measures: CPI, PCE, PPI (wholesale prices), both the headline "all items" version and the "core" version. The next update will be when the CPI comes out October 10 (followed by the PPI the next day). If I'm tardy in updating the above link, try my journal, it should be near the top.
FedWatch - CME FedWatch Tool (predicts Feds Fund rates) https://www.cmegroup.com/markets/interest-rates/cme-fedwatch-tool.html
Economic Reports Calendar - https://www.marketwatch.com/economy-politics/calendar MahatmaKaneJeeves thread of this calendar - dunno if the link is permanent, so for now look for it in pinned posts at the top of the Economy Group listings.
5 replies
 = new reply since forum marked as read
Highlight:
NoneDon't highlight anything
5 newestHighlight 5 most recent replies
= new reply since forum marked as read
Highlight:
NoneDon't highlight anything
5 newestHighlight 5 most recent replies
= new reply since forum marked as read
Highlight:
NoneDon't highlight anything
5 newestHighlight 5 most recent replies