Welcome to DU!
The truly grassroots left-of-center political community where regular people, not algorithms, drive the discussions and set the standards.
Join the community:
Create a free account
Support DU (and get rid of ads!):
Become a Star Member
Latest Breaking News
Editorials & Other Articles
General Discussion
The DU Lounge
All Forums
Issue Forums
Culture Forums
Alliance Forums
Region Forums
Support Forums
Help & Search
Environment & Energy
In reply to the discussion: Hansen misguided about value of nuclear [View all]
OKIsItJustMe
(22,094 posts)23. What does the EIA have to say?
http://www.eia.gov/forecasts/aeo/er/early_carbonemiss.cfm
[font face=Serif][font size=3]…
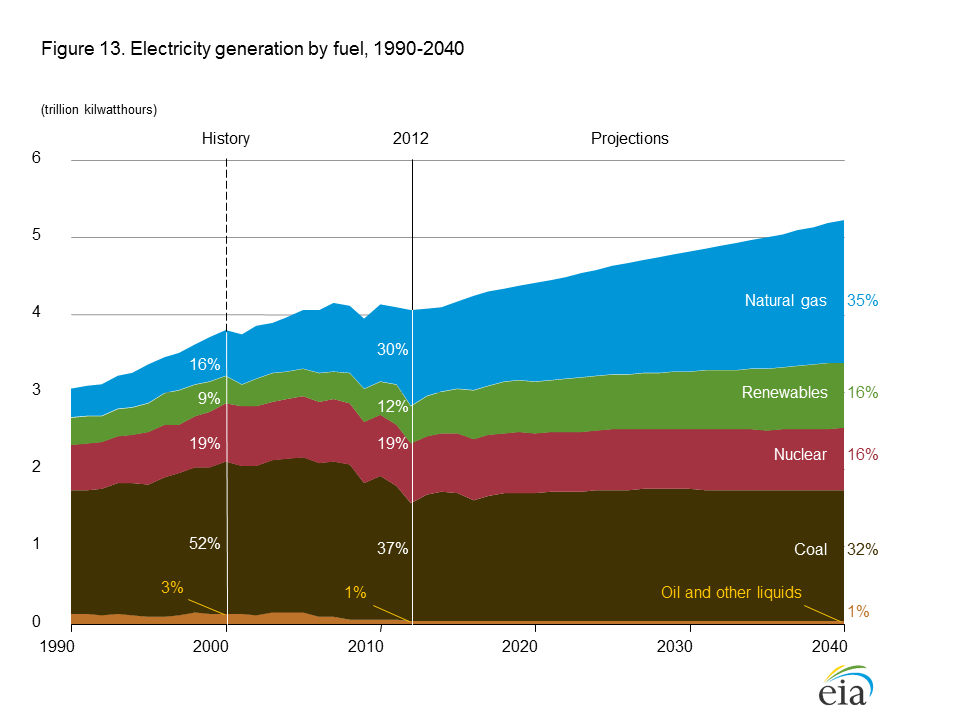
The projected growth rate for U.S. energy-related CO[font size="1"]2[/font] emissions has declined successively in each Annual Energy Outlook since AEO2005 (see Figure 13, which shows projections starting with AEO2009), reflecting both market and policy drivers. Using 2030 as a common year, the AEO2006 projection for total energy-related CO[font size="1"]2[/font] emissions was 8,114 million metric tons, with coal accounting for 3,226 million metric tons (40 percent) and natural gas 1,452 million metric tons (18 percent). In AEO2010, total energy-related CO[font size="1"]2[/font] emissions had dropped to 6,176 million metric tons in 2030, with 2,296 million metric tons (37 percent) coming from coal and 1,315 million metric tons (21 percent) from natural gas. In AEO2013, the 2030 values have fallen to 5,523 million metric tons for total energy-related CO[font size="1"]2[/font] emissions, with 1,874 million metric tons (34 percent) coming from coal and 1,468 metric tons (27 percent) from natural gas. The change reflects both market and policy factors, including the adoption of tighter economy fuel standards, the implementation of efficiency standards, and a continued shift to less carbon-intensive fuels.[/font][/font]
The projected growth rate for U.S. energy-related CO[font size="1"]2[/font] emissions has declined successively in each Annual Energy Outlook since AEO2005 (see Figure 13, which shows projections starting with AEO2009), reflecting both market and policy drivers. Using 2030 as a common year, the AEO2006 projection for total energy-related CO[font size="1"]2[/font] emissions was 8,114 million metric tons, with coal accounting for 3,226 million metric tons (40 percent) and natural gas 1,452 million metric tons (18 percent). In AEO2010, total energy-related CO[font size="1"]2[/font] emissions had dropped to 6,176 million metric tons in 2030, with 2,296 million metric tons (37 percent) coming from coal and 1,315 million metric tons (21 percent) from natural gas. In AEO2013, the 2030 values have fallen to 5,523 million metric tons for total energy-related CO[font size="1"]2[/font] emissions, with 1,874 million metric tons (34 percent) coming from coal and 1,468 metric tons (27 percent) from natural gas. The change reflects both market and policy factors, including the adoption of tighter economy fuel standards, the implementation of efficiency standards, and a continued shift to less carbon-intensive fuels.[/font][/font]
Edit history
Please sign in to view edit histories.
Recommendations
0 members have recommended this reply (displayed in chronological order):
35 replies
 = new reply since forum marked as read
Highlight:
NoneDon't highlight anything
5 newestHighlight 5 most recent replies
RecommendedHighlight replies with 5 or more recommendations
= new reply since forum marked as read
Highlight:
NoneDon't highlight anything
5 newestHighlight 5 most recent replies
RecommendedHighlight replies with 5 or more recommendations
= new reply since forum marked as read
Highlight:
NoneDon't highlight anything
5 newestHighlight 5 most recent replies
RecommendedHighlight replies with 5 or more recommendations
OK, so is it your contention that Botswana would be better off if US emissions were going up!?
OKIsItJustMe
Jul 2013
#6
They are dealing specifically with what he signed his name to in that paper.
kristopher
Jul 2013
#25