The Growth of Solar Capacity In California, Capacity Utilization, and Solar Energy Production. [View all]
This post, about solar energy in California, is rather similar to the one I wrote yesterday about Wind Energy in California, with some differences. The remarks on nuclear energy capacity utilization are repeated verbatim here, but as California is one of the rare places where solar energy produces more energy than wind energy, I will compare the total energy produced by solar means in California, with the total energy demand of the State, using the figures from 2019, since these are the most recent available.
Accessed today (7/28/21), the amount of energy consumed by California in 2019, for all purposes, was 7082 trillion BTU according to the EIA Web Page devoted to California. I will use SI units throughout the rest of this post. The SI unit of energy is the Joule (J), and the prefix "Peta" (P) refers to 10 raised to the 15th power, and "Exa" (E) to 10 raised to the 18th power.
A BTU = 1055 J. Thus California's Energy Consumption in 2019 was 7.472 EJ.
In 2019, total US energy consumption was 106 EJ
As of this writing, 17:02 (5:02) PDT 7/28/21, California is under an electrical energy alert:
The California ISO is declaring CAISO Grid RESTRICTED MAINTENANCE OPERATION for the period
from 07/27/2021 12:00 through 07/28/2021 21:00.
Reason:
The ISO is anticipating high loads and temperatures across t|he CAISO Grid. Transmission Operators and Generation Operato|rs will be contacted if any currently scheduled outages need| to be cancelled or revised.
Refer to the ISO System Emergency Fact Sheet (http://www.caiso.com/Documents/SystemAlertsWarningsandEmergenciesFactSheet.pdf)
for additional detail.
Restricted Maintenance Operations, as detailed in ISO Operating Procedure
4420, will be in effect.
Market Participants are cautioned to avoid actions which may
jeopardize generator and/or transmission availability.
Monitor system conditions on Today's Outlook (http://www.caiso.com/TodaysOutlook/Pages/default.aspx)
and check with local electric utilities for additional information.
Notice issued at: 07/23/2021 12:34
California's energy demand peak will occur just about at the time the sun is going down. At that time, solar energy will be essentially useless.
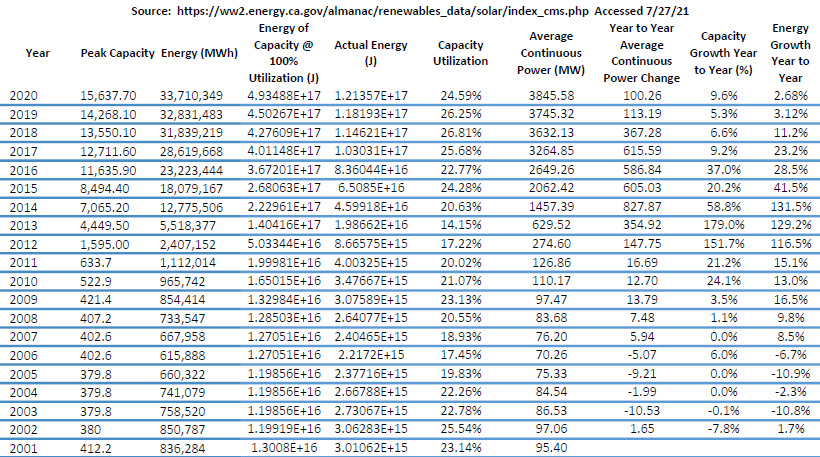
The data in the table in post comes from a web page of the California Energy Commission in table to which one can scroll down on this page: Solar PV and Solar Thermal Electricity Production (Annual Totals; Includes Imports)
I have imported the table into Excel, and then did some calculations using this data. Solar plant power ratings, which are often cited by advocates of this form of energy which has failed spectacularly to address climate change after half a century of cheering, are cited as peak power, which is the maximal power the turbine would manage under perfect windy conditions, which in practice are never observed.
It is dishonest - not that anyone cares anymore about dishonesty - to represent a solar plant, which is dependent on whims of weather as well as the time of day as a plant that can, in theory run continuously at full power, such as a gas plant or a coal plant, or even a plant of a type that has been observed to run at 100% (or better) of capacity, something observed only in nuclear plants.
For example, one can find the capacity utilization of all of the nuclear reactors operating in the United States as of 2020 here: EIA Nuclear Energy Page by clicking on the 2020P Excel File in the table on the right. Of 94 nuclear reactors operating the in the United States in 2020, 70 operated at 90% capacity utilization or better, and of these, 24 operated at 100% of capacity or more. Five operated at capacity utilization of less than 80%. One of these was Diablo Canyon reactor #2, which operated at 74.8% of capacity, apparently for refueling and maintenance. It produced 7,348,123 MWh of electricity, or 26.5 PetaJoules of electricity (0.0265 EJ) in one small building. Diablo Canyon #2 operated at 90.4% capacity utilization, producing 8,910,575 MWh of electricity, or 32.1 PetaJoules, or (0.0321 EJ).
In the table below, I have included a theoretical amount of energy that solar plants would produce if they operated at 100% of capacity utilization, using the SI unit of energy, the Joule. I have also converted the power actually produced from MWh to Joule in order to calculate the ratio of the latter to the former to give capacity utilization. I have then calculated the average continuous power of all the solar plants in California, by the number of seconds in a sidereal year, 86400 seconds/day*365.24 days/year = 31,556,736 seconds. This gives the average power in Watts, but the spreadsheet divides this number by 1,000,000 to give a MW. Theoretically, ignoring the inherent lumpiness in wind power which produces what it produces without respect to demand, this gives a feel for the capacity of a nuclear powerplant that could produce more energy than all the solar plants in California. The next two columns give the growth or decline in name plate capacity compared to the previous year, as well the growth or decline in actual energy produced by all the solar plants in California.
I have also included a column for the size of a putative plant, operating at 100% capacity utilization, that would represent the growth in solar energy output, which has increased monotonically since 2007. For example, building a small 100 MW power plant of any type, would match the increase in solar power output from 2019 to 2020. This too, is misleading, since solar plants do not produce energy - in fact the wires connected to them draw power out of the grid, at night. Thus solar plants always require a redundant system to back it up. The fantasy - and it is certainly not a clean fantasy since battery production is neither environmentally benign nor sustainable - is that batteries can deal with this issue. As a practical matter, however, it is dangerous natural gas combustion, with the waste dumped directly into the waste dump, the planetary atmosphere, that is the redundant system.
The table of California's Solar Energy performance in the 21st century:
Comparison of the total production of all of the solar installations in the State of California with the State's overall energy demand, as well as the sum of all solar energy produced in the 21st century by this popular form of energy:

In this entire century, from 2001 to 2020, all of the solar facilities in California, the state having the largest solar capacity in the United States, have not produced even one exajoule of energy, this on a planet where humanity is consuming each year about 600 exajoules of energy.
By the way, I moved to California three times in my life, the first being in 1974. I left the State for good in 1993. The whole time I lived there, everyone was cheering, myself included, for an expected solar energy nirvana. It's not like California was producing just 1.58% of its energy by solar means when people began cheering for it. On the contrary, it's after half a century of cheering.
Some people, myself included, think that the outbreak of massive fires on the West Coast of the United States, as well as in many other parts of the world, Siberia, Sardinia, Australia, etc...etc...etc... ad nauseum are related from climate change.
This should - although it won't - produce some dose of reality about how effective all this cheering, endless cheering, for a putative solar nirvana has been at addressing climate change.
The Diablo Canyon Nuclear Plant, due to shut because of appeals to fear and ignorance, has been producing today, in California, between 2,262 and 2,267 MW of electricity reliably all day long in two small buildings, the footprint of which, including its parking lot, is about 12 acres of land, located on a 700 acre plot of land that is mostly undisturbed marine chaparral. In terms of average continuous power, two such plants could produce more energy, more reliably, and more predictably, than all of the solar energy facilities in the State of California as well as solar plants in neighboring states that export electricity to California.
The Diablo Canyon Nuclear Plant is something of an antique, having been designed around 1970's technology. Its thermodynamic efficiency is around 33%.
I was telling my son, who visited briefly yesterday, about a path, via heat networks, by which the thermal efficiency of a nuclear plant with a slightly larger foot print, might achieve or approach efficiencies of approximately 80%, via a network of Brayton, reverse Allam, thermochemical hydrogen production, supercritical water, and rankine cycles, all run off the same heat stream, albeit not necessarily in this order. The little brat engineer found this argument credible.
By the way, if one spends a lot of time reading the primary scientific literature about displacing the chemicals obtained by using fossil fuels utilizing putative solar thermal plants, like the one at Ivanpah in California, which fries birds in flight, about 6,000 per year. There are thousands upon thousands of papers about solar furnace liquid fuel production published, too many in fact to count. The only chemical energy produced by Ivanpah is the chemical energy available from the combustion of charred birds.
The poor performance of the Ivanpah plant, which sometimes ends up burning dangerous natural gas to improve it's poor performance, may account for the years in which California's solar capacity utilization fell below 20%.
These papers are not, however, useless. They are probably structured the way they are to appeal to popular enthusiasm, insipid popular enthusiasm, but nonetheless real popular enthusiasm, for solar energy to get research grants. The heat source need not be solar however. Nuclear heat is more reliable, and more environmentally sustainable, since it is continuously and reliably available. Continuous processes are almost always economically and environmentally superior to batch or discontinuous processes.
I regard opposition to nuclear energy as morally and intellectually equivalent to opposition to Covid vaccines. Both kill people by appeal to popular ignorance.
Solar energy has not addressed or even slowed climate change; it is not addressing or slowing climate change; it will not address or slow climate change. It may be time to wake up.
The rate of climate change is climbing not falling. It is worse than ever. People are literally dying in the streets from excessive heat.
That's a fact. Facts matter.
Have a nice day tomorrow.
 = new reply since forum marked as read
Highlight:
NoneDon't highlight anything
5 newestHighlight 5 most recent replies
= new reply since forum marked as read
Highlight:
NoneDon't highlight anything
5 newestHighlight 5 most recent replies