Welcome to DU!
The truly grassroots left-of-center political community where regular people, not algorithms, drive the discussions and set the standards.
Join the community:
Create a free account
Support DU (and get rid of ads!):
Become a Star Member
Latest Breaking News
Editorials & Other Articles
General Discussion
The DU Lounge
All Forums
Issue Forums
Culture Forums
Alliance Forums
Region Forums
Support Forums
Help & Search
2016 Postmortem
In reply to the discussion: Factual talking points on the economy (UPDATED) [View all]
progree
(12,720 posts)65. Graph of rising productivity and stagnant wages and household incomes. Plus growing inequality stats
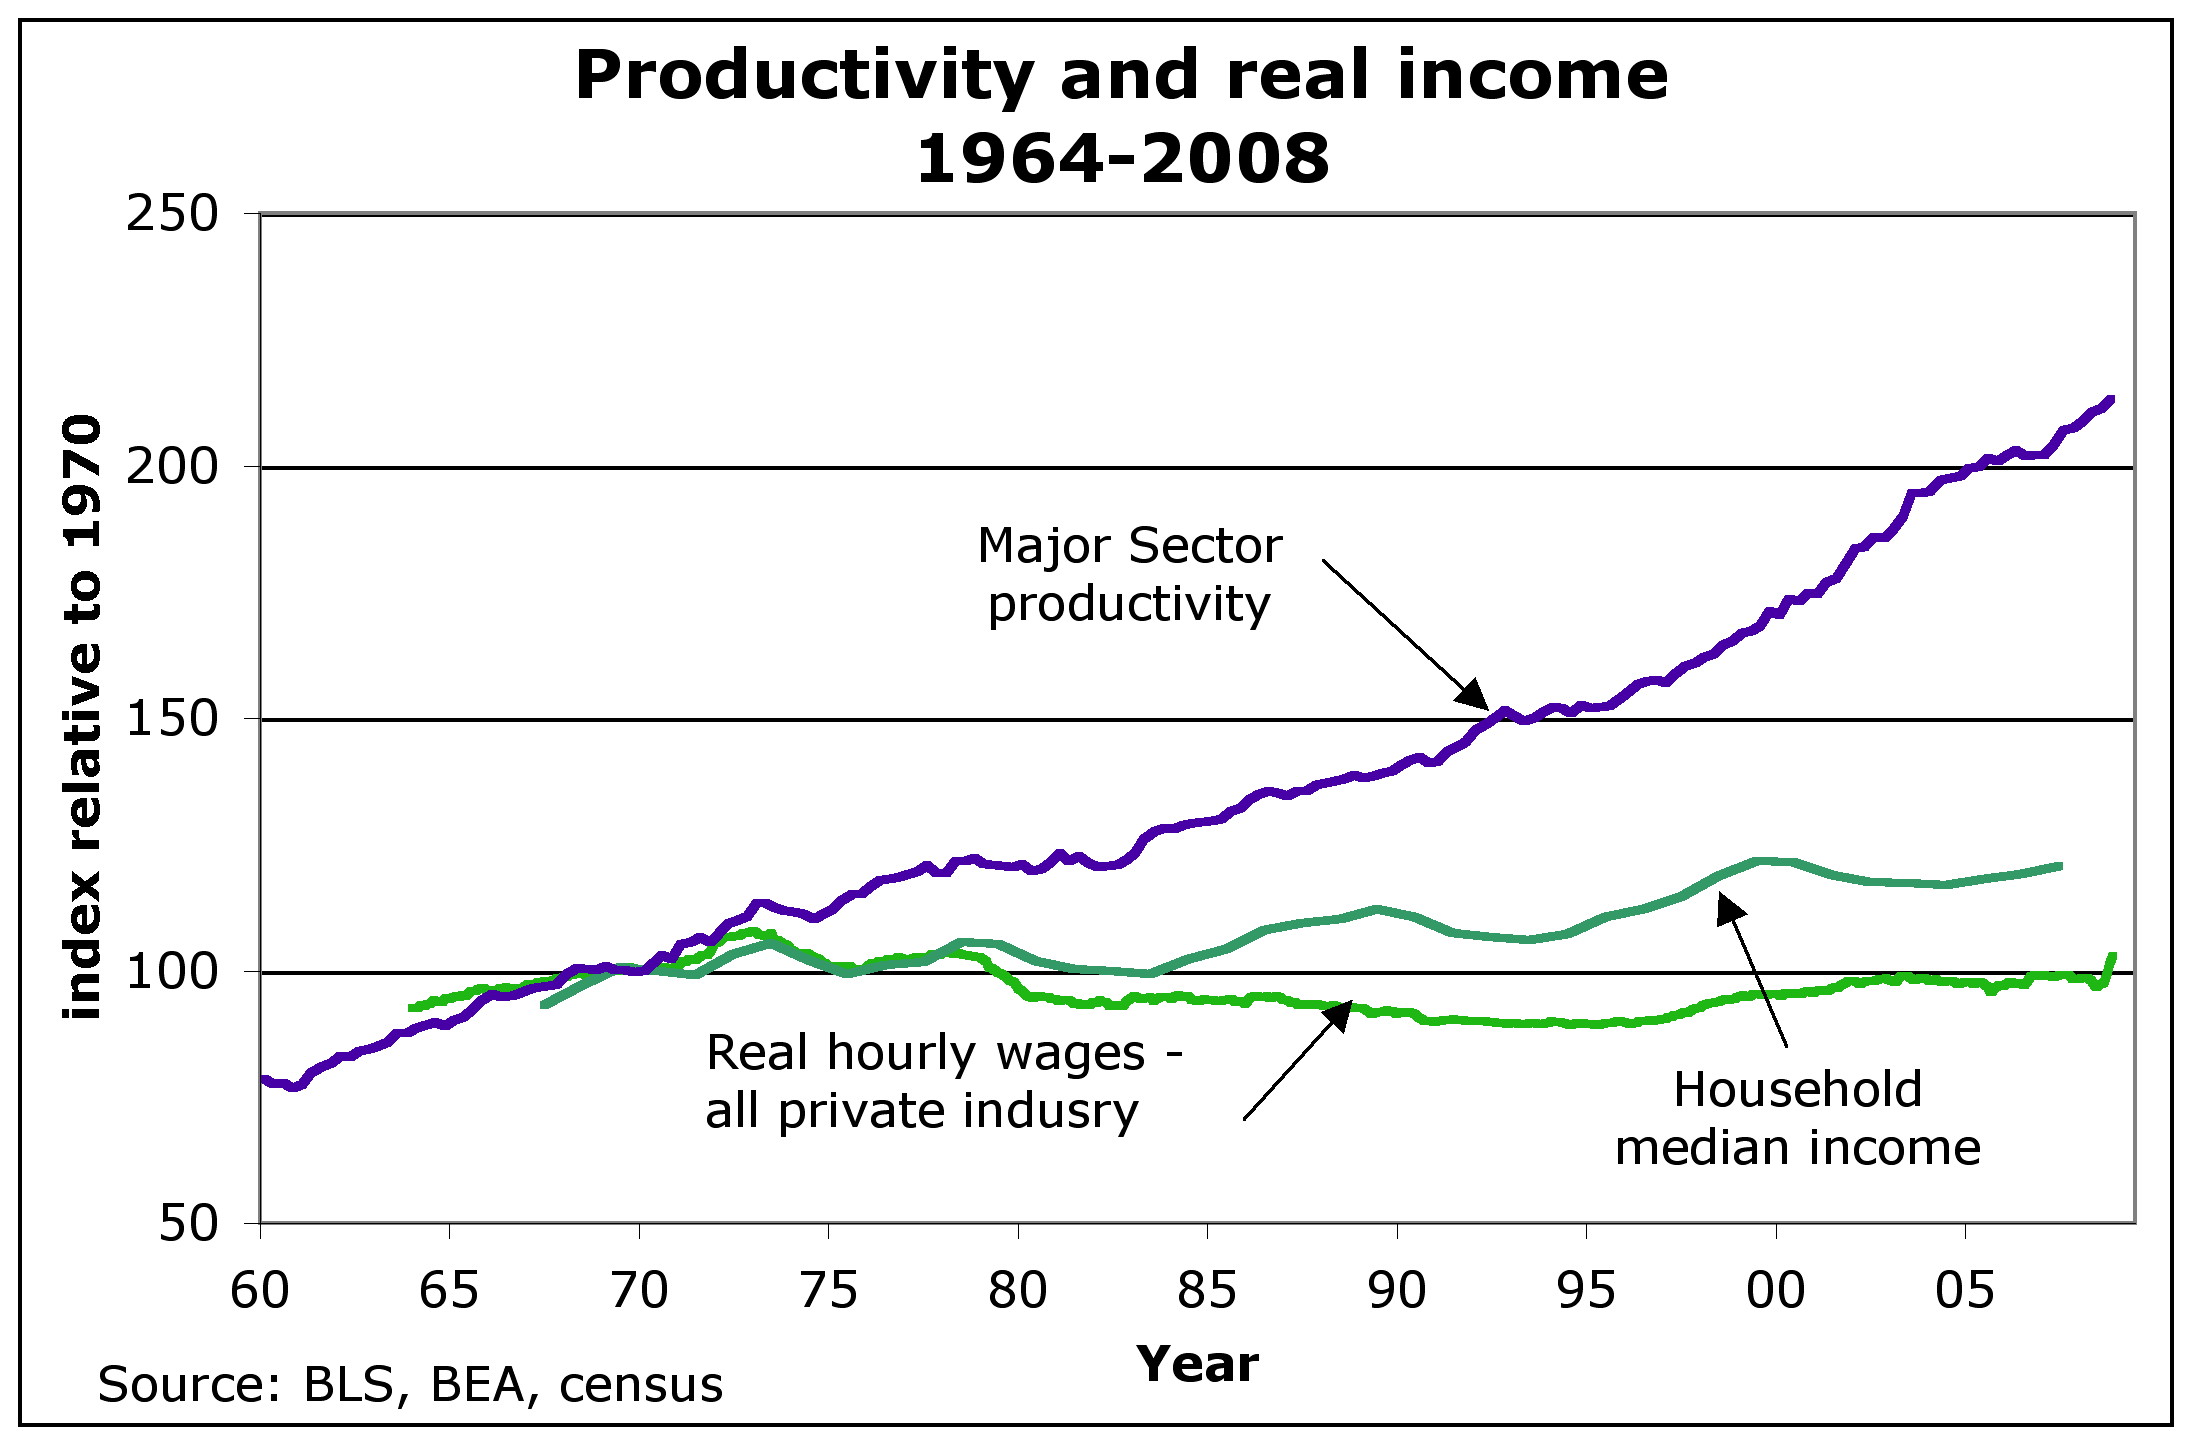
URL for above (replace the {dot} with . ): http://anticap.files.wordpress.com/2010/11/fig2_prodhhincome{dot}jpg
See also #28 above in the present thread for Corporate profits and wages as percent of economy http://www.democraticunderground.com/?com=view_post&forum=1251&pid=75268
Virtually all of the productivity gains since 1979 have flowed to the top 1% of income earners. - David Frum, Newsweek 7/2/12
The Top 1% and percent of the nation's income: 1928: 23.9%, Late 1970's: 8 to 9%, 2007: 23.5% (includes capital gains) - The Nation 7/19/10
The Newsweek 1/13/12 article by Niall Ferguson has very similar, is probably the source of the above: "According to Berkeley economist Emmanuel Saez, the share or total income going to the top 1% of families has more than doubled since 1979, from below 10% to a peak of nearly 24% in 2007 (it has since fallen, but not by much). The share going to the super-rich -- the top 0.01% -- has risen by a factor of 7."
(David Frum is the former Bush adviser or somesuch that has turned lefty in the last year or two or so. Its odd that Niall Ferguson would write about growing inequality {he wrote the Newsweek cover story hit piece on Obama 3 or so weeks ago}
Average HOUSEHOLD Income (2007 $) -- post-transfer and post-tax incomes.
[div style="display:inline; font-size:1.37em; font-family:monospace; white-space:pre;"] Year 1979 2007 %increase
[div style="display:inline; font-size:1.37em; font-family:monospace; white-space:pre;"] Top 1% (P1) 350,000 1,300,000 271.4%
[div style="display:inline; font-size:1.37em; font-family:monospace; white-space:pre;"] Mid 60% (Q2+Q3+Q4) 44,000 57,000 29.5%
[div style="display:inline; font-size:1.37em; font-family:monospace; white-space:pre;"] Bottom 20% (Q5) 15,500 17,500 12.9%
[font size=2] [2] Lane Kenworthy, using data from the Congressional Budget Office
http://lanekenworthy.net/2010/07/20/the-best-inequality-graph-updated/
http://www.cbo.gov/publications/collections/collections.cfm?collect=13 [/font]
The following is a pithy summary of much of the above for the message board wars:
[font color="blue"]In inflation-adjusted dollars -- From 1979 to 2007 the top 1% increased their income by 271% while the middle 60% increased by only 30%. Virtually all the productivity gains since 1979 has gone to the top 1%. Their share of the nation's income has increased from about 9% to 24%. [/font]
Edit history
Please sign in to view edit histories.
Recommendations
0 members have recommended this reply (displayed in chronological order):
79 replies
 = new reply since forum marked as read
Highlight:
NoneDon't highlight anything
5 newestHighlight 5 most recent replies
RecommendedHighlight replies with 5 or more recommendations
= new reply since forum marked as read
Highlight:
NoneDon't highlight anything
5 newestHighlight 5 most recent replies
RecommendedHighlight replies with 5 or more recommendations
= new reply since forum marked as read
Highlight:
NoneDon't highlight anything
5 newestHighlight 5 most recent replies
RecommendedHighlight replies with 5 or more recommendations
Excellent post. People need a basic lesson on the unemployment rates, too, (U3 versus U6)
NYC_SKP
Aug 2012
#2
20 of the 22 states with the highest proportion of non-federal-income-tax-payers are Repub states
progree
Sep 2012
#67
Another lesson, about the myth that those who exhaust their unemployment insurance are not counted
progree
Aug 2012
#48
Obama has signed 21 tax cuts for the middle class & proposed $4 trillion in debt reduction
CabCurious
Aug 2012
#7
I've got a BA in Econ. and believe me the Republicans got nothing but their rabid base.
xtraxritical
Aug 2012
#12
In other words, there is still huge amounts of debt being added every year :(
CabCurious
Aug 2012
#11
Democratic presidents have created jobs at a faster rate than Republicans (2m/y vs 1m/y).
CabCurious
Aug 2012
#23
The Republicans would be lying about their own commitment to the stimulus and bailouts
CabCurious
Aug 2012
#27
Defense spending is apparently around 50% of our discretionary spending, 1/3 of total spending
CabCurious
Aug 2012
#32
Outstanding work. But the defense spending is about half of fed. discretionary spending, not total
progree
Aug 2012
#33
You'll find defense spending figures of 700Bish, 900Bish, and $1.2Tish because
CabCurious
Aug 2012
#37
Is it 2 Pinocchios or 3 to indicate defense spending is over half when at most its about 1/3?
progree
Aug 2012
#53
Like I said, I agree it's about 1/3 of total spending. The chart showing more than 50% is...
CabCurious
Aug 2012
#57
And so? I have investments in probably every sizable U.S. company with marketable shares through
progree
Aug 2012
#43
"And for the record, I consider the entire dialogue about fannie/freddie... to be a red herring."
progree
Aug 2012
#51
I was just wondering the significance of the fannie/freddie mention in #42. Thank you.
progree
Aug 2012
#54
Kicking, because this thread is awesome and should be bookmarked by everybody. (nt)
apnu
Sep 2012
#63
Graph of rising productivity and stagnant wages and household incomes. Plus growing inequality stats
progree
Sep 2012
#65
Inequality - a collection of graphics - Money Masters, Created by: ForensicAccounting.net
progree
Oct 2012
#74
Some more graphics. The food price inflation one is interesting (ouch). Glad I gave up food
progree
Sep 2012
#69
EF 0. Economy facts - tons of numbers to refer to in message board wars. With official sources
progree
Oct 2012
#73