NNadir
NNadir's JournalHow evolution builds genes from scratch.
The news item I'll discuss in this post is this one: How evolution builds genes from scratch
I don't think I logged into Nature when I saw it, so I think it's open sourced.
A lot of my day to day work is involved in proteomics either directly or indirectly. I am therefore often required to think about protein isoforms, many of which arise from genetic differences in people and related organisms; there is little more fascinating than seeing those forms highly conserved throughout evolution in comparison to variable, and indeed, vestigial proteins and sequences.
A surprise of the discovery of automated gene sequencing that led to the result of the human genome sequence, as the subsequent gene mapping of many other species is how much "junk DNA" there is, some of which is artifacts of ancient viral infections in ancestors or ancestral organisms.
This news article suggests that new genes can sometimes arise from turning on "junk DNA."
Some excerpts:
PDF version
5-inch Arctic cod in hollows of ice floes in the Arctic Ocean
Some cod species have a newly minted gene involved in preventing freezing.Credit: Paul Nicklen/NG Image Collection
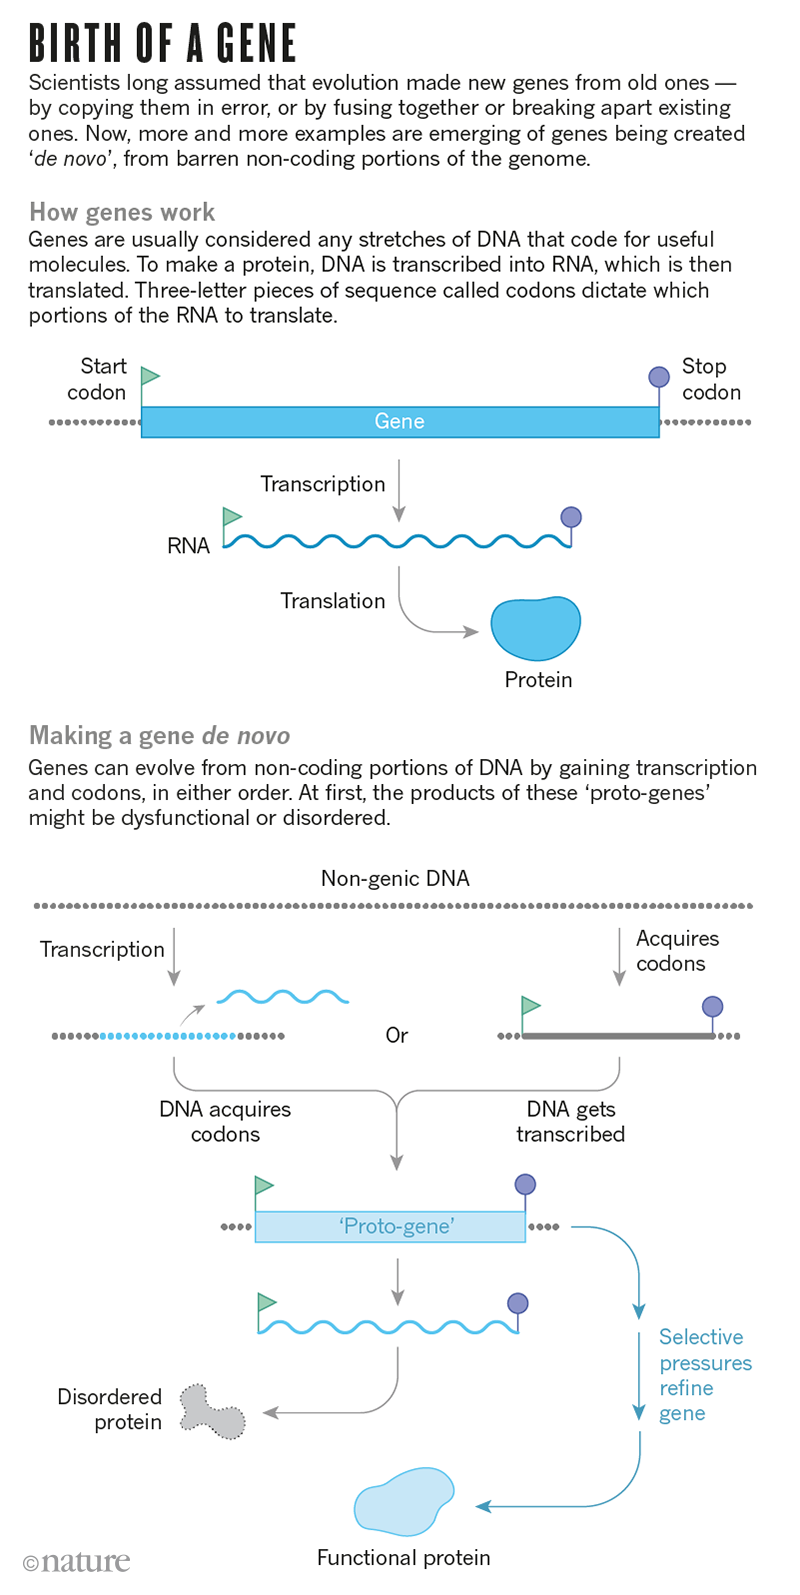
In the depths of winter, water temperatures in the ice-covered Arctic Ocean can sink below zero. That’s cold enough to freeze many fish, but the conditions don’t trouble the cod. A protein in its blood and tissues binds to tiny ice crystals and stops them from growing.
Where codfish got this talent was a puzzle that evolutionary biologist Helle Tessand Baalsrud wanted to solve. She and her team at the University of Oslo searched the genomes of the Atlantic cod (Gadus morhua) and several of its closest relatives, thinking they would track down the cousins of the antifreeze gene. None showed up. Baalsrud, who at the time was a new parent, worried that her lack of sleep was causing her to miss something obvious.
But then she stumbled on studies suggesting that genes do not always evolve from existing ones, as biologists long supposed. Instead, some are fashioned from desolate stretches of the genome that do not code for any functional molecules. When she looked back at the fish genomes, she saw hints this might be the case: the antifreeze protein — essential to the cod’s survival — had seemingly been built from scratch1.
The cod is in good company. In the past five years, researchers have found numerous signs of these newly minted ‘de novo’ genes in every lineage they have surveyed. These include model organisms such as fruit flies and mice, important crop plants and humans; some of the genes are expressed in brain and testicular tissue, others in various cancers...
...Back in the 1970s, geneticists saw evolution as a rather conservative process. When Susumu Ohno laid out the hypothesis that most genes evolved through duplication2, he wrote that “In a strict sense, nothing in evolution is created de novo. Each new gene must have arisen from an already existing gene.”
Gene duplication occurs when errors in the DNA-replication process produce multiple instances of a gene. Over generations, the versions accrue mutations and diverge, so that they eventually encode different molecules, each with their own function. Since the 1970s, researchers have found a raft of other examples of how evolution tinkers with genes — existing genes can be broken up or ‘laterally transferred’ between species. All these processes have something in common: their main ingredient is existing code from a well-oiled molecular machine...
...But genomes contain much more than just genes: in fact, only a few per cent of the human genome, for example, actually encodes genes. Alongside are substantial stretches of DNA — often labelled ‘junk DNA’ — that seem to lack any function. Some of these stretches share features with protein-coding genes without actually being genes themselves: for instance, they are littered with three-letter codons that could, in theory, tell the cell to translate the code into a protein.
It wasn’t until the twenty-first century that scientists began to see hints that non-coding sections of DNA could lead to new functional codes for proteins. As genetic sequencing advanced to the point that researchers could compare entire genomes of close relatives, they began to find evidence that genes could disappear rather quickly during evolution...
...Some of these genes-in-waiting, or what Carvunis and her colleagues called proto-genes, were more gene-like than others, with longer sequences and more of the instructions necessary for turning the DNA into proteins. The proto-genes could provide a fertile testing ground for evolution to convert non-coding material into true genes. “It’s like a beta launch,” suggests Aoife McLysaght, who works on molecular evolution at Trinity College Dublin...
The nice cartoon in the news article:
Interesting I think.
From bomb to Moon: a Nobel laureate of principles
When I was a kid, I used to spend a lot of time at Urey Hall on the UCSD campus. Urey, of course, is the discoverer of deuterium.
At that time of my life I didn't think all that much about Urey, which was my loss. (I was a stupid kid and am now a somewhat less stupid adult.)
Nature has a review of a biography of Urey, and I'm going to put it on my list of "need to read someday."
From bomb to Moon: a Nobel laureate of principles
I think the review is open sourced, but if it isn't, some excerpts:
After witnessing the 1945 Trinity atomic-bomb test, the theoretical physicist J. Robert Oppenheimer recalled Hindu scripture: “Now I am become Death, the destroyer of worlds.” Although this is often interpreted as admitting moral culpability on the part of the Manhattan Project’s scientific director, Oppenheimer remained a central player in the nuclear-weapons establishment until he lost his security clearance in the mid-1950s.
Harold Urey also worked for the Manhattan Project. But by contrast, the Nobel-prizewinning chemist distanced himself from nuclear weapons development after the war. His search for science beyond defence work prompted a shift into studying the origins of life and lunar geology. Now, the absorbing biography The Life and Science of Harold C. Urey by science historian Matthew Shindell uses the researcher’s life to show how a conscientious chemist navigated the cold war.
Shindell argues that Urey’s pious upbringing underpinned his convictions about the dangers of a nuclear arms race, and his commitment to research integrity. Urey grew up a minister’s son in a poor Indiana farming family belonging to a plain-living Protestant sect, the Church of the Brethren. Progressing through increasingly diverse educational environments, culminating in a PhD at the University of California, Berkeley, Urey became self-conscious about the zealousness of his family’s faith. He also found the path to a cosmopolitan, middle-class life.
In the 1920s, Urey was among a small group of chemists who collaborated closely with physicists. Working at Niels Bohr’s Institute for Theoretical Physics at the University of Copenhagen, he kept abreast of developments in quantum mechanics. There, and on travels in Germany, he met the likes of Werner Heisenberg, Wolfgang Pauli and Albert Einstein. But Urey decided he lacked the mathematical skills to make theoretical advances in quantum chemistry. Moving back to the United States, he started both a family and an academic career.
At Johns Hopkins University in Baltimore, Maryland, and later at Columbia University in New York City, Urey taught quantum mechanics to chemists, while setting out on the trail that led him to deuterium. In 1931, he discovered this isotope of hydrogen. Predicted on the basis of work by Bohr, Frederick Soddy, and J. J. Thomson, its existence had been doubted by many chemists and physicists. Urey’s identification won him the Nobel three years later. By this time, he had also co-authored one of the first texts in English on quantum mechanics as applied to molecular systems, the 1930 Atoms, Quanta and Molecules.
Urey’s continuing work on stable isotopes of other chemical elements, such as nitrogen and oxygen, led to important applications in biochemistry and geochemistry, including the pioneering use of isotopic labels to study metabolic pathways. Living in New York also led Urey to political liberalism. He became aware of the anti-Semitism affecting Jewish scientists, and the lack of opportunities for women scientists. A generous mentor, he shared his Nobel prize money with two collaborators, and split a grant he had been awarded with the young Isidor Rabi (who later discovered nuclear magnetic resonance)...
...The Second World War changed Urey’s life, as it did those of most physical scientists and researchers in many countries. His expertise in isotopes made him valuable to the Manhattan Project. Here, he eventually headed a massive team of scientists and engineers working on the separation of uranium isotopes using gaseous diffusion methods. However, he was ill-suited to the pressure of managing this technologically complex and cumbersome project, and Leslie Groves — the project’s overall director — regarded him with suspicion. Even before the war’s end, Urey became deeply disenchanted with working for the military...
...After the war, Urey used his laureate status to voice alarm about the prospect of nuclear warfare. He backed international control through world government as a way to control the military future of atomic energy. This was not a radical view in 1946...
...Over this harrowing period, Urey lost faith in the ability of modern secular society to manage the new threats of the atomic age. Although he had long abandoned his parents’ religion, he began to argue that Judaeo-Christianity was key to democracy. He attributed the success of science itself, with its commitments to honesty and credit, to religious ethics...
...In the late 1940s, Urey used his expertise in mass spectrometry to begin work in geochemistry, and then in planetary science. It was a way to escape the orbit of the nuclear weapons establishment (although he still advised the US Atomic Energy Commission). With chemistry graduate Stanley Miller, he tested hypotheses on the origins of life by Soviet biochemist Alexander Oparin and biologist J. B. S. Haldane, and successfully produced amino acids by sparking a solution of water, methane, ammonia and hydrogen. In 1952, Urey published The Planets, a chemical treatise on the formation of the Solar System...
...Urey became influential during the early days of NASA, formed after the 1957 launch of the Soviet satellite Sputnik, offering the agency persuasive reasons to prioritize exploration of the Moon over other bodies. In 1969, he analysed lunar rocks collected during the Apollo 11 mission, which supported his theory of the Moon’s common origin with Earth. He wanted the well-funded agency to test theories about the origins of the Solar System — experimentation beyond the reach of individual university scientists. Despite his influence, he was disappointed in this: NASA focused on crewed space exploration over questions of cosmogony.
Sounds like a cool book about a cool life, no?
Have a nice weekend.
The terrible day of the wisecrack.
From the Wikipedia entry on the life of Dorothy Parker:
These were no giants. Think who was writing in those days—Lardner, Fitzgerald, Faulkner and Hemingway. Those were the real giants. The Round Table was just a lot of people telling jokes and telling each other how good they were. Just a bunch of loudmouths showing off, saving their gags for days, waiting for a chance to spring them... There was no truth in anything they said. It was the terrible day of the wisecrack, so there didn't have to be any truth...[61]
Dorothy Parker
Of course, things are much worse in the age of Twitter, the age of anti-thinking.
We are all in the Algonquin Round Table, and that is not a good thing.
Mapping 123 million neonatal, infant and child deaths between 2000 and 2017
The paper I'll discuss in this post is this one: Mapping 123 million neonatal, infant and child deaths between 2000 and 2017.
This paper is open sourced, and anyone who cares can read it in its entirety.
The argument is often made - and it's a very good one - that the carrying capacity of the planet for human beings has been exceeded now for many decades. Thus it might seem that an argument for saving the lives of children under the age of five while consistent with human ethics may conflict with environmental ethics.
I have long argued that this conflict is actually invalid. The countries with the lowest birth rates are precisely those where people are secure in their homes, have sufficient health care, shelter, food, and where the rights of women in particular are most actively supported. The problem of exploding populations is therefore, in my opinion, is actually an issue of poverty and human development.
This is precisely why I personally focus the overwhelming portion of my private scientific interests on clean energy, because without clean energy, we cannot eliminate poverty and advance human development.
From article 25 of the Universal Declaration of Human Rights, approved by the United Nations in 1948, but since honored more in breach than practice:
(1) Everyone has the right to a standard of living adequate for the health and well-being of himself and of his family, including food, clothing, housing and medical care and necessary social services, and the right to security in the event of unemployment, sickness, disability, widowhood, old age or other lack of livelihood in circumstances beyond his control.
Universal Declaration of Human Rights
Note that Article 25 is not about electric cars and McMansions with solar cells on the roofs. Modern liberalism differs from 1948 liberalism; I personally prefer the latter.
From the abstract:
From the introduction:
Progress in child survival also diverges across age groups4. Global reductions in mortality rates of children under 5—that is, the under-5 mortality rate (U5MR)—among post-neonatal age groups are greater than those for mortality of neonates (0–28 days)4,8. It is relatively unclear how these age patterns are shifting at a more local scale, posing challenges to ensuring child survival. To pursue the ambitious Sustainable Development Goal (SDG) of the United Nations9 to “end preventable deaths of newborns and children under 5” by 2030, it is vital for decision-makers at all levels to better understand where, and at what ages, child survival remains most tenuous.
A map:
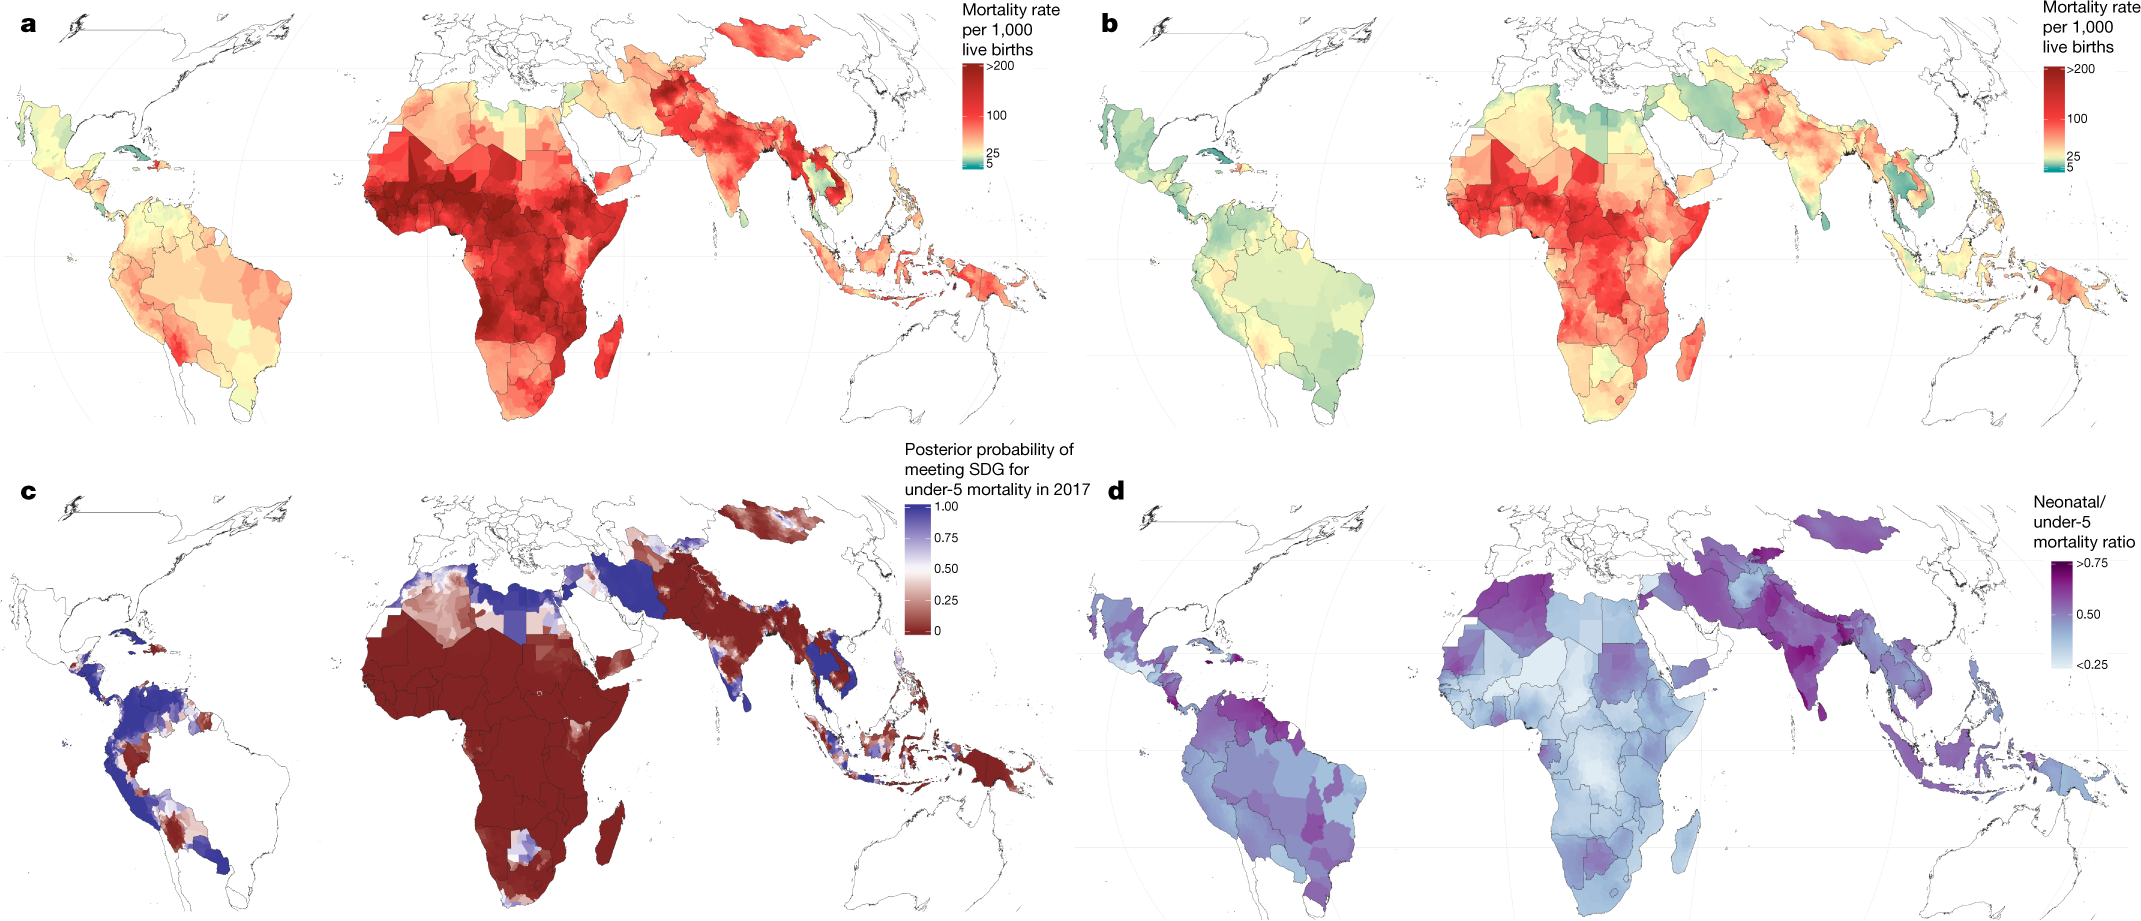
The caption:
We live in a country where children are kept in cages for no "crime" other than their race. We are beneath contempt.
This is probably one of the most important scientific papers in terms of ethical import I've read in a long time, and I read a lot of papers.
Have a nice weekend.
Crosslinking ionic oligomers as conformable precursors to calcium carbonate
The paper I'll discuss in this post is this one: Crosslinking ionic oligomers as conformable precursors to calcium carbonate (Tang et al, Nature 574, 394–398 (2019))
The fastest growing contributor on this planet in the 21st century has been dangerous coal, followed by petroleum, which is likely to be exceeded in the next decade by dangerous natural gas. The next largest contributor, also accelerating, is land use changes. Following these, closely is concrete. (Much of the climate change cost of concrete is connected to heat, almost always generated by the use of dangerous fossil fuels. In theory, if not in wide practice it is possible for the use of concrete to by carbon negative, and some major advances along this line have been made, for instance Riman Concrete, but even Riman concrete requires heat to make. Nuclear heat is actually the only practical way to make concrete without dangerous fossil fuels, despite whatever cartoons you've read or even written about solar thermal plants. Solar thermal plants didn't work, they aren't working and they won't work to address climate change and they will never work to make concrete.
In the past several years, my vicarious interest in my son's education has led me to consider a concept called "polymer derived ceramics" in which is just what it sounds like, a polymer is, via process engineering (and generally heat) converted into a highly structured ceramic. This paper touches on that concept, at least in a loose way. Beautiful things, these, with all sorts of fabulous potential applications.
The abstract, which is open sourced:
An excerpt from the introduction:
Published: 16 October 2019
Crosslinking ionic oligomers as conformable precursors to calcium carbonate
Zhaoming Liu, Changyu Shao, Biao Jin, Zhisen Zhang, Yueqi Zhao, Xurong Xu & Ruikang Tang
Nature volume 574, pages394–398 (2019) | Download Citation
Article metrics
556 Accesses
13 Altmetric
Metricsdetails
Abstract
Inorganic materials have essential roles in society, including in building construction, optical devices, mechanical engineering and as biomaterials1,2,3,4. However, the manufacture of inorganic materials is limited by classical crystallization5, which often produces powders rather than monoliths with continuous structures. Several precursors that enable non-classical crystallization—such as pre-nucleation clusters6,7,8, dense liquid droplets9,10, polymer-induced liquid precursor phases11,12,13 and nanoparticles14—have been proposed to improve the construction of inorganic materials, but the large-scale application of these precursors in monolith preparations is limited by availability and by practical considerations. Inspired by the processability of polymeric materials that can be manufactured by crosslinking monomers or oligomers15, here we demonstrate the construction of continuously structured inorganic materials by crosslinking ionic oligomers. Using calcium carbonate as a model, we obtain a large quantity of its oligomers (CaCO3)n with controllable molecular weights, in which triethylamine acts as a capping agent to stabilize the oligomers. The removal of triethylamine initiates crosslinking of the (CaCO3)n oligomers, and thus the rapid construction of pure monolithic calcium carbonate and even single crystals with a continuous internal structure. The fluid-like behaviour of the oligomer precursor enables it to be readily processed or moulded into shapes, even for materials with structural complexity and variable morphologies. The material construction strategy that we introduce here arises from a fusion of classic inorganic and polymer chemistry, and uses the same cross-linking process for the manufacture the materials.
Main
Many materials are consolidated from their crystallized powders16, but their resulting discontinuous internal structures render them brittle with a poor ability to resist fracture17,18. By contrast, polymeric materials are ubiquitous in modern society, due not only to their varied properties but also to their ease of fabrication15,19. The polymerization strategy is superior to crystallization because of its efficiency and controllability. In polymer chemistry, covalent bonds have an important role in ensuring the linkage of small units. Although a few covalent-bond-based inorganic materials (for example silicone and silica)20,21 can be obtained as polymers, there is no general method for the preparation of such materials by crosslinking owing to the lack of investigation into ionic monomers or oligomers for this purpose. In the control of polymerization reactions, a capping agent is key22: capping can stabilize precursors, whereas de-capping can initiate polymerization. Analogously, we proposed that ionic oligomers could be stabilized by an appropriate capping agent. Capping based on hydrogen bonding was thought to be suitable, because most inorganic complexes contain oxygen. For example, triethylamine (TEA) can form a hydrogen bond with a protonated carbonate through its tertiary amine group. More importantly, TEA is a small molecule that can be volatilized at room temperature, and it was expected that this could initiate an expected crosslinking reaction.
The authors use triethylamine in a solvent, the solvent in this case being ethanol (which of course, unless the ethanol is recovered, makes industrialization questionable. The calcium carbonate is made by bubbling carbon dioxide through an ethanolic solution of calcium chloride. Mass spectrometry demonstrated the existence of calcium carbonate polymers from trimers to undecamers, with, for some reason, nonamers excluded. The structures were also studied by 13C NMR.
A figure from the paper:
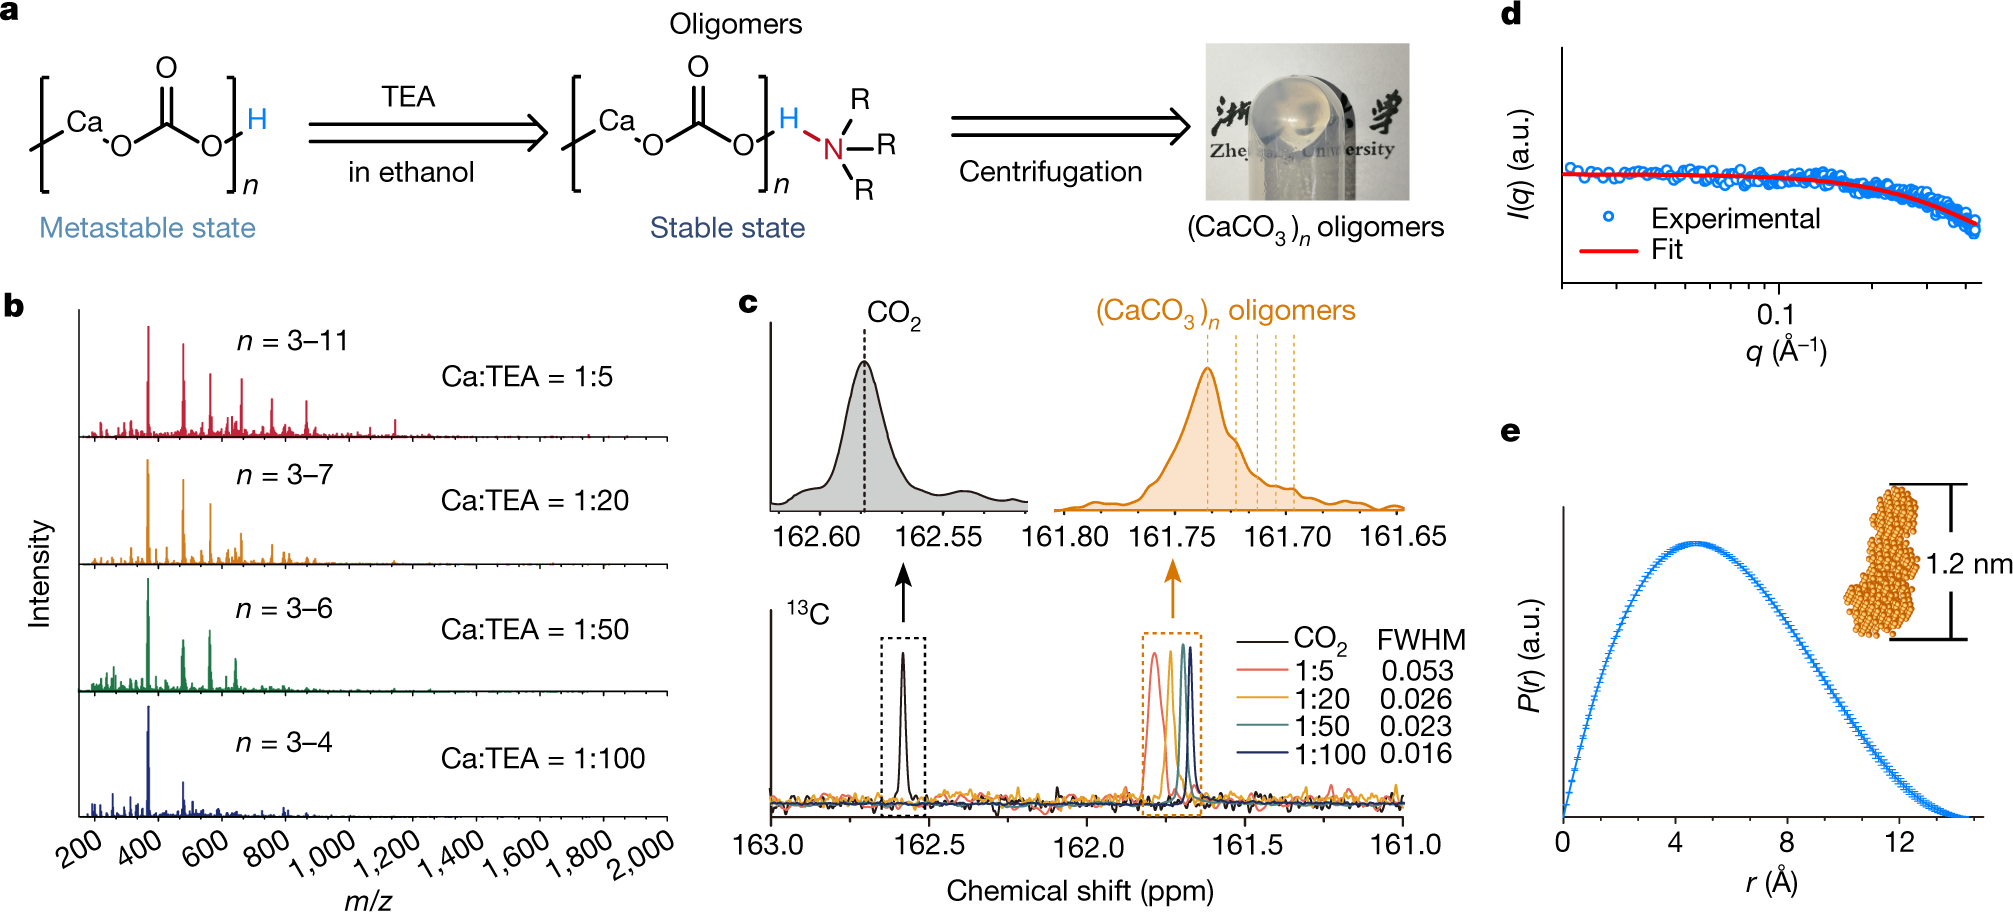
The caption:
The fate of the chloride ions is not reported. This seems to me to be an important consideration, nevertheless this is an interesting paper.
Cross linking of the polymers is achieved by evaporating the ethanol and the triethylamine.
Another graphic:
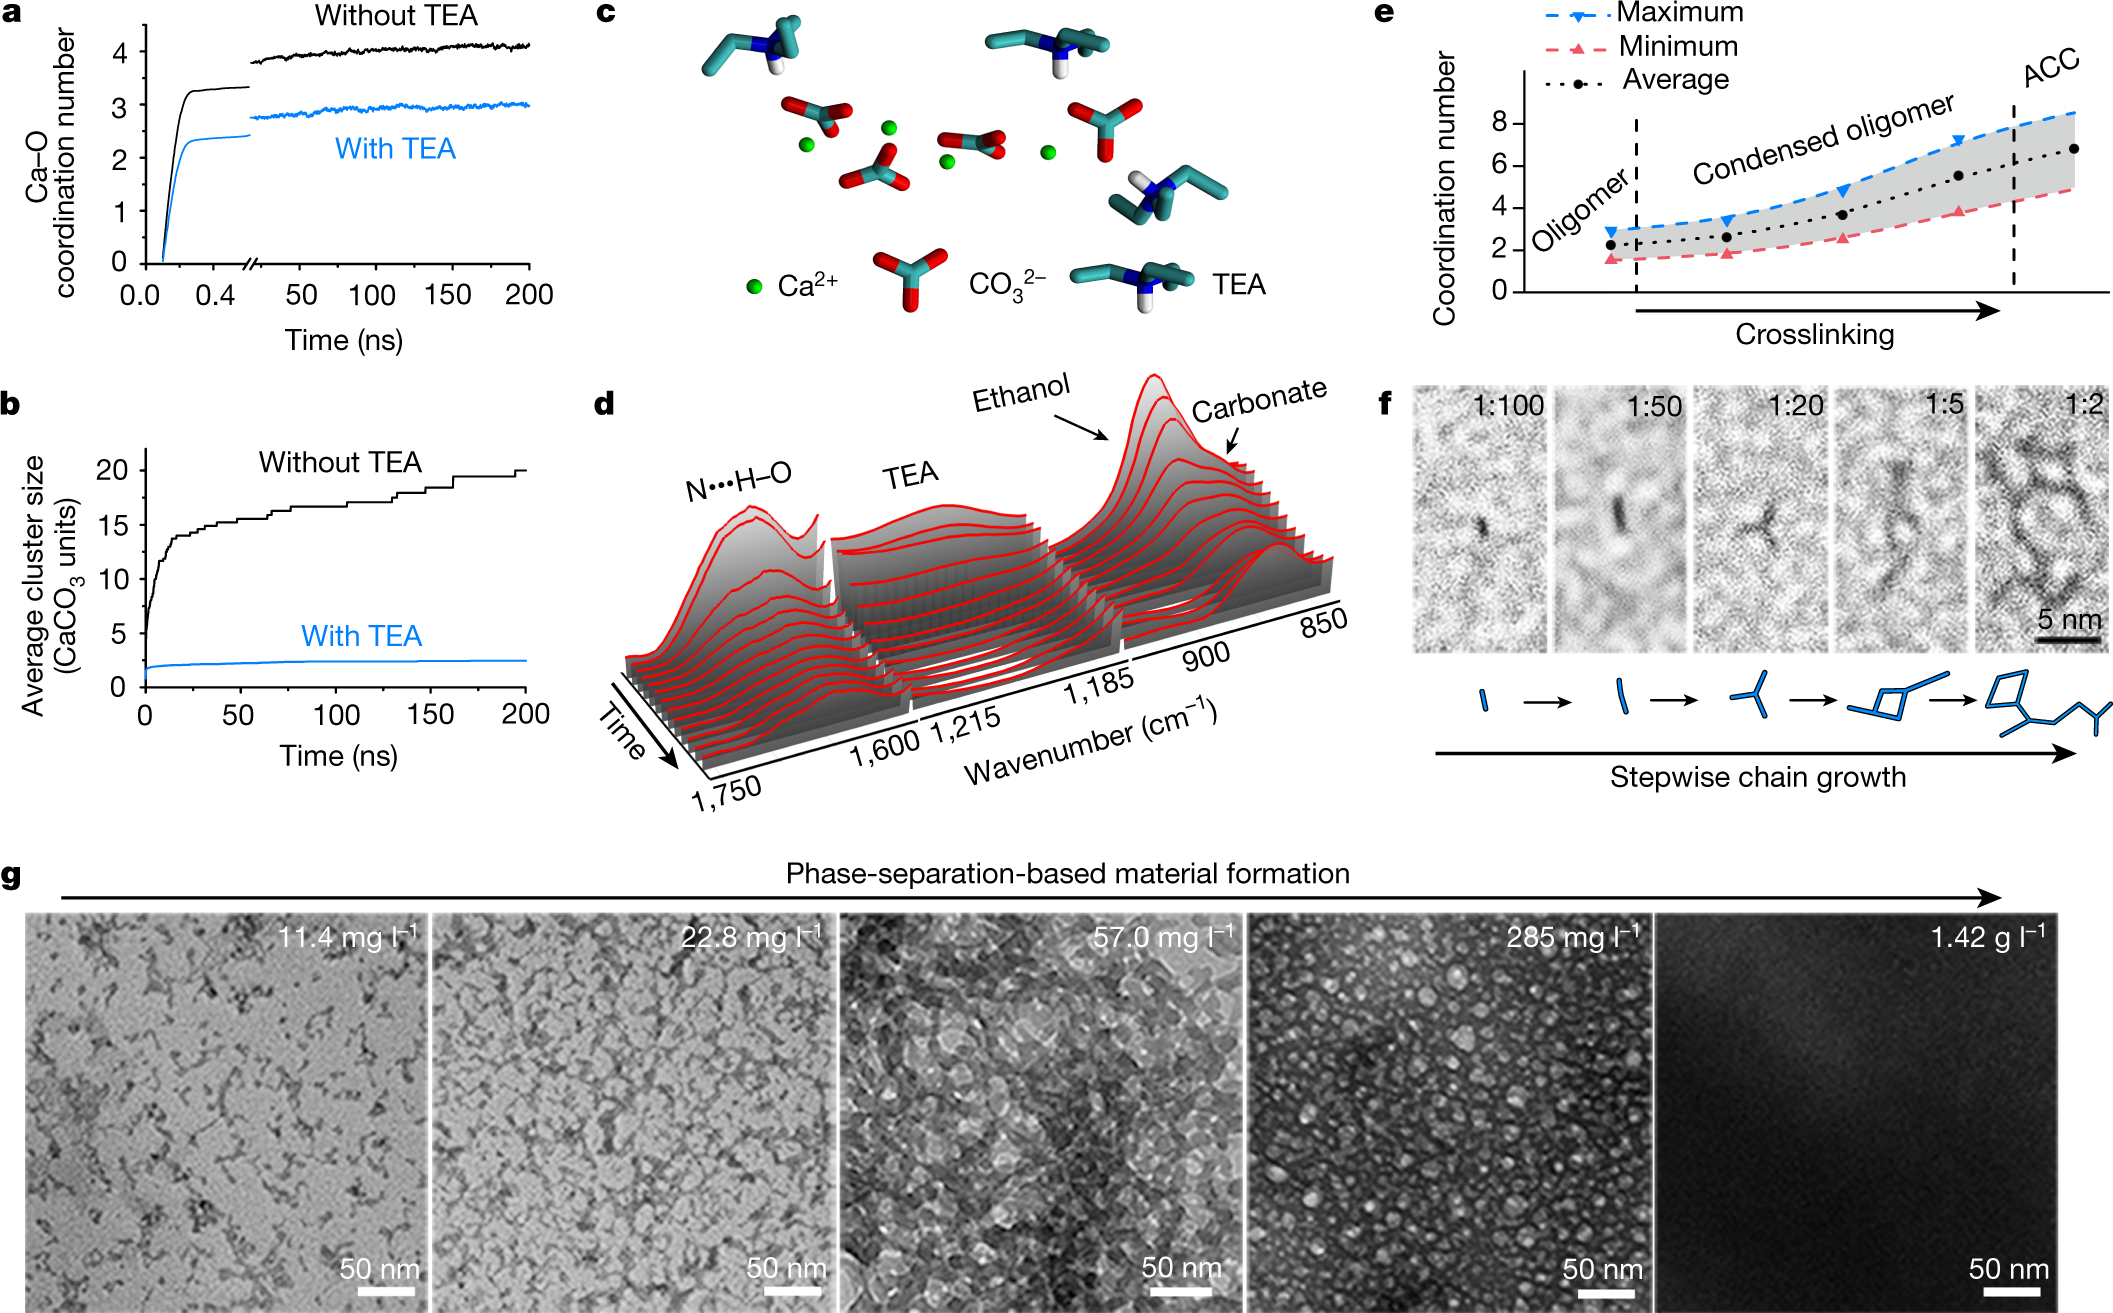
The caption:
 in the absence (black) or presence (blue) of TEA. c, A typical simulated CaCO3 cluster capped with TEA (an oligomer). d, In situ FTIR spectra during the drying of (CaCO3)n oligomers. e, The change in the coordination number of Ca–O during crosslinking. Owing to the uncertainty in the exact density during measurements, the blue and red lines are shown to represent the maximum and minimum coordination number of Ca–O, respectively. The black line shows the average coordination number. f, High-resolution TEM images of (CaCO3)n oligomers grown at different Ca:TEA ratios from 1:100 to 1:2. g, TEM images depicting the transformation of (CaCO3)n oligomers to larger structures during condensation.
Some text about the results:
Another picture:
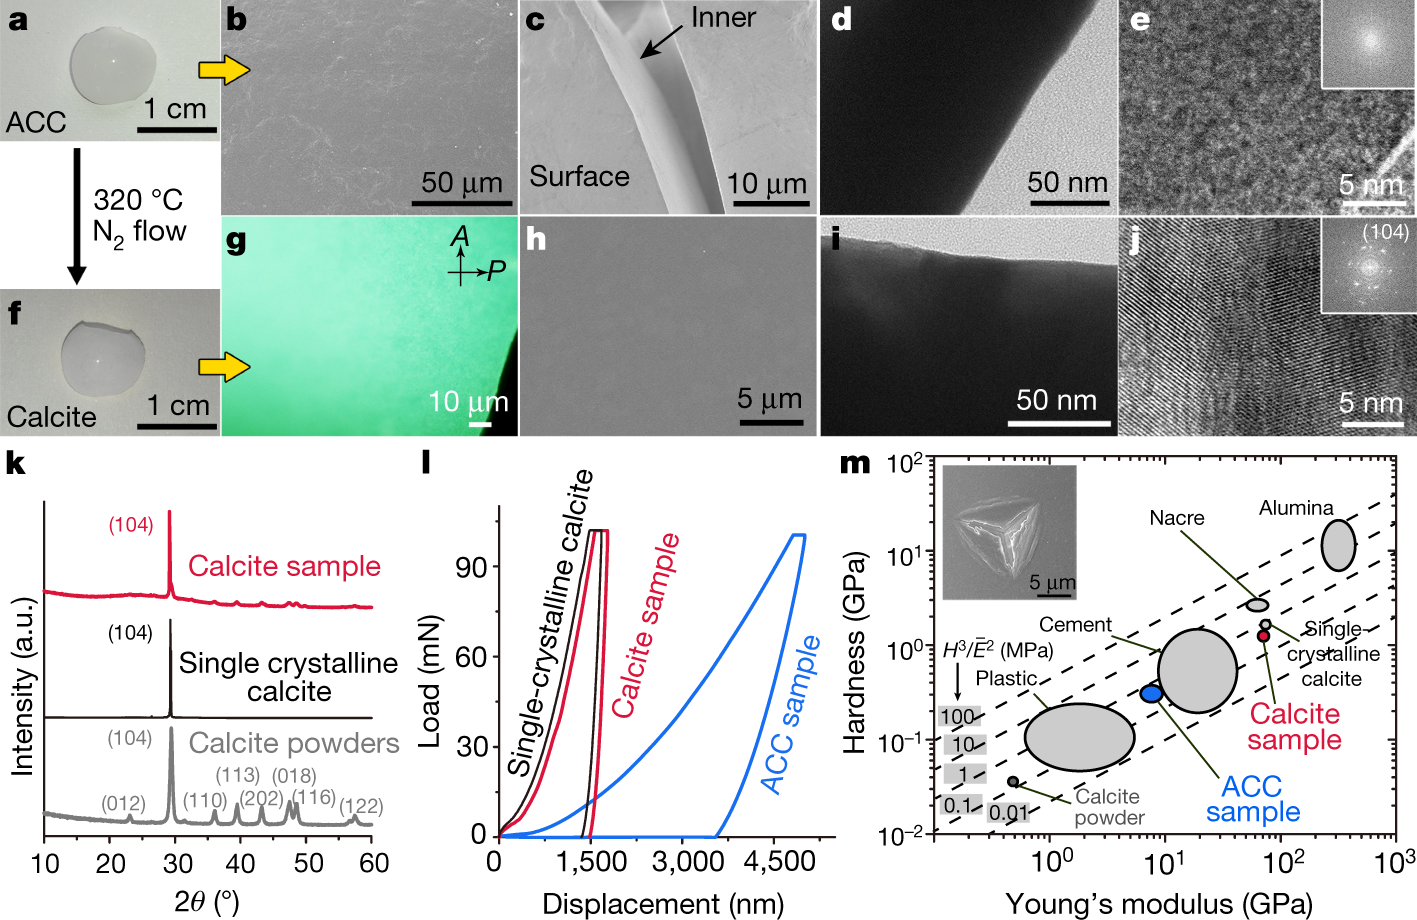
The caption:
ACC, is amorphous calcium carbonate.
Some discussion of possible applications:
A graphic on engineering utilizing this technique:
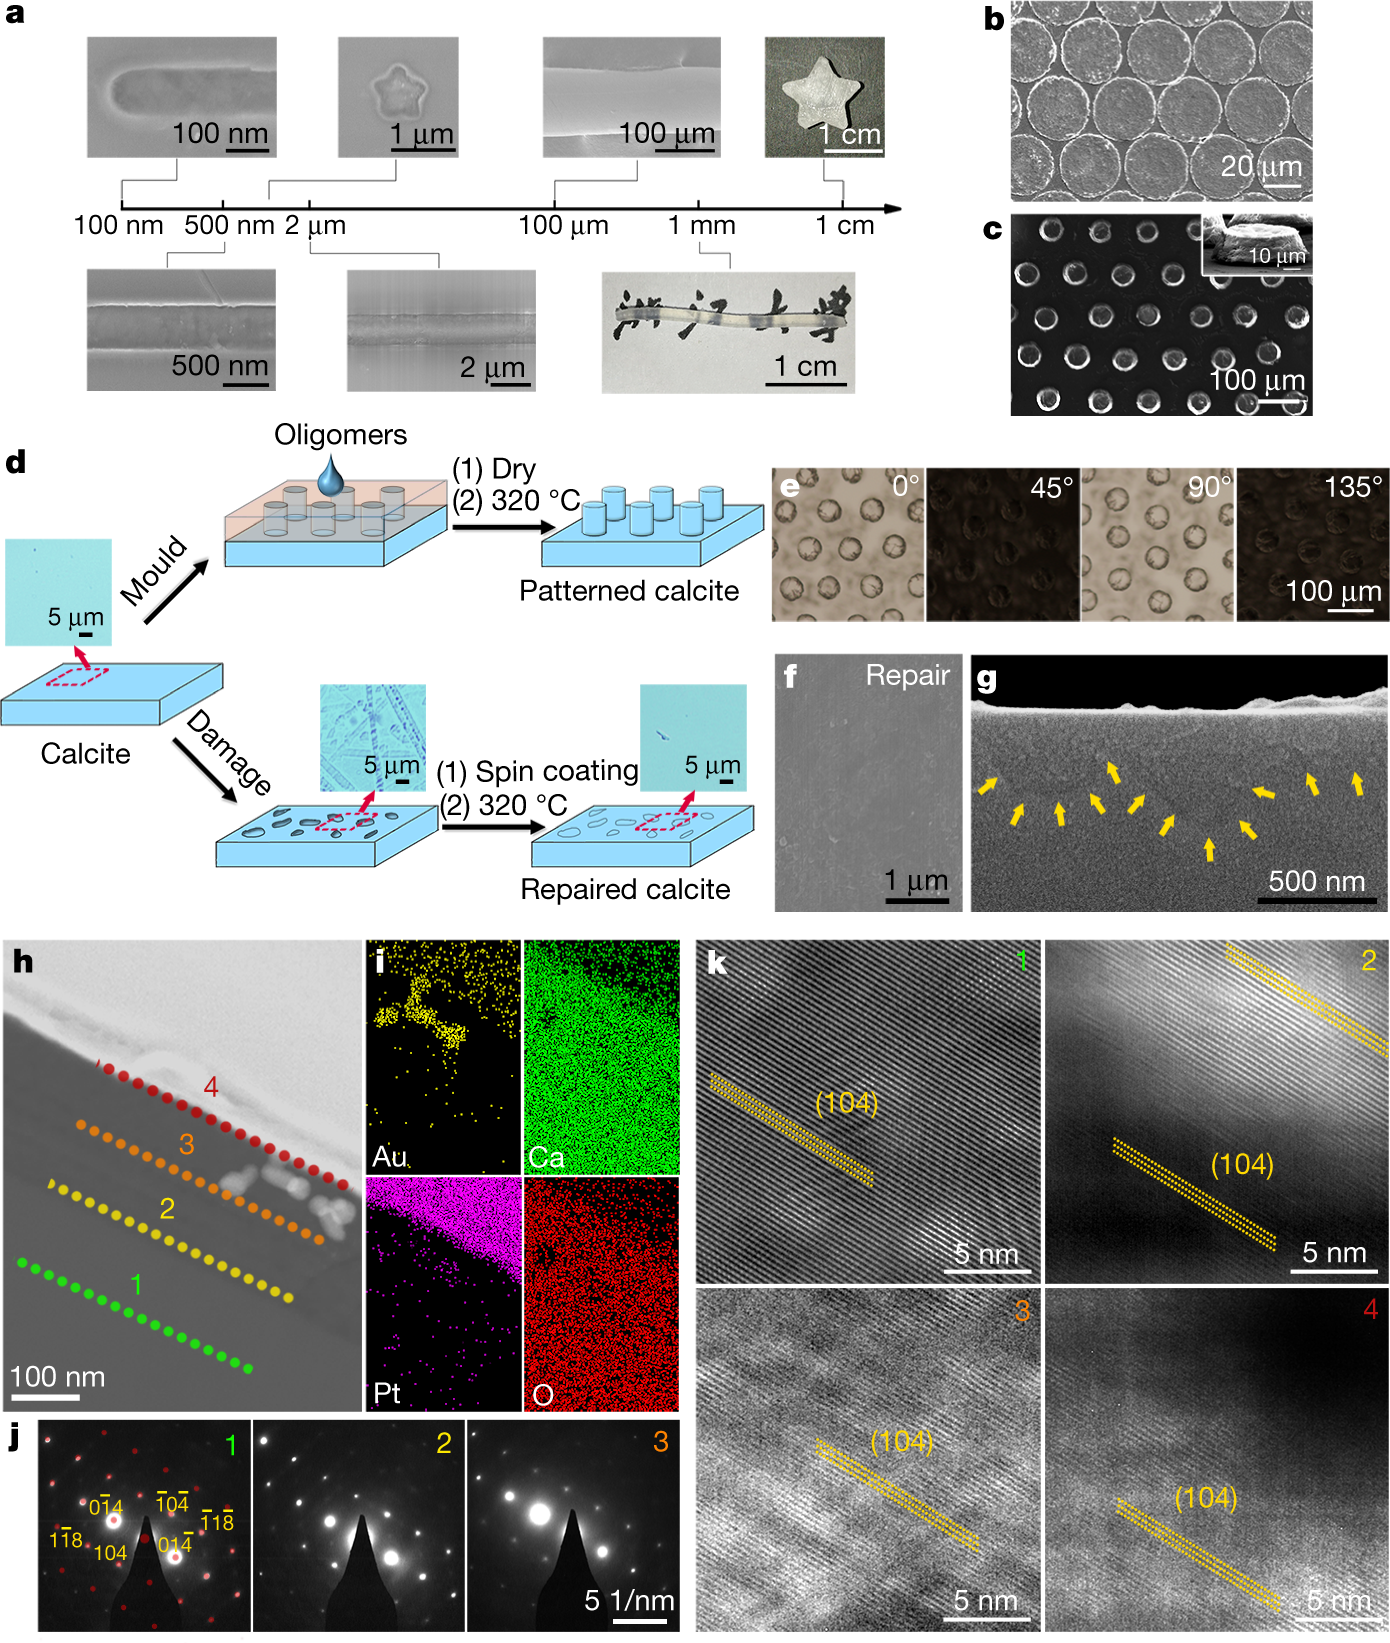
Interesting paper, I think, I thought I'd share it.
Have a great Friday.
Milk of ruminants in ceramic baby bottles from prehistoric child graves
The paper I'll discuss in this post is this one: Milk of ruminants in ceramic baby bottles from prehistoric child graves (J Dunne et al Nature 574, 246–248 (2019)).
It is, I think, a good thing that we found out that the most modern approach to infant nutrition is breast feeding. Chemical analysis of human breast milk has shown - aside from chemical toxins associated with our modern life style, for example the common presence of brominated diphenylether flame retardants in the women who recycle our electronic stuff in China - that it is unique among all animal species. One of the major differences concerns lipids; human breast milk contains for example certain polyunsaturated lipids such as EPA, eicosapentenoic acid, and the related DHA and aracadonic acid which is thought to offer certain developmental neurological advantages owing to their propensity to undergo cycloadditions to make important molecules such as prostaglandins and certain hydroxylated species. I'm not sure that I know the precise mechanisms of the neurological effects, but I do know they are real.
I used to joke with my wife that I hoped that my sons would wean before they went to college; I'm sure both of them breast fed at least past their third birthday, although they ate other foods before their first birthday. They're men now, and it's possible, I think, it all worked out for the better. They're pretty smart guys.
Anyway, it appears that the problem of feeding children nonhuman animal milk has a very long history according to this paper. From the abstract which is open sourced:
From the introduction to the paper, which is probably not open sourced:
Breastfeeding is integral to infant care in all human groups and fundamental to the mother–infant relationship4. Breast milk provides an infant with all of the macro- and micronutrients that are required to sustain growth for the first six months of life9, together with bioactive components, which protect the infant from pathogenic organisms and facilitate the development and maturation of the immune system10. The introduction of energy and nutrient-rich, easily digestible, supplementary foods in infant feeding (that is, during weaning) is unique to humans11,12. Supplementary foods are generally introduced at around six months of age, when the metabolic requirements of an infant exceed the energy yield that the mother can provide through milk, contributing to the infant diet as chewing, tasting and digestive competencies develop1,12,13.
Apparently vessels that are believed to have been ceramic "baby bottles" were placed in the graves of children buried in prehistoric Germany:
Possible infant-feeding vessels that are made from clay first appear in Neolithic Europe. One of the earliest of such finds is a Linear Pottery Culture feeding vessel from Steigra, Germany, that has been dated16 to around 5500–4800 BC. These unique vessels, which have a small spout through which liquid could be poured or suckled, come in many forms and sizes and occasionally have a zoomorphic design (Extended Data Fig. 1). They become more common in Central Europe during the late Bronze and early Iron Age4 and are found in settlements, as stray finds, and in graves (particularly those of children), which strongly suggests that they were feeding or weaning vessels for infants.
The precious nature and often small openings of these vessels makes their sampling for organic residue analysis extremely challenging. However, infant-feeding vessels that have an open, bowl form, found in graves from cemeteries of Dietfurt-Tankstelle and Dietfurt-Tennisplatz in Germany, have recently become available for chemical analysis. The graves are part of a large early Iron Age cemetery complex (dating to approximately 800–450 BC) found in the lower Altmühl valley in Bavaria, Germany, with Dietfurt-Tankstelle encompassing 99 burials in 72 graves17 and Dietfurt-Tennisplatz containing 126 burials18. Child grave 80 at Dietfurt-Tennisplatz contained an east–west-oriented inhumation of a young child (0–6 years old), who had a bronze bracelet on the left arm, and in which feeding vessel 1 (Fig. 1a) was placed at the child’s feet18.
A graphic:
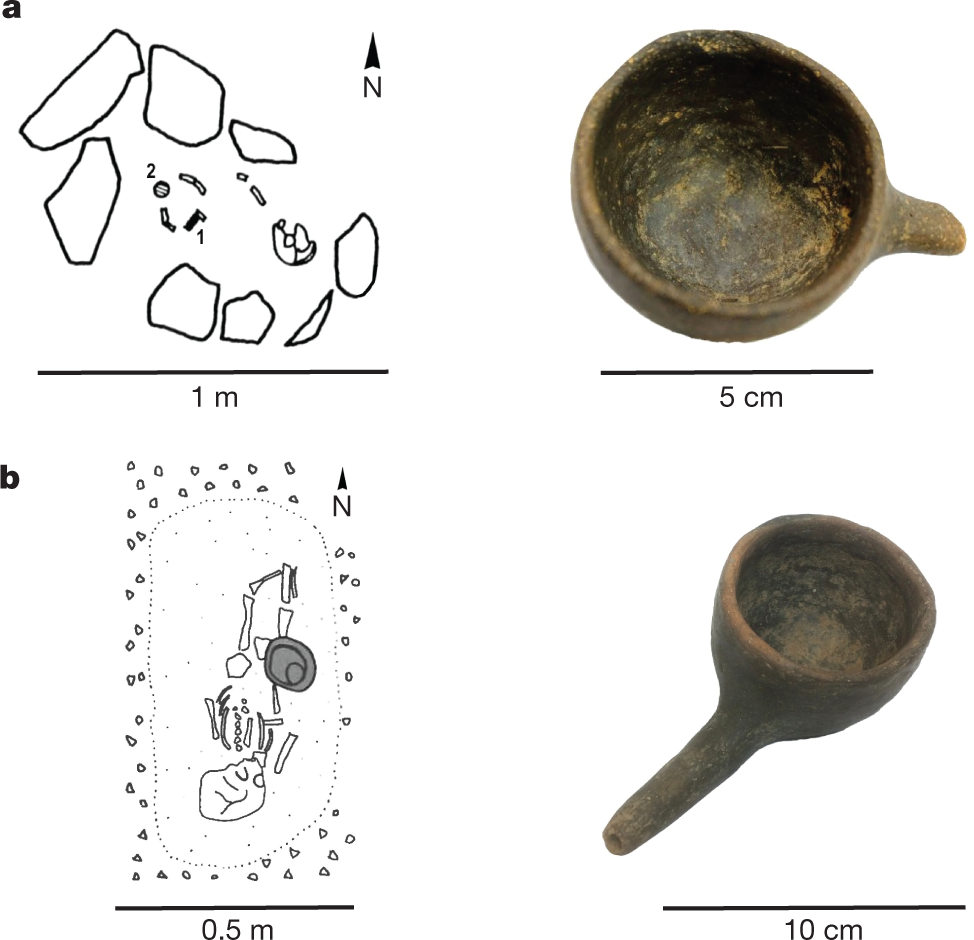
The caption:
In the labs where I work, we analyze fatty acids by LC/MS/MS which is generally more sensitive than GC-MS single quads with derivatization to FAMES (fatty acid methyl esters), but the authors here have used the latter, and apparently it got the job done, utilizing the NIST databases. (I'd personally be reluctant to do this with samples this precious, but it worked out apparently; the paper is published in Nature.)
Their results:
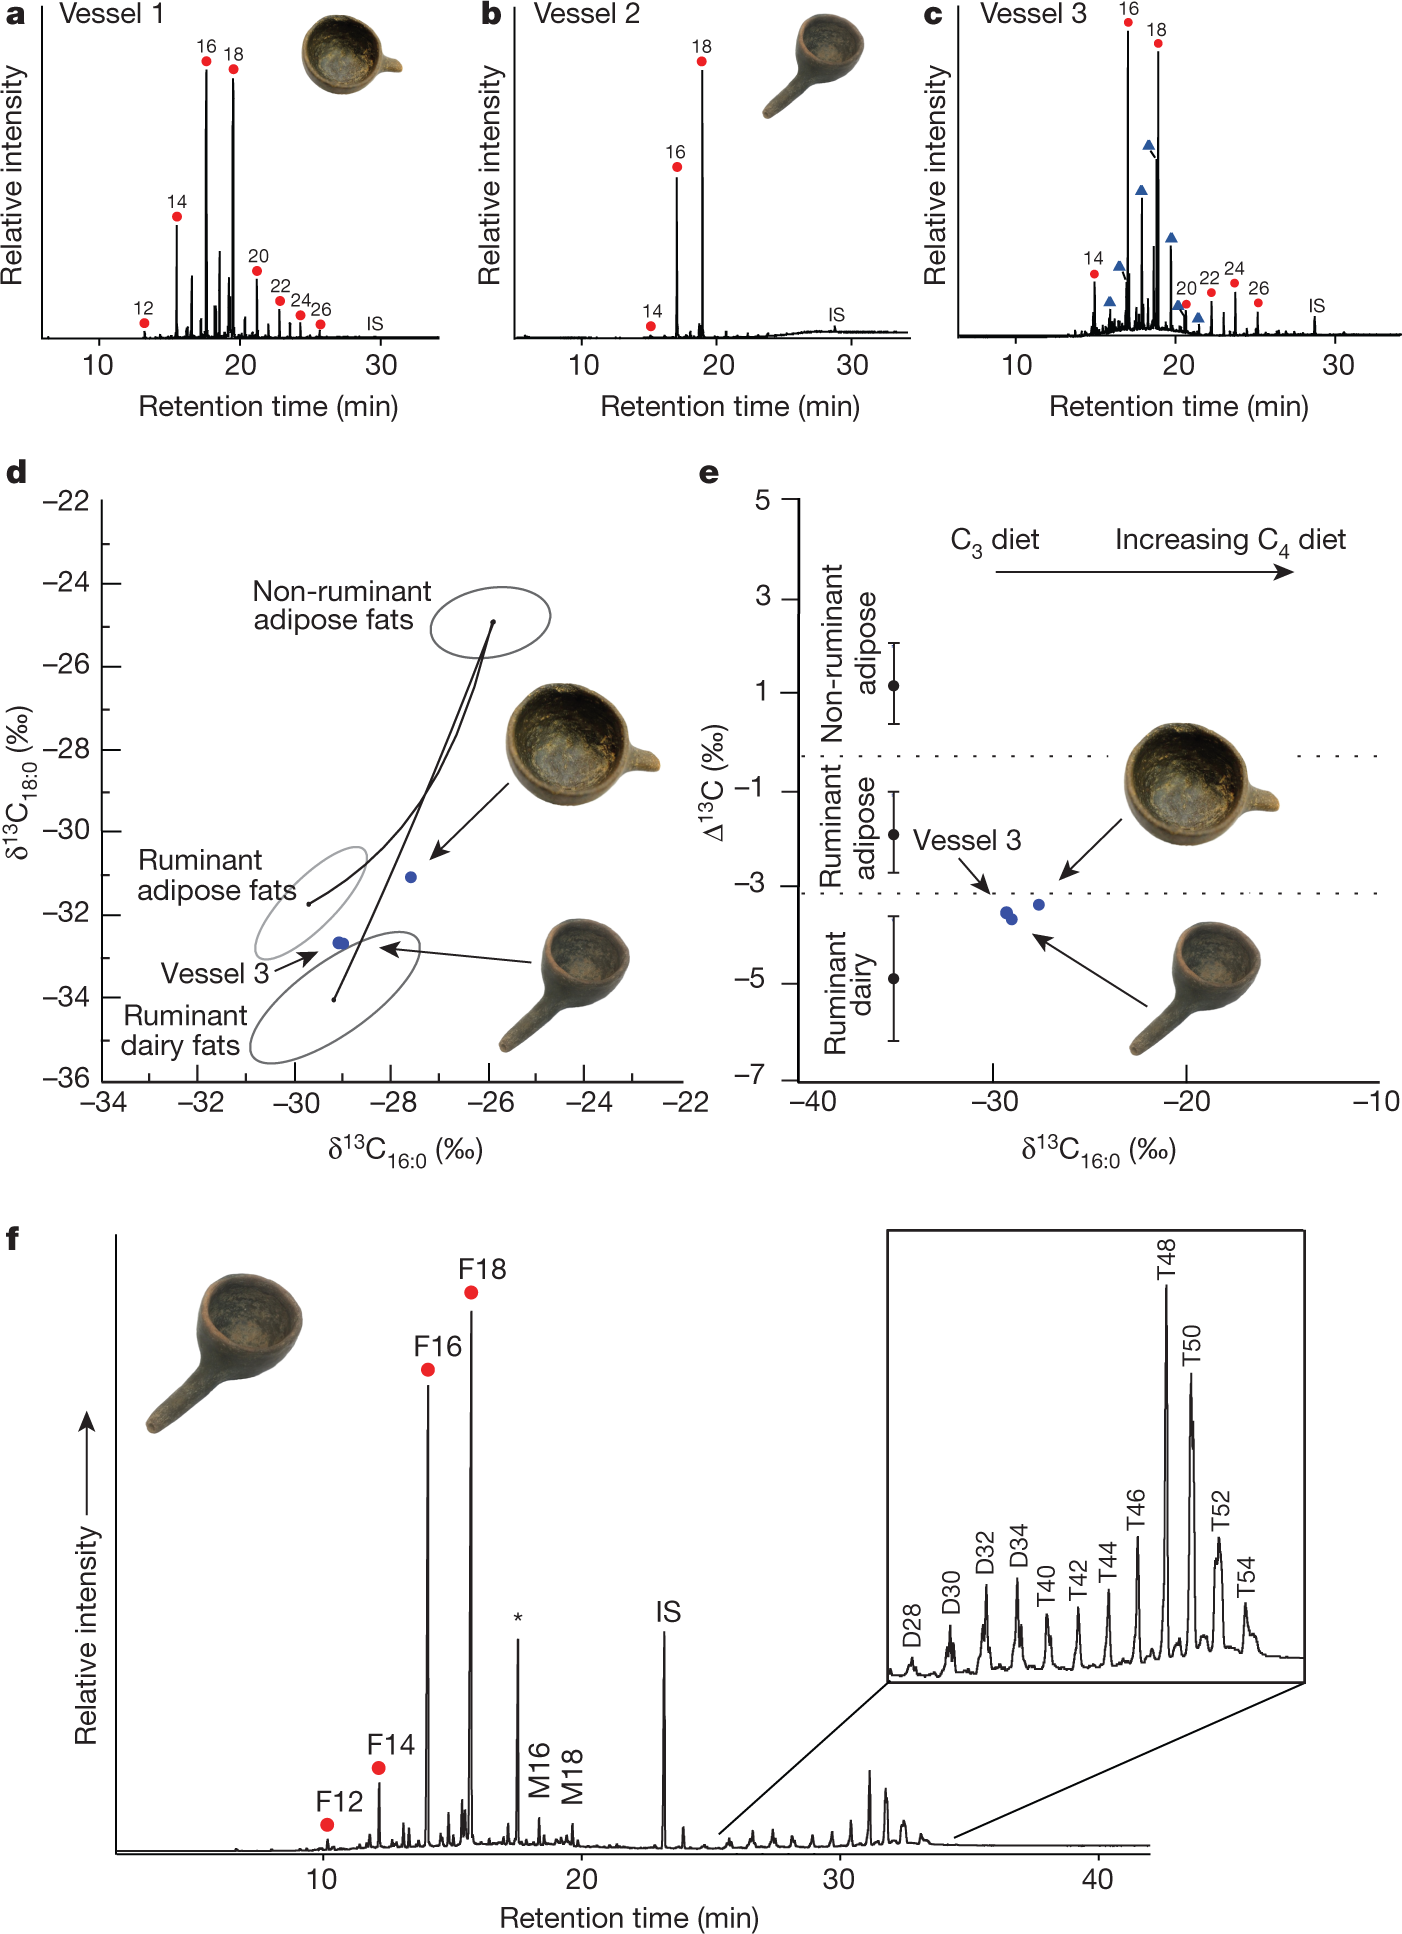
The caption:
Here's some explanation of the different lipid profiles of cow's milk and human milk:
Nutritional differences:
My sons were both with me this weekend, and we had this fascinating conversation on why European culture came to be so widely adopted across the world, which of course, is tied to imperialism, the latter being tied to a cultural propensity for violence that was not absent in other cultures, but seems to have been less intense, the Mongols, perhaps excepted. I mentioned Kurt Vonnegut's description of Europeans as "sea pirates" which other cultures refused to believe could possibly be as greedy and violent as they turned out to be. My younger son had an interesting theory related to geography to explain the warlike practices of Europeans. We were just kicking stuff around. I don't know that we were being cartoonish; I'm sure we were.
This may only be loosely tied to nutritional differences, but these nutritional differences have had an effect on culture.
It is well known for example, from genetic data, that Europeans as distinct from other ethic groups exhibit more tolerance for lactose than other ethic regions, which is why one never sees cheese sauce for example, in Chinese or Japanese food. It is also well known that, albeit, with many exceptions, that certain cancers are less prevalent in Asia, notably breast cancer.
Seemingly small things matter.
In any case, I found this interesting chemoarcheology to be very interesting, and I thought I'd share it.
Have a nice day tomorrow.
Joan Brennecke Returns in Triumph to her Alma Mater with a 2.5M Grant.
Whenever I see a paper from Joan Brennecke while growing through titles in a journal I just have to read it. (Confession: The Journal she edits, Journal of Chemical Engineering Data, is not on my regular reading list; I wish I had more time.)
Most recently I came across this paper of hers: Effect of Water on CO2 Capture by Aprotic Heterocyclic Anion (AHA) Ionic Liquids (Gabriela M. Avelar Bonilla, Oscar Morales-Collazo, and Joan F. Brennecke, ACS Sustainable Chem. Eng. 2019, 7, 16858?16869)
I usually don't notice institutions, but it caught my eye, that after a long career at Notre Dame, she is now at the University of Texas at Austin. So I googled to find out what happened and came across this article: Engineering a New Era
Joan Brennecke, the first female professor of chemical engineering at the University of Texas, has charted her own career course.
As a chemical-engineering student at the University of Texas in the 1980s, Joan Brennecke learned more than formulas and chemical processes; she learned how to stick up for herself. Some professors supported Brennecke in her engineering ambitions, helping her become more assertive and self-assured. Meanwhile, others represented the challenges she would face throughout her career in a male-dominated field.
Brennecke remembers casually chatting with a UT chemical-engineering professor about her career ambitions at a party in 1984, when he surprised her with a mocking laugh.
“A female faculty member in chemical engineering at the University of Texas? Over my dead body!” he declared.
After a $2.5 million governor’s grant returned the world-class researcher to her alma mater three decades later, Brennecke can’t help but laugh at the story’s irony.
“I try never to whine about others’ behavior,” says Brennecke, now UT’s first female full professor in chemical engineering. “I tend to ignore it and do my thing.”
Engineered to Succeed
Brennecke knew chemical engineering was her thing since early high school. She recalls hours spent in the garage with her father, a chemical engineer with a Ph.D., taking apart anything the two could find. When she was 12, they disassembled a massive mechanical calculator he brought home from his job at Alcoa.
Engineering runs in the family: Brennecke’s uncle works as a mechanical engineer, her mother is a secretary for an engineering company and three cousins ended up in engineering-related positions. Brennecke entered the family hall of fame as its first female engineer.
Today, women earn about 20 percent of all engineering degrees. When Brennecke hit high school in the mid-1970s, women earned just 3.4 percent of those degrees...
...Gabriela Avelar Bonilla, one of Brennecke’s Ph.D. students at Notre Dame, says Brennecke serves as a valuable resource for women in engineering.
“In a field that [is]usually dominated by men, it’s important to have role models that you can relate to,” Avelar Bonilla says, “[especially]someone like her because her career is very impressive and she is a good mentor.”
When paired with a female mentor, female engineering undergrads feel more confident, motivated and less anxiety, according to a study published earlier this year.
The first piece of advice Brennecke offers female engineering students is to focus on doing their best.
“There’s no substitute for competence,” she says.
“And for goodness’ sakes, don’t ever be dissuaded or even irritated by somebody’s stupid comments or what somebody does. Don’t waste your brain cells on them. Spend your brain cells on doing what you’re doing well.”
Dr. Brennecke gave a wonderful lecture at Princeton University which I attended a few years back. I have posted the video in this space here:
On the Solubility of Carbon Dioxide in Ionic Liquids.
I was, at the time, a little depressed about the remarks on SO2, but the world has gone beyond that.
In any case, it's great to see powerful women in Chemical Engineering. Dr. Brennecke is a national asset.
Diagramming making bad coffee.
I was reading a paper today, this one, Development and Optimization of Liquid Chromatography Analytical Methods by Using AQbD Principles: Overview and Recent Advances and I came across a reference to a "Ishikawa Fishbone Diagram."
We are fortunate in these times that when we don't know what something is, we can google it, and often end up at Wikipedia, which is what happened to me, where I learned how to make a diagram of how I might make bad coffee:
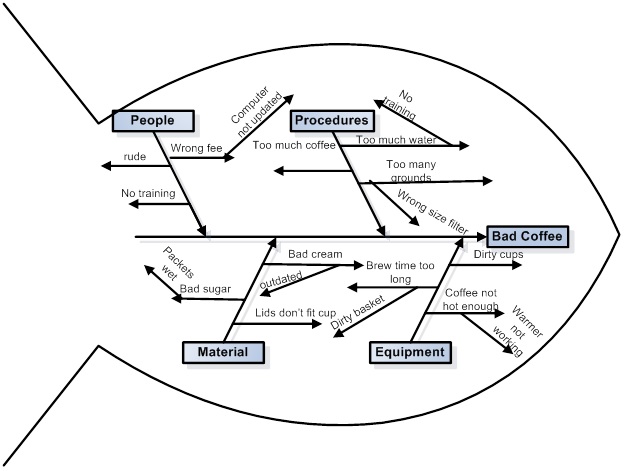
Feel free to follow these steps to making bad coffee.
It turns out that I've seen these types of diagrams before, but never knew what they were called. Now when I'm in a meeting, I can say "Ishikawa Fishbone Diagram" and sound like I know something, even if I don't know shit from shinola.
I was mistaken about the timing and magnitude of the 2019 Mauna Loa CO2 minimum.
On September 22 I wrote the following in a post in this section:
This year, in 2019, as is pretty much the case for the entire 21st century, these minima are uniformly higher than the carbon dioxide minima going back to 1958, when the Mauna Loa carbon dioxide observatory first went into operation. Weekly data is available on line, however, only going back to the week of May 25, 1975, when the reading was 332.98 ppm.
For many years now, I have kept spreadsheets of the data for annual, monthly, and weekly Mauna Loa observatory data with which I can do calculations.
In the weekly case, the week ending May 12, 2019 set the all time record for such readings: 415.39 ppm.
These readings, as I often remark vary in a sinusoidal fashion, where the sine wave is imposed on a monotonically increasing more or less linear axis, not exactly linear in the sense that the slope of the line is actually rising slowly while we all wait with unwarranted patience for the bourgeois wind/solar/electric car nirvana that has not come, is not here and will not come.
This graphic from the Mauna Loa website shows this behavior:

Here is the data for the week beginning on September 15, 2019
Up-to-date weekly average CO2 at Mauna Loa
Week beginning on September 15, 2019: 408.50 ppm
Weekly value from 1 year ago: 405.67 ppm
Weekly value from 10 years ago: 384.59 ppm...
...The operative point is that this reading is only 0.09 ppm lower than last week's reading, which was, 408.59 ppm. This suggests, if one is experienced with working with such data, that this is most likely the annual September minimum reading. For the rest of this year, and through May of 2020 the readings will be rising. We will surely see next May readings around 418 ppm, if not higher.
However, I was wrong, because the next two weeks at Mauna Loa showed values lower than 408.50 ppm. It actually took place this year during the week ending 09/29/19, when the reading was: 407.97
The most recent data point is the week ending October 6, 2019 is a follows:
Up-to-date weekly average CO2 at Mauna Loa
Week beginning on October 6, 2019: 408.39 ppm
Weekly value from 1 year ago: 405.50 ppm
Weekly value from 10 years ago: 384.06 ppm
Last updated: October 13, 2019
From here on out, until May, 2020, the values for each week will exceed the number reported on September 29 of this year.
Previous weekly data annual lows took place as follows over the last 5 years:
9/9/18: 405.39 ppm
9/24/17: 402.77ppm
9/25/16: 400.72ppm
9/27/2015: 397.2 ppm
9/14/2014: 394.79 ppm
No one alive today will ever see a measurement at Mauna Loa lower than 400 ppm again.
In 2000, the weekly data annual low took place on September 10, 2000: 367.08 ppm.
In 1980, the weekly data annual low took place on September 4, 1980, 339.87 ppm.
In 1975, the first year the weekly data was reported, the weekly data annual low took place on August 31, 1975 when it was 329.24 ppm.
The movement to late September is most probably a function of a warmer and longer summer in the Northern Hemisphere, during which the annual minimums take place.
The annual maxima show up in early May. We may expect that the 2020 maximum should approach or exceed 418 ppm.
I apologize for jumping the gun. It's possible that next year we'll see, for the first time ever, the minimum appearing in October.
Have a nice afternoon.
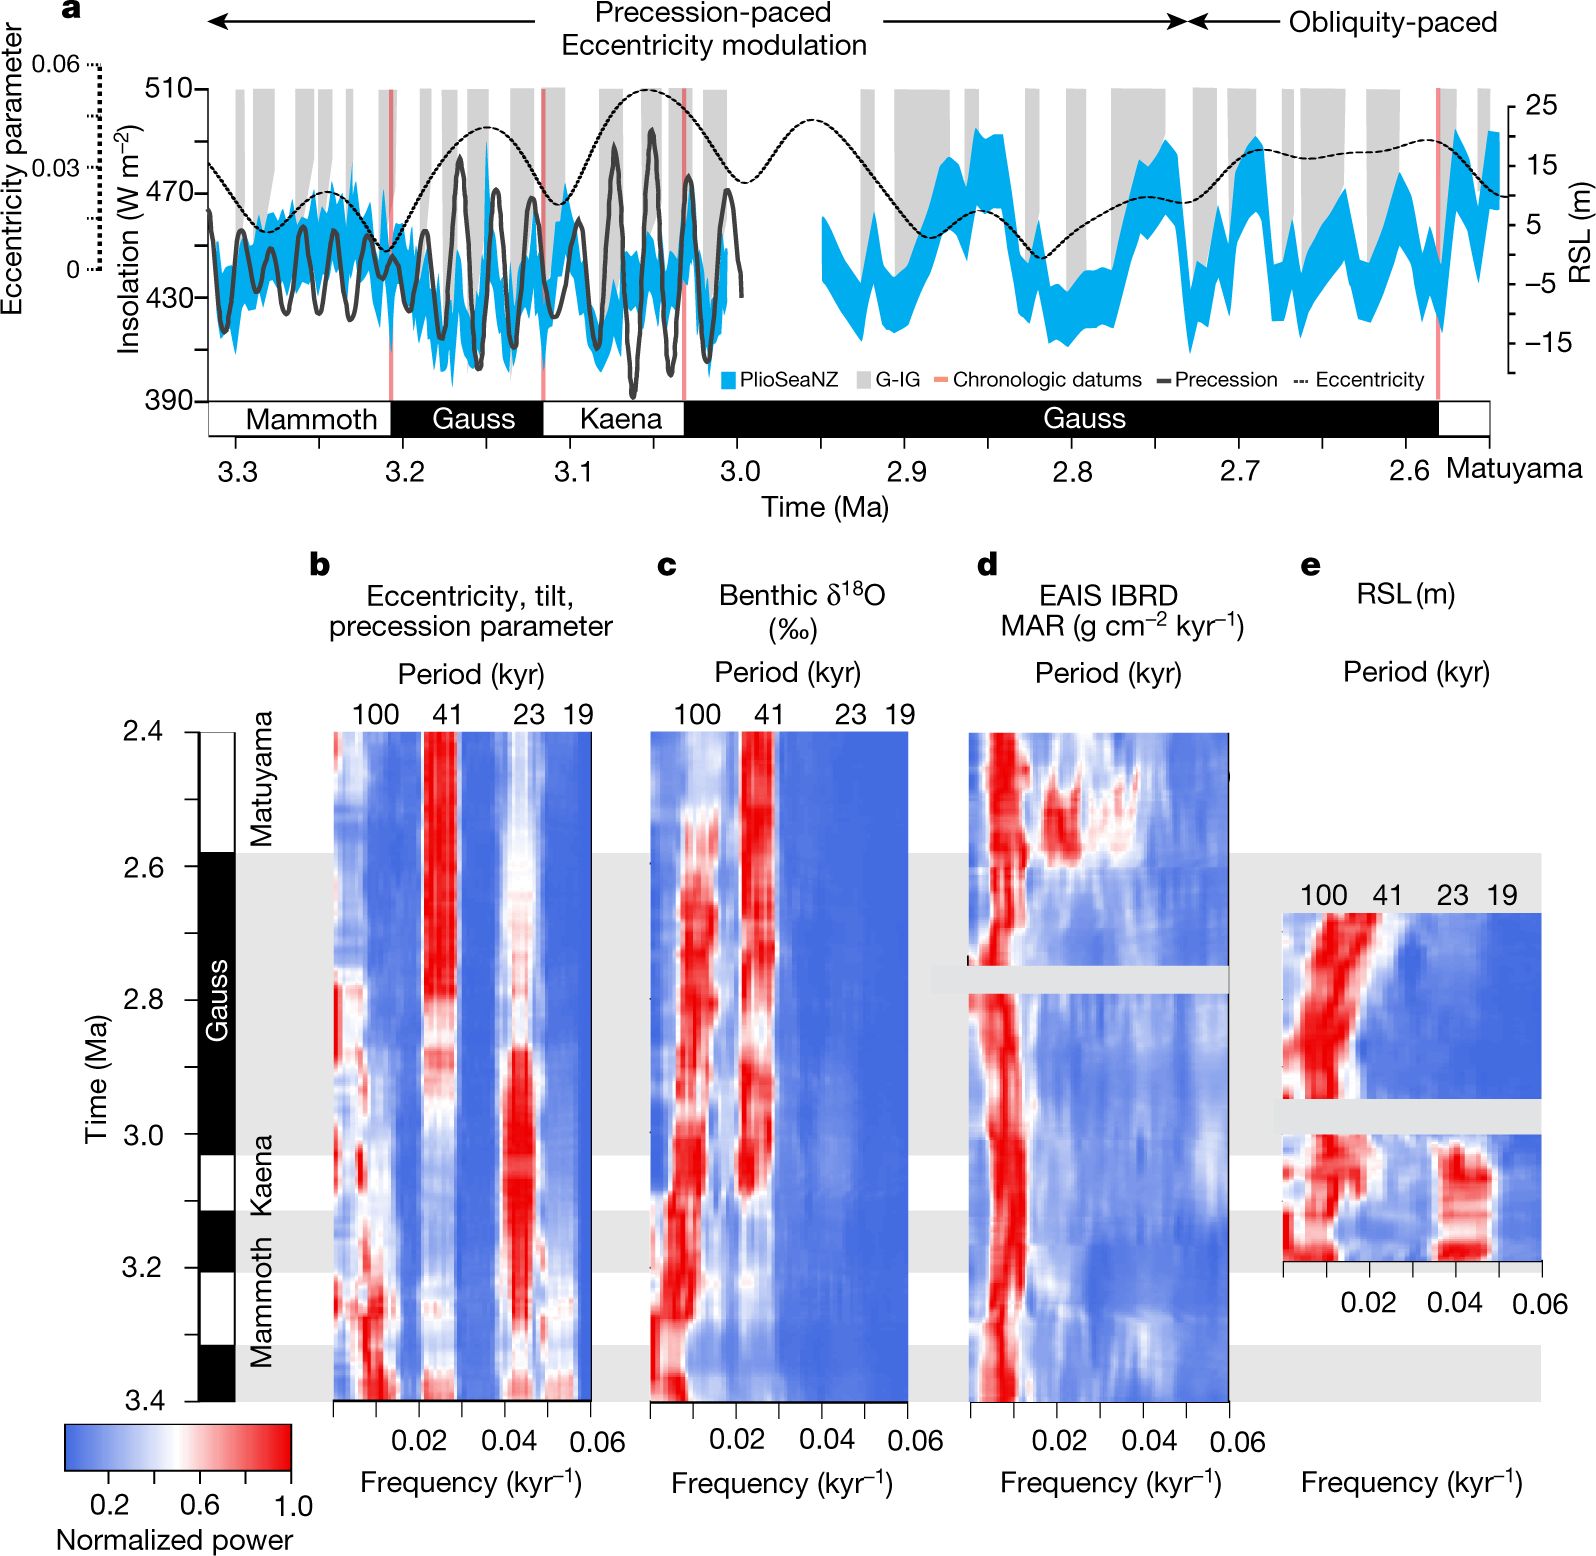
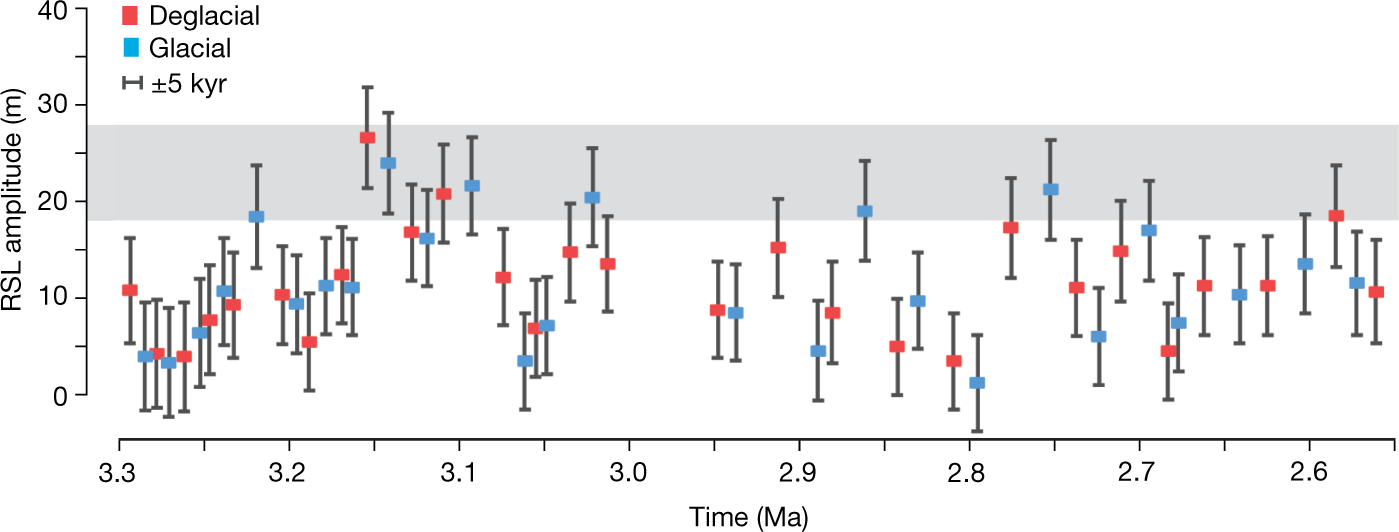
The amplitude and origin of sea-level variability during the Pliocene epoch
The paper I'll discuss in this post is this one: The amplitude and origin of sea-level variability during the Pliocene epoch (Grant et al, Nature volume 574, page s237–241 (2019).
This past Thursday I posted a similar paper about this epoch, which was also published in Nature, in the same issue, just above this one.
During the Pliocene Epoch, which was from 3 to 5 million years ago, the concentration of carbon dioxide in the atmosphere apparently surged (for a few hundred thousand years) to around 450 ppm, which, since we are doing nothing meaningful about climate change, we will hit in about 15 to 20 years.
The authors here use a different approach than the approach I discussed on Thursday.
From the abstract:
The authors review, as the authors described in my previous post, the techniques for evaluating the sea level in the geological past:
...and describe some significant limitations, for example with the ?18O method...
They then describe their approach:
Reference 6 is this one, from the same group:
Mid- to late Pliocene (3.3–2.6 Ma) global sea-level fluctuations recorded on a continental shelf transect, Whanganui Basin, New Zealand (Grant et al Quaternary Science Reviews Volume 201, 1 December 2018, Pages 241-260) I have not personally accessed this paper.
A few more details on their approach:
Some pictures from the text:
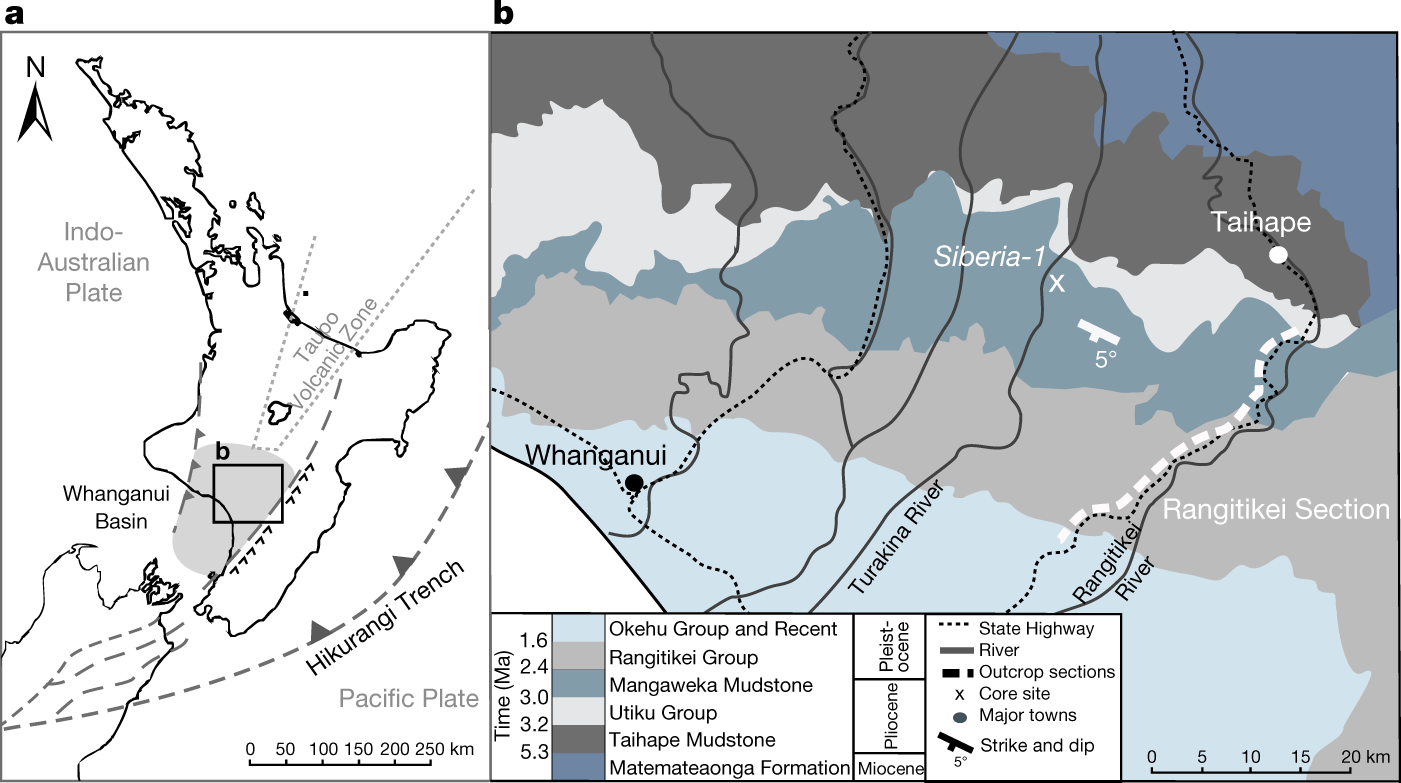
The caption:
 ?as=webp
The caption:
The caption:
https://www.nature.com/articles/s41586-019-1619-z/figures/4
The caption:
AIS is the antarctic ice sheet, GIS, greenland ice sheet.
They speak on the effect of rotational precession changes the insolation patterns drive this historical warming, and that this in turn, they argue, means that the Antarctic Ice Sheet is more prominent in driving sea level rises.
This does not mean that they exclude carbon dioxide, far from it.
From their conclusion:
Have a pleasant Sunday afternoon.
Profile Information
Gender: MaleCurrent location: New Jersey
Member since: 2002
Number of posts: 33,515