NNadir
NNadir's JournalBare Metal Critical Masses of Commonly Available Plutonium Isotopes.
The paper I'll discuss in this post is this one: Denaturing of Plutonium by Transmutation of Minor-Actinides for Enhancement of Proliferation Resistance (Saito et al, Journal of Nuclear Science and Technology, Vol 42, Issue 2, 161-168 (2005)).
The ultimate cause of our complete and technical failure to address climate change is selective attention.
And let's be clear, we are failing, we are doing nothing effective to address climate change. Here are the figures immediately available at the website of the Mauna Loa Carbon Dioxide Observatory's website:
Up-to-date weekly average CO2 at Mauna Loa
Week beginning on November 10, 2019: 410.25 ppm
Weekly value from 1 year ago: 408.91 ppm
Weekly value from 10 years ago: 385.76 ppm
Last updated: November 23, 2019
While the figure in comparison to the same week of 2018 seems low, "only" 1.34 ppm over last year, this is only the third such reading in 2019 to below 2.00. The average of such readings for 2019 as compared to 2018 is 2.98 ppm as of this writing, and in the week ending April 8 of this year, the same reading was 4.48 ppm over the same week in 2018. Of the 19 such readings over 4.00 pm, 12 have occurred in the last 5 years, 16 in the last 10 years.
We are failing. Big time.
I blame selective attention for this inasmuch as climate change is a result of our energy production practices and the criteria by which we engage in the comparative analysis is for lack of a better set of terms, completely and totally puerile, silly, and absurd.
As I frequently point out, citing the irrefutable data in this open sourced paper, Prevented Mortality and Greenhouse Gas Emissions from Historical and Projected Nuclear Power (Pushker A. Kharecha* and James E. Hansen Environ. Sci. Technol., 2013, 47 (9), pp 4889–4895), nuclear energy saves lives.
This, of course, does not imply that nuclear energy is without risk, that no one has ever been harmed by nuclear energy. This is obviously not true and never will be true. It is, I think, in the presence of a responsible cost analysis that values lost lives from any technology equally, absolutely no feasible way to make nuclear energy safer than it already is, and no rational reason for doing so, since any improvement would be minor and raise costs.
It is not, at least to sane people in my opinion, justifiable to spend tens of billions of dollars to prevent 5 future deaths or 500 future deaths from radiation leaks while we are unwilling to spend the same amount of money to provide improved sanitation to the 2 billion people who lack it, thus allowing 827,000 deaths (the WHO figure) each year from lack of clean water and fecal born diseases, 432,000 of which involve diarrhea, mostly among small children.
I a member of a generation, the so called "Baby Boomers," who proved to be, at the end of their reign, mostly concerned about money and consumption, and little else, except for some tiresome and weak gesturing, half-assed perfunctory sloganeering and cursory lip service.
It is common among members of this generation to declare, without a shred of critical thinking, that "nuclear power is dangerous" because of so called "nuclear waste," about which these same people claim, without having ever opened a science book or a scientific paper in their generally useless lives, that "nobody knows what to do with it."
The reality though is that air pollution, which again, I often point out, kills seven million people per year, and climate change to the extent it is driven by carbon dioxide are both waste problems, fossil fuel and biomass combustion waste.
The difference between so called "nuclear waste," and dangerous fossil fuel waste is essentially this: There is no record of commercial so called "nuclear waste" actually killing people beyond the fantasies of moral morons, and there is an extensive record of dangerous fossil fuel waste killing people. About 800 people will die in the next hour from fossil fuel and biomass combustion waste.
On some level, there is some excuse for Baby Boomers to have focused their fear on radiation, since many of us can remember, albeit when we were children, the Cuban Missile Crisis, when we went to school some mornings in October of 1963 expecting to be vaporized at some point in the day. Nevertheless, our focus on our childhood fears are not really excuses for having lost our ability to think critically.
There are now people who have elevated this childish fear of radiation- every human being is mildly radioactive because every human being would die without the element potassium which does not occur (except in special laboratories) in a non-radioactive form - to engage in hysterical and extremely stupid evocations of say, some crap about the Hanford weapons facility, as a justification for letting seven million people die each year from dangerous fossil fuel and biomass combustion waste. It is not worth even speaking to such moral Lilliputians.
By the way, it is not sane to spend hundreds of billions of dollars to "clean up" Hanford to a standard that no one is ever, for all time, injured by its contents, at the same time that we are unwilling to spend hundreds of billions of dollars to clean up the planetary atmosphere, which is killing people continuously.
This brings me to the issue the authors of the paper cited at the outset of this post, the subject of putative nuclear war. It is a fact that for almost 3/4 of a century, 73 years to be exact, the number of people killed in nuclear wars has been zero. (This is not true of nuclear tests, but it is true of nuclear wars.) It is also a fact that millions of people have died in the last 73 years from petroleum based wars, using petroleum based weapons of mass destruction (and some dangerous natural gas based weapons of mass destruction, since nitrates are synthesized using natural gas). Yet the petroleum industry and the gas industry are not required to prove that their products and materials cannot be diverted to use in weapons of mass destruction, a task which would be futile, since they are continuously observed to do so, but the nuclear industry is so required.
The paper is written about the "Kessler proposal" (and similar proposals) to which I have paid considerable attention since it was published in 2004, which is to limit world plutonium supplies to those containing significant quantities of the 238Pu isotope, a heat generating isotope that has mostly been utilized to power deep space robots investigating the outer (and a few inner) planets in our solar system.
I am a proponent of the uranium/plutonium nuclear fuel cycle to save humanity from itself, but it largely not this cycle discussed in this paper: I propose the fast neutron (breeder) cycle, whereas this paper focuses on the thermal cycle. Inasmuch as the bare sphere metal critical mass of actinide isotopes is very much involved in my thinking, the paper nonetheless caught my eye. This is because I changed my mind a few years ago about whether large nuclear reactors were to be preferred to smaller, easily manufactured reactors: I now think small is better.
The introduction begins with a statement about the reality that selective attention exists:
Later the introduction gets to the Kessler proposal and outlines it:
The authors, citing a previous paper by the lead author, advance this argument further:
Most of the previous researches have been devoted to the effort of increasing 238Pu as way of protection. However, exclusive and separate investigation on the effect of 238Pu on denaturing plutonium would fairly underestimate the combined effect of other even-plutonium isotopes, 240Pu and 242Pu, which have relatively large bare critical mass (BCM) and remarkably large SFNs, since fuel irradiation in LWRs inevitably produces these isotopes.
The present paper therefore focuses on the intrinsic feature of proliferation resistance of plutonium with consideration of the dilution of fissile-plutonium isotope with evenmass- number-plutonium-isotopes. Increasing the fraction of even-mass-number-plutonium-isotopes by plutonium irradiation and MA transmutation in LWRs, the denaturing of reactor- grade-plutonium to unattractive material for fission explosives by utilizing MA transmutation in LWRs is also studied in the present paper...
"SFN" refers to "spontaneous fission neutrons" which are the neutrons released in a subcritical state by the inherent property of both naturally occurring actinides (except thorium) and synthetic actinides to fission spontaneously, without being hit by an external neutron. The presence of to many such neutrons makes nuclear weapon manufacture problematic, and limits their lifetime considerably.
Again, this paper focuses on the thermal cycle, which is not my primary interest, but the tables supporting the discussion are of interest, so I won't discuss much more of the text.
The first table does what the title of this post promises, and gives the bare metal critical masses of plutonium isotopes (presumably spherical geometry, since this is what nuclear weapons utilize).
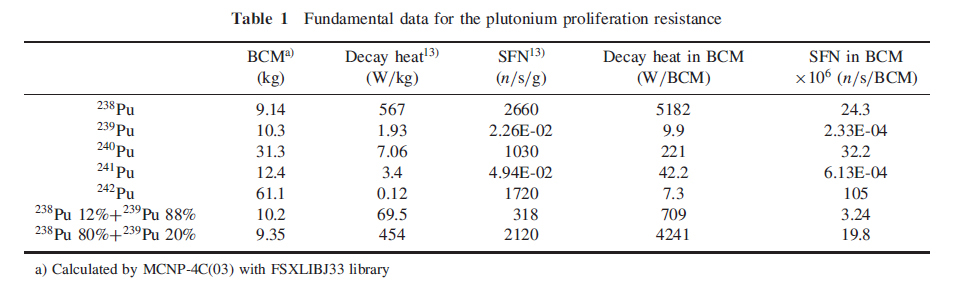
The column BCM stands for "Bare Critical Mass."
The high figure for the decay heat associated with 238Pu, 567 watts per kg, shows why it is useful on space vehicles.
A second table is also of interest since it shows the composition vectors of the main actinide constituents of used nuclear fuel.
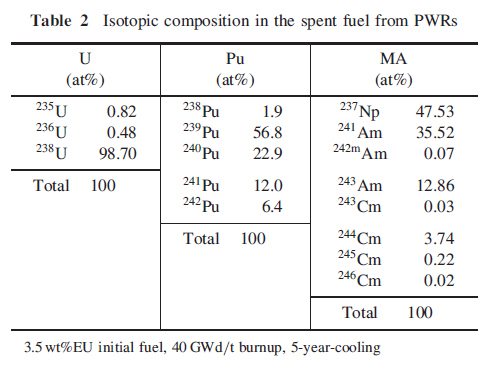
These figures are for "once through" plutonium, that generated utilizing enriched uranium at start up. Of note to me is the relatively low concentration of Pu-242, which is a wonderful isotope since it is fairly but not completely (as it has a critical mass) inert nuclide. Its presence has the effect of increasing the critical mass of any plutonium sample containing it.
In the area of nuclear engineering in which I focus most of my attention, specifically liquid metal fuels, this has an important consequence in terms of a difficult issue, which is heat transfer.
Plutonium is one of three metals exhibiting a very long thermal liquid phase temperature range; the other two are neptunium and gallium. This means it is not easy to get plutonium to boil (although it does so in nuclear weapons explosions). I have in my library a report dating from 1966, when a generation less stupid than mine was working on breeder reactor concepts - indicating that the specific power of a liquid plutonium fueled reactor (the LAMPRE reactor) was 1MW/kg. (cf. Whitman, "Fast Breeder Reactor Development in the United States" in Fast Breeder Reactors, Proceedings of the London Conference on Fast Breeder Reactors, 17-19 May, 1966, P.V. Evans, Ed. page 286.)
Presumably the plutonium utilized in this reactor was or almost was weapons grade plutonium, nearly pure 239Pu. It was, however in the form of an iron plutonium eutectic. The density of this fuel at 760°C, the temperature at which the reactor was said to have operated is approximately 15.53 g/ml. (cf Wittenberg and Ofte, Fluid Flow of Liquid Plutonium Alloys in an Oscillating‐Cup Viscosimeter J. Chem. Phys. 48, 3253 (1968)) The eutectic point in the iron plutonium system exists at about 10% iron, suggesting that at this power density, if we assume that the 1MW/kg figure refers only to the plutonium content, involved 70 ml of fuel putting out 900 kW of energy.
The LAMPRE reactor utilized tantanlum crucibles, and small amounts of plutonium, and thus heat transfer may not have been an issue, if, in fact, this 1MW/kg figure is real, which it may not be.
This suggests a role for 242Pu in reactors of this type, which is to lower the energy density of the fuel.
There is nuclear fuel available with a higher 242Pu content, largely available in France, which is "twice through" MOX. The vectors I've seen for it, show much higher concentrations of 242Pu.
I hope the French protect this fuel. It will be important for future generations to have it.
Have a nice day.
Identity and Toxicity of Off Gases in Thermolysis Lithium Battery Recycling Schemes.
The paper I'll discuss in this post is this one: Toxicity Identification and Evolution Mechanism of Thermolysis-Driven Gas Emissions from Cathodes of Spent Lithium-Ion Batteries (Fang Hu et al, ACS Sustainable Chem. Eng. 2019, 7, 22, 18228-18235).
Over the decades, I've encountered many members of the awful class of human beings to which I belong, "Baby Boomers" - a class that never really escaped from the "Baby" designation - who, when confronted with either an environmental disposal issue or to a limited resource issue, engage in hand-waving coupled with the magic word, "recycle."
I am not immune from this mentality of course; much of what I write on the internet is about recycling, in particular, the recycling of the components of used nuclear fuels, and recovery of the valuable components therein.
Of course, there really isn't much used nuclear fuel in the world - certainly less than would be desirable in a safe and sustainable world - and in pure terms of mass they physical transport of these materials would be, were we sane (and we're not) relatively trivial. In the United States, for example, the world's largest producer still of nuclear energy, after over 60 years of operations, less than 80,000 tons of used nuclear fuel exists. We may compare this with the hundreds of billions of tons of the dangerous fossil fuel waste carbon dioxide the United States has released in the last 60 years, and the hundreds of millions of tons of waste plastic, which despite all the rhetoric about "recycling" is clogging the guts of fish and other marine, lacustrine, and fluvial organisms and will soon, in terms of mass, exceed the mass of all the living marine, lacustrine and fluvial higher organisms.
The "recycling" of plastics did not work, is not working, but I think could work, albeit only with entirely new thinking of a type that isn't fashionable.
Nevertheless, despite our obvious failure to be responsible, we Boomers like to declare ourselves "green." We Baby Boomers like to tell lies, to ourselves and to others, witness that awful orange Baby Boomer creature sliming the White House with his insipid and criminal presence, who is, in some ways, the avatar of our generation. He is often portrayed and mocked using a giant orange plastic balloon, inflated with some of the last helium on Earth, wearing a diaper, which is amusing and perhaps proper in terms of marketing, but unfortunate in ways we often don't consider.
Even wit has environmental consequences.
If I differ from other Baby Boomers in magical thinking about recycling, it is only because I work to make myself aware of the practical aspects or recycling, many of which are far less "green" than we like to imagine, because first of all "recycling" requires significant amounts of energy and although a few of us know how to make clean energy, in general, as a practical matter, we don't do so.
One of the most intractable forms of waste is electronic waste. It turns out that when we engage in magical "recycling" of electronic waste, the actual performance of the task is consigned to poor people in areas about which we neither know or care to know, precisely because the risk and toxicology of the recycling technologies are dangerous to health of those performing the task and destructive to the environment, and as such, is not permissible in countries with sensible environmental regulations, regulations that diaper Don and his denizens are working to eliminate.
One of the big Boomer lies we tell ourselves and others is that we can make so called "renewable energy" viable if only we had enough batteries to store the energy generated by this pixilated scheme. So called "renewable energy" has not been viable, is not viable and won't be viable, and we will never have enough batteries to make it so. Nevertheless, we are accumulating batteries at an accelerating pace, and it is that which this paper discusses.
For the record, until recently, China was the most prolific electronic recycling nation in the world; the concentration of polybrominated diphenyl ether and other types of flame retardants, heavy metals like lead and cadmium, and similar substances in the plasma and other tissues of large numbers of Chinese children reflects the results of that "green" industry. As China is becoming rich and powerful, it has banned the import of electronic waste from other countries, and presumably we in the Western world will need to find other poor countries about which we couldn't care less to bear the environmental and health costs of our "green" ways.
Nevertheless, China, now becoming a rich country, has its own endogenous electronic waste problem, and it also has lots of practicing scientists to evaluate the consequences of the practice of recycling electronic waste.
From the introductory text of the paper:
Nowadays, many pyrometallurgical, hydrometallurgical, and bioleaching approaches have been proposed in order to recover valuable metals from the EoL LIBs.(8?11) In a typical pyrometallurgical process, valuable metals are enriched into alloy phases before being subsequently recovered via hydrometallurgical refining processes. Nonetheless, in recent years, state-of-the-art hydrometallurgical processes have increasingly become the preferred industrial method for recovery of a majority of valuable metals within the EoL LIBs cathodes.(12) Pretreatment, either via mechanical or chemical means, is required in order to make the different waste battery streams ready for the leaching operations that follow. Of these, thermal-based pretreatment processes have become widely adopted and have been the subject of numerous research in recent years.(13,14) For instance, Sun and Qiu(15) and Yang et al.(16) have suggested that heat treatment of the cathodes can lead to the active powder being completely separated from Al foils. Hanisch et al.(17) have proposed that the thermal decomposition of organic compounds like PVDF binder can reduce the cohesion of the coated particles and weaken the adhesion between the particles and Al foils. In our previous investigation, it was found that thermal pretreatment not only promoted the removal of the organic compounds but also benefited the subsequent leaching of valuable metals.(18) Nevertheless, the risks associated with the toxic off-gas emissions generated during thermolysis remain poorly investigated, and consequently, more detailed information on on the nature of such gas emissions is essential for the development of a more sustainable EoL battery recycling process.
Currently, a number of studies have been undertaken to illustrate the thermal runaway event of LIBs under abusive conditions, whether mechanical, electrical, or thermal.(19,20) During the thermal runaway, battery components, especially the electrolyte, are usually subjected to uncontrolled exothermic reaction chains, which can cause severe safety issues.(21,22) Consequently, the gas emission during thermal runaway of LIBs and its associated mechanisms are relatively well documented, whereas in contrast the gas emissions from a conventional EoL LIBs recycling process has received limited research. Recently, Diaz et al.(23) measured the generated off-gases during thermal and mechanical pretreatment of spent LIBs and found that the thermal pretreatment had superiority to avoid disordered dispersal of the organic substances into the subsequent processing steps. On the other hand, their results also suggested that the off-gases—composed of HF, COF2, acrolein, CO, formaldehyde, HCl, and electrolyte—were of acute toxicity...
COF2 is fluorophosgene. In my career I worked with chlorophosogene, most commonly called simply "phosgene." Phosgene is a war gas that was used to kill tens of thousands of soldiers in the First World War; flourophosgene is more reactive, and more toxic than the phosgene I know so well. HF is hydrofluoric acid. I worked with that too. The safety videos for working with HF include examples of where this acid burned right through to the bone of people who unknowingly had drops of HF solutions on their skin. It is advisable to wear a lot of protective clothing when working with it.
Apparently though, we need more batteries to be "green."
HF, by the way, is a useful reagent for recycling nuclear fuels, but the mass of nuclear fuels is much, much, much, much lower than the mass of batteries when one compares their existing inventory.
The authors used some wonderful analytical chemistry instruments to study the thermal recycling of lithium ion battery cathodes:
Beautiful stuff, although the reality is that all of these wonderful instruments will all some day be electronic waste in their own right, although I have personally been in laboratories featuring workable instruments that are many decades old, although usually these instruments are of a very special type.
Here's a graphic of the schematic of one analytical system:

The caption:
The batteries used in this study were real electronic waste, obtained from a real plant:
Here is a graphic of the DSC/TGA curves. The inflections and peaks represent points at which decomposition chemistry is observed:

The caption:
The mass spectra gives information about the chemical composition of these gases:

The caption:

The caption:
Ion current loosely corresponds to the concentration of the gases, but is a function of the ionization efficiency of the gases and thus the response factor, and is therefore not entirely quantitative without an internal standard.
The following graphic gives some idea of the elemental composition of the solid residues:

The caption:
There is a considerable amount of fluoride ion present, which is a good thing, since the volatile fluoride species are surely nasty. These fluoride ions are almost certainly present as the salts of the metals. Note that this data is in weight percent, and thus reflects the atomic masses of the elements in question. The conflict metal cobalt has an atomic weight of 58.933 grams per mole; lithium an atomic weight of 6.93 grams per mole. Thus on a molar basis, the lithium portion of the graphic, in green should be 8.5 times larger when normalized to the conflict metal cobalt, in purple.
Not all of the fluorine remains behind in the solid however; which is unsurprising, since the hexafluorophosphate ion that serves an electrolyte in lithium batteries (as the lithium salt) is made by reacting toxic pentafluorophosphorous gas with hydrogen fluoride (hydrofluoric acid) gas.
The following sets of equations show the reversal of this inorganic synthetic reaction, present as off gases in the thermolysis of the cathodes:


Nasty.
Flow rates of the off gases:

The caption:
A nice cartoon of the entire study's results:

The caption:
An excerpt from the paper's conclusion:
...…detailed characterization of the gaseous thermolysis products in conjunction with the quantitative changes of the solid products taking place as temperature was increased allowed the evolution mechanisms of the gas emissions from the cathodes to be determined. Also, the evolution mechanisms of the gas emissions driven by thermolysis under various temperatures were established. The solvent EC/EMC was found to volatilize and decompose into gaseous hydrocarbons, CO2, and H2O at around 177 °C. The electrolyte was the main source for the release of fluoridecontaining gases which are mainly composed of POF3 and HF over the same temperature range. The PVDF binder decomposed as H2O, CO2, and fluoride-containing gases with maximum emission peaks at 522 °C, whereas the generation of CO2 above 600 °C was attributed to the oxidation of acetylene black. The analytical data gained about toxic gas species and the evolution mechanism of gas emissions during the thermolysis process provide fundamental knowledge and useful guidance for the continuing investigation of sustainable battery recycling strategies.
The most recent Nobel Prize in Chemistry was awarded for the development of lithium ion batteries. It was well deserved. These batteries have proved to be useful tools in many areas.
Nevertheless it is a lie we tell ourselves to say that batteries will save the world.
They will not.
As this research shows, the idea that this particular type of battery is infinitely sustainable is dubious.
History will not forgive us, nor should it.
I hope you will have a pleasant weekend and enjoy the upcoming Thanksgiving holiday.
Critical Masses of the Three Accessible Americium Isotopes.
Despite the fact that the overwhelming number of war deaths in the last century have resulted from the diversion of petroleum products to make weapons of mass destruction, and zero deaths have occurred from the diversion of commercial nuclear fuel to make weapons of mass destruction, a great deal of attention has been paid to the concept of "critical mass" of actinides, as if it were simple to make nuclear weapons.
Anti-nuke rhetoric, which has made it technically unfeasible to address the far more serious and far more likely disaster scenario of mass destruction by climate change, albeit less instantaneous, as opposed to wholesale nuclear war, often includes silly and frankly absurd calculations about "how many" nuclear weapons can be built from used nuclear fuel.
The reality is that no one can make a nuclear weapon in one's kitchen, and without sophisticated and expensive equipment, anyone handling actinides other than uranium, a naturally occurring product, would face extreme danger to their person without taking extensive precautions.
This is why terrorists like the right wing zealot Timothy McVeigh, and the Saudi Arabian 9/11 terrorists utilized petroleum based weapons of mass destruction, diesel fuel and (dangerous natural gas generated) ammonium nitrate in McVeigh's case, and jet fuel in the Saudi terrorist's case.
As I pointed out elsewhere, it will never be possible to make nuclear war impossible, since uranium exists, and it will never be possible to consume all of the uranium on Earth: On Plutonium, Nuclear War, and Nuclear Peace
The number of extant critical masses that people who are, frankly, complete idiots, utilize in their appeals to fear and ignorance with respect to nuclear wars to advocate against "going nuclear" to address climate change - even though it is the only feasible means of doing so - has an alternate meaning however. The number of critical masses obtainable also represents the number of small nuclear reactors that can be built in a "breed and burn" sense which would render all of the world's depleted uranium and all of the world's waste thorium into valuable fuels with the potential to shut all energy related mining facilities indefinitely.
I favor the uranium/plutonium nuclear fuel cycle on the grounds that it is infinitely sustainable. I don't have anything against the thorium/U-233 cycle, but I think that because of geochemical quirks, it is possible to imagine the depletion of recoverable thorium resources because of thorium's low solubility in seawater when compared to uranium.
For many years, a few decades actually, I considered that there was not enough plutonium to immediately displace all the world's dangerous coal, dangerous petroleum, and dangerous natural gas. When I became aware of the "breed and burn" concept however, I realized that "enough" is simply a function of the number of available critical masses, meaning that the elimination of the use of dangerous fossil fuels is possible almost immediately, in the absence of stupidity, although the absence of stupidity may itself be inaccessible.
There is "enough," particularly in the desirable case of nuclear weapons disarmament.
Because used nuclear fuels have foolishly not been reprocessed over the more than half a century of accumulation in an atmosphere of fear and ignorance, much of the extremely valuable plutonium-241 formed in them, has been allowed to decay to Americium-241. Americium-241 is often thought to be a "difficult" nuclide, because it decays, producing a significant heat load in the process to neptunium-237, which in turn, is theoretically mobile in putative waste dumps, although the idea of having waste dumps for valuable nuclear fuel should be regarded as absurd, since all of the components of used nuclear fuel represent valuable resources.
Except for uranium-238 and thorium-232, both of which occur naturally in vast quantities, and some very rare isotopes of actinium, present in trace amounts in uranium ores, all of the actinides subject to isolation in macroscopic amounts have a critical mass in a fast (unmoderated) neutron spectrum.
As a nuclear fuel, Americium lacks some of the attractive features (to me anyway) present in plutonium and neptunium as nuclear fuels. Specifically the melting point of Americium is higher than either of these two actinide elements. (A plutonium/neptunium eutectic has the lowest melting point among the actinide elements subject to isolation.)
Nevertheless, as a source of denaturing isotopes of plutonium, plutonium-238 and plutonium-240 and plutonium-242, the use of americium fuels has much to recommend it.
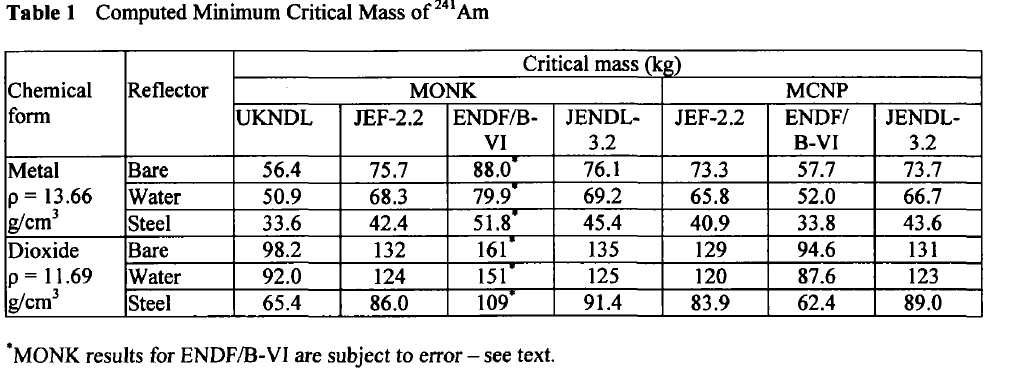
In 2003, at a conference on nuclear fuels, British authors, Henmanth Dias, Nigel Tancock, and Angela Clayton, offered a paper that recalculated the critical masses of Americium isotopes.
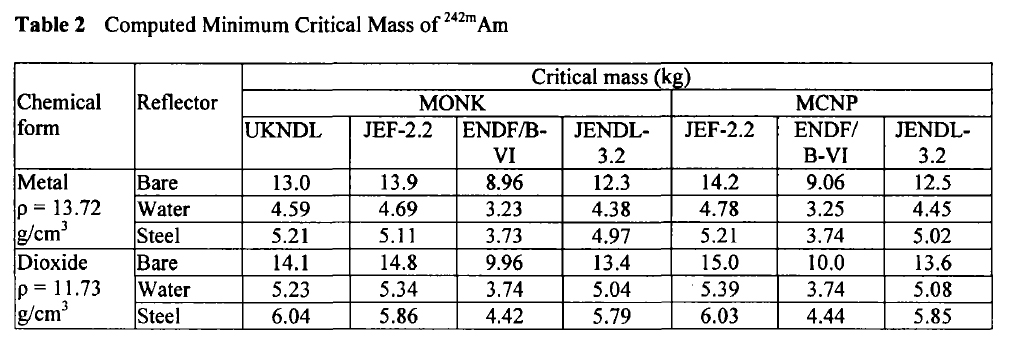
Three such isotopes will appear in Americium isolated from any source, Am-241, Am-242m, and Am-243. It is exceedingly difficult to separate the isotopes of americium, since it does not form volatile compounds. The shortest lived isotope just listed is Am-242m, which has a half-life, off the top of my head, of around 152 years. It is the least available of all Americium isotopes, since the majority of the 242 isotope formed in nuclear reactors is Am-242, the nuclear isomer of Am-242m, which has a half-life, again off the top of my head, of 16 hours. The 242 isotopes, both of them, are the most fissionable of all Americium isotopes.
Here are the calculated critical masses of Americium isotopes using various nuclear codes:
Am-241:
Am-242m:
Am-243:
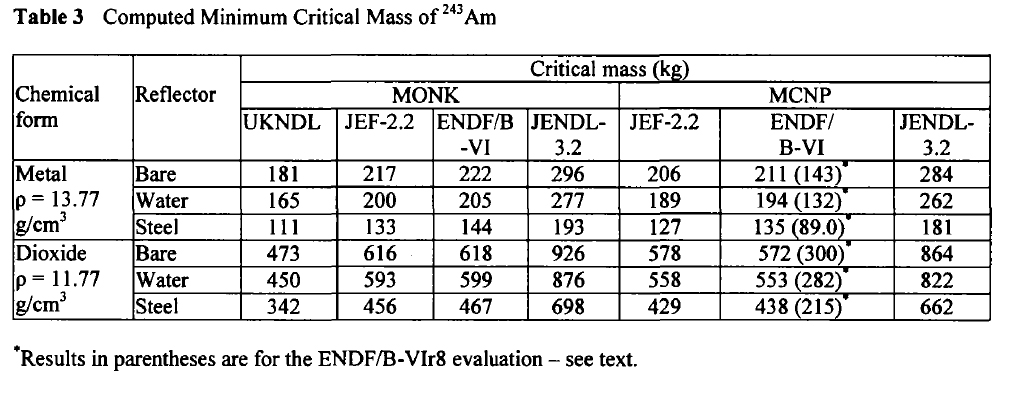
These tables are from the Proceedings of the JAERI conference 2003, pages 618-623.
I hope your weekend is wonderful; and that your plans for the upcoming Thanksgiving holiday are proceeding satisfactorily.
Distribution & Type of Marine Debris Polymers on Hawaiian Island Beaches, Sea Surface, and Seafloor.
The paper I'll discuss in this post is this one: Marine Debris Polymers on Main Hawaiian Island Beaches, Sea Surface, and Seafloor (Jennifer M. Lynch et al. Environ. Sci. Technol. 2019, 53, 21, 12218-12226).
As bird populations fall, accelerated by the wondrous goal of converting all of our continental shelves into industrial parks for wind farms, as well as because of the topic of this post, plastic, a part of the phosphorous cycle will be disrupted, specifically the sea to land portion. Many of the world's mined sources of phosphorous are actually bird droppings on Islands. For a short while, the island nation of Nauru in the Pacific Ocean had the world's highest per capita wealth in the world because it exported bird shit, phosphorous, deposited by sea birds over centuries. (The Nauruan Government "invested" all of this wealth in stocks and bonds which collapsed, and now the nation is one of the world's poorest, the bird shit is depleted, and the Island makes its living by imprisoning refugees deported from Australia.) The importance of birds to the phosphorus cycle is described in the interesting book Why Birds Matter, CAGAN H. SEKERCIOGLU, DANIEL G. WENNY, AND CHRISTOPHER J. WHELAN, Eds., University of Chicago Press, 2016, pp 274-275, 279-282.
I mention this, because I often think about the recovery of important elements and compounds from seawater by raising it to supercritical temperatures. This would serve to recover both phosphorous and carbon dioxide in cases where the seawater is dead from deoxygenation owing to agricultural run-off, as in the Mississippi River Delta, the ecosystem of which has been destroyed by runoff to make "renewable" corn ethanol. The eutrophication process which killed it, involves the explosive growth of micro-organisms which sink to the bottom of the sea as they die after getting killed off by the thickness of the mats they form which restricts sun light, are rotted by oxygen depleting bacteria, killing everything else, fish, crustaceans, and other species.
When I muse on this subject of supercritical water oxidation (SCWO) to recover phosphorous and carbon dioxide, I often reflect that a side product of the process would be to destroy microplastics, which are contaminating the ocean in ever larger amounts, and as another side product would be fresh water, since at supercritical temperatures and pressures, seawater separates into two separate supercritical phases, one containing salts, and one free of salts.
Future generations may need to do these sorts of things, because we have screwed them.
(I may discuss a few interesting papers I came across on polymer reprocessing engineering I just came across that were published in the last few days; not processes I necessarily endorse, but interesting engineering nonetheless, in future posts here.)
One thing I had not considered in my musings is the density of plastics, which is a topic covered in the paper under discussion.
From the paper's introduction:
Since Hawaii accumulates debris from a variety of sources, understanding the chemical composition of plastic marine debris is necessary.(15) Seven standardized resin codes are assigned to the most commonly produced polymers: (16) polyethylene terephthalate (PET, #1), high-density polyethylene (HDPE, #2), polyvinyl chloride (PVC, #3), low-density polyethylene [LDPE, #4, which includes linear low-density polyethylene (LLDPE)], polypropylene (PP, #5), polystyrene (PS, #6), and other polymers (#7). Some consumer goods are stamped with their resin code, but weathered fragments are often missing these stamps, requiring chemical analyses for identification.
Polymer identification of plastic marine debris is crucial for understanding sources, fate, transport, and effects in the environment. Because different polymers have various chemical structures, their physical, chemical, and biological interactions within the environment will differ. Sorption rates and concentrations of organic and heavy metal pollutants vary among polymers, making certain polymers a greater threat of contaminant exposure to organisms.(17) Chemical reactions during environmental degradation processes can lead to various polymeric degradation products that have not been widely studied.(18?23) The release of additives, fillers, and greenhouse gases(21,24) are highly variable among polymer type and in some cases even toxic.(25,26) Polymer identification tools also provide indicators of the extent of the debris weathering, a sign of aging or possibly a time estimate since littering.(20,27) Each polymer has a different chemical density, which is hypothesized to be a major (but not the only) influence in vertical stratification and fate of plastic debris in the ocean (Table 1).(28,29) For instance, polymers less dense than seawater (e.g., PE and PP) float and are commonly found at the sea surface,(30?34) while denser polymers predominantly sink to the seafloor.(29,35,36) In addition, polymer identification can confirm that debris samples are in fact plastic and other material is not visually mistaken as plastic.(37) These reasons, plus the need to understand which polymers may affect different marine habitats, provided justification for the present study.
The authors collected plastic samples from seawater, from the beaches, and the benthic zones of the Hawaiian islands.
They were collected by divers, by collecting plastics in trawlers, and by picking them up the beaches. The types of plastics were determined simply, by FTIR, using a Perkin Elmer library. (An alternative, and possibly superior approach to polymer identification is differential scanning calorimetry, DSC, but FTIR is pretty good.
Here's a description of the handling of the samples and the samples themselves:
...um...delicious...
A little more on polymer ID:
Anyway, here is the table, from the paper, detailing the density of various plastics.

Here is a map of the sampling site beaches:

The caption:
(The authors studied the effect of land development on beach plastic accumulation (see the excerpt below).
Debris amounts are higher in the MHI than many other places. Ribic et al.10 reported that Oahu has higher debris loads than the US Pacific coast. MHI beaches sampled in the current study were more plastic polluted than South Korean beaches (means = 13.2 items/m2 and 1.5 g/m2 of 0.5?2.5 cm each)53 even though they sampled additional particles in smaller size classes (<1 cm), which inflates their abundances compared to the current study. The current results are also 2 orders of magnitude greater than the North Atlantic Azores (0.62 pieces/m2 of >2 cm) of a similar size range.54 It is challenging to compare the present data with published debris abundances on beaches because of the differences in particle sizes targeted. This emphasizes the need to report multiple measurements (piece counts, size distributions, and mass) to understand the type of debris in a region...
The abundance of debris:

The caption:
Where the plastic ends up by form:

The caption:
The degree of weathering (probably somewhat subjective).

The caption:
Figure 4. Weathering rank of MHI plastic marine debris across compartments, percentages of pieces. Debris on the seafloor and leeward beaches (A) are less weathered than windward beaches and the sea surface (B) (MRPP, p < 0.0001). Values are mean ± one SD.
Composition by area of collection:

The caption:
Polymer composition as a function of the type of debris.

The caption:
The relationship between land use and polymer concentration is an interesting discussion:
These correlations could be confounded by beach cleanups, but we believe that this possible confounder is a minor variable. Cleanup effort is undoubtedly higher on tourist beaches, such as Waikiki, but large-scale cleanup events are scheduled frequently for the less developed beaches. The exact timing of cleanup effort before our sampling was often unknown. Kahuku on windward Oahu has less land development, is located within the James Campbell National Wildlife Refuge, and received the largest debris amounts of all sampling sites.14 Portions of Kahuku are cleaned up approximately weekly to monthly. It was obvious that a recent cleanup had occurred at one of our three Kahuku transects. Still, Kahuku had the highest debris abundance, suggesting that recent cleanup had little impact on our overall findings.
Percent land development and weathering intensity showed a strong negative correlation (Figure S10B, Pearson R2 = 0.600, p = 0.0051). Waikiki, the most developed, had the least weathered debris, suggesting that the small abundance of debris on this beach is from local sources with minimal exposure to environmental conditions. The least developed beaches (Kamilo, Lanai, and Molokai) had the most weathered debris. Weathering intensity for pieces exposed to sunlight could reflect environmental exposure time. The more weathered pieces on the sea surface and windward beaches were in the environment longer, arriving to Hawaii via wind and ocean currents from distant sources, compared to more recently littered debris on leeward beaches.
Types of debris were correlated with land development (Figure S10C). More fragments were found on less developed beaches (Pearson R2 = 0.362, p = 0.050), while more sheets were found on more developed beaches (Pearson R2 = 0.443, p = 0.025). Fragments are formed from mechanical and chemical weathering after extended environmental exposure. As such, the less developed windward beaches received debris dominated by fragments that were presumably washed ashore from older litter of distant sources...
There is quite a bit in the full paper, and, in any case, it certainly is sobering to contemplate this mess we're leaving for future generations.
While supercritical water oxidation may serve to reduce floating polymers it's not clear how to address sunken or buried polymers, and in any case, the industrial infrastructure to do this would need to be massive, and utilize sustainable energy, which does not include the solar and wind industry.
The paper's conclusion:
Scary, but interesting.
Have a nice day tomorrow.
An improved and less confusing data table combining the 2017, 2018, and 2019 WEO reports.
Looking at the table in this post, which I plan to use for reference, whether it is of much interest to others or not, I realized that the table was confusing, especially with respect to biomass, where the trends were not clear.
As noted in the post itself, in 2019, the IEA decided to break biomass into two sections, "solid biomass," the combustion of wind and straw, defined as "Solid biomass includes its traditional use in three-stone fires and in improved cookstoves" and "modern bioenergy" which is presumably mostly biologically derived ethanol and biodiesel from plant oils and fats.
In this updated table, I have summed "solid biomass" and "modern bioenergy" and deducted the total from the 2000 and 2017 figures to show the change in biomass use. Overall, the use of "renewable" biomass has declined slightly between 2017 and 2018, probably because of the improvement in meeting the UN's "human development goals," that is, in reducing poverty.
I have also combined changes and totals, all in units of exajoules or in "percent talk" in a single table. If it proves difficult to read, enlarge the view on the browser. Although it is a graphics object, it should be readable.
The new table is this one:

I apologize to any interested readers for any confusion.
Have a nice day.
Material Flow Analysis from Origin to Evolution
The paper I'll discuss in this post is this one: Material Flow Analysis from Origin to Evolution (Thomas E. Graedel, Environ. Sci. Technol. 2019, 53, 21, 12188-12196).
The author is a pioneer in the field of "Industrial Ecology." His biography, included in the paper, bears repeating:
Here's his picture:
 ?1441157285
He looks like a nice guy. Looks can be deceiving, but I'd expect given his focus on humanity, that he is a nice guy, and were he a creep, he would still be important to humanity.
Any effort to address environmental issues on a planetary scale, most notably but not limited to climate change, that does not consider this topic, industrial ecology, is bereft of any intellectual respectability and represents pure garbage thinking.
Period.
Here is a picture of a 55 square mile (144 sq. km) wind farm, Walney Extension wind farm, off the coast of England:

Here is a blurb about this wind farm from National Public Radio:
A 55-Square-Mile Wind Farm Is Now Operating Off England's Shore
This statement is effectively meaningless, since as is typical of the Trump scale lies associated with destroying the future with unwarranted faith in so called "Renewable Energy," it confuses energy and power. It does not matter how much power this 55 square mile monstrosity produces when the wind is blowing. What matters is for how long and when the wind blows. The full description by NPR also includes the misleading and frankly stupid unit of energy that appears in the media, the unit "homes."
This sentence - regrettably it rears its head in all kinds of news stories about so called "renewable energy" - shows that you cannot get a job as a journalist if you have passed a college level science course.
Here is a picture of the Diablo Canyon Nuclear Plant in San Luis Obispo in California, California's last operating nuclear plant:

Each of the twin reactors on the site is capable of producing 1100 MWe of electricity. In 2018, the two reactors combined, in two small buildings, produced, according to the California Energy Commission's Website, in units of energy, GWh (93.0 PetaJoules) of energy. This represented 9.38% of California's in state electricity production, produced in two small buildings. Thus the average continuous power, which is a unit of energy divided by the number of seconds in a year, was 2084 MW, meaning that the power from the plant, it's capacity utilization, was available 94.7% of the time, irrespective of whether the wind was blowing, the sun was shining, whether their was run-off from the Sierra Nevada mountain snow melts.
We do not know for how long and when the wind is blowing over the Walney Extension wind farm, and how often it produces 659 "Megawatts" of power, but if it did so 100% - it hasn't; it doesn't; it won't; - the Diablo Canyon Nuclear Plant produces, again in two buildings, 316% as much enegy as the Walney Extension wind farm produces in 55 square miles, 142 square km.
The Diablo Canyon Nuclear plant, is due to be closed by appeals to fear and ignorance, a result that will kill people, since nuclear power saves lives. Some of the people who will be killed will probably result from fires, since California is now laced with an extensive array of high voltage power lines designed to service it's so called "renewable energy" infrastructure, and, since wind power can do nothing to address climate change, and since it takes a lot of money to maintain power lines, and - the point of this discussion of industrial ecology - a lot of copper, aluminum and steel, as well as petroleum to fuel trucks, and chemicals to make herbicides - a lot of materials to do so.
Both reactors came on line in 1985, built using technology developed in the 1960's and 1970's, after huge protests involves appeals to ignorance in a state where huge numbers of people die from air pollution, and both will shut in 2024, again, killing people. They will not close because they will be inoperable. They will close because of appeals to ignorance.
Anyway.
Based on data from the Danish Energy Agency's master database of wind turbines, and my most recent analysis of it, which I last completed on May 13, 2018, according to my files, the average lifetime of a wind turbine is 17.77 years. 17 years and 283 days. (At the time of that analysis, the 2017 average continuous power of all the wind turbines in Denmark was 1907 MW, again less than the two buildings in the Diablo Canyon Nuclear Plant.) This lifetime data - the Walney Extension wind turbines are of Danish manufacture - suggests that in 20 years or less, the average wind turbine in the Walney Extension will be a rotting hulk, needing to be hauled away for dumping, recycling, or else rotting at Sea.
By the way, it takes huge amounts of energy to recycle huge amounts of materials.
This brings me to the paper, which is a summary paper with some nice illustrative graphics.
From Dr. Graedel introductory paragraphs:
Material flow analysis is one of the central methodologies of industrial ecology. It is through MFA that an “industrial metabolism” (the flows of resources into and from a particular entity of human society) can be mapped and quantified, much as an accountant determines and quantifies monetary deposits and withdrawals. Dynamic MFAs (those that treat a specific region or system over time) go further; they permit a determination of the in-use and “hibernating” stocks of materials in an industry or society (the material version of the accountant’s “assets and liabilities”).
Unlike the accountant, however, who deals only with stocks and flows generally well-reported in monetary terms, the MFA analyst faces a wide diversity of commodities biomass, polymers, metals, minerals whose transactions often deal with inadequately described categories (e.g., “iron and aluminum alloys”), lumped categories (e.g., “plastics”), or resource flows that are seldom or never measured (many of the discard flows). MFA-related information quality may vary, from data to rough estimates to conjecture. The MFA analyst also needs to address flows that are of little import to the accountant because they are not monetized, such as waste flows not captured or emissions to the environment. The MFA specialist must therefore be part detective, part archivist, part extractor of information from experts, and part bold estimator, in order to build the internally consistent database needed to
achieve a useful material flow analysis.
In principle, MFA approaches can be applied to any material or combination of materials. In practice, metal stocks and flows have thus far proven to be the most suitable for analysis, largely because they can often be relatively easily tracked, and because data are commonly available for at least some parts of their life cycles. However, MFAs can also treat groups of materials, such as construction minerals (sand, crushed stone, cement) or summed material flows into and from a country or region.
Dr. Graedel proceeds to give a nice overall background of his discipline, covering it's strengths, limitations, and techniques of the materials scientists working with it.
Another excerpt:
A list of attributes necessary to the designation of a MFA could well include the following;
i An MFA is the study of a clearly designed material flow system, not merely the study of a particular material flow.
ii An MFA includes a detailed description of each flow in the system (e.g., the physical and chemical state of each material), regardless of whether the flows are physical or monetary.
iii An MFA quantifies all flows of significance in the system. Conservation of mass constraints apply at each of the system nodes.
iv The presentation of MFA results is generally diagrammatic as well as numeric.
v An MFA analysis includes a discussion (or, better yet, a detailed analysis) of the reliability of the results.
An example of a typical well-characterized material flow system is shown in Figure 1: a regional-level cycle of copper. In this diagram the material flow from ore in the mine begins at the left and proceeds through ore processing, metal preparation, employment in product manufacture, use, eventual discard, either loss to landfill or recycling into the scrap market, and back into use. Because what is pictured in Figure 1 is for a specified geographical area (not global), import and export flows are included.
Figure 1:

The caption:
The caption:
Figure 2. 2010 Zn cycle for Asia.(44) The line widths are proportional to the magnitudes of the zinc flows from one node of the diagram to the next. The colors indicate flows of zinc during ore processing (yellow), fabrication (blue), manufacturing (tan), and discard, recycling, and loss (green). Min = mining, S = smelting, F = fabrication, Mfg = manufacturing, U = use, W = waste management. The units are Gg/a.

The caption:
Figure 3. Saturation of per capita iron stocks, as revealed by country-level MFA analyses.(45)

The caption:

The caption:
Excerpts on classes of materials:
...4.1.4. Construction Minerals. Most modern construction employs minerals: cement, crushed stone, sand, and ornamental stone such as marble. The amounts used are very large?larger even than food or fossil fuels.28 Most of these materials have low value and are mined and used locally, which tend to limit the availability of data. Unlike other minerals, however, data for cement seem well enough established to enable cement MFA analyses to be generated.29,30 In fact, estimates of the annual production of concrete are generally produced by utilizing cement data in combination with average ratios of cement to crushed stone and sand.
Two decades ago, some national material cycles6 attempted to quantify the flow of materials such as soil and rock that was mobilized by farm tilling and road building. The quantities proved difficult to quantify, however, and their usefulness was uncertain, so the effort has not been expended in recent years...
The paper is regrettably not open sourced, but an interested party who really cares about the environment and the future is encouraged to travel to a good library to access it. If one is not interested in the environment and the future, one can always cruise to websites about how great solar and wind and Tesla electric cars are, or simply watch television.
OK (fellow) Boomer?
History will not forgive us, nor should it.
I trust you'll have a pleasant Sunday. I know I will. This evening I get to pick up my son, the developing Materials Scientist, from the airport, and chat with him about, um, materials science.
World Energy Outlook, 2017, 2018, 2019. Data Tables of Primary Energy Sources.
On this website, quite justifiably since it is a political website where science is simply a backwater, great attention is being paid to the historic level of criminality in the present administration.
However, over the long run, even if this historic criminality has the potential destroying the United States, or at least destroying its prestige and standing in the world, there is a greater criminality before which US political criminality pales, and that is the destruction of the planetary.
In another context, Abraham Lincoln wrote:
If we substitute, speaking of the members of our party and not all Americans, clearly, "environment" for "Union" the statement should hold, but frankly, while I am confident that the environment can be saved, I'm not sure that "we" really have the courage and openness to know how to save it.
The data isn't pretty, but there is no technical reason that it need be as ugly as it is, but it will be ugly as long as appeals to fear and ignorance both on the right and on the left, are allowed to prevail. Let's be clear, fear and ignorance are prevailing where environmental issues are concerned.
For the last three years, I have kept spreadsheets of the data contained the International Energy Agencies "World Energy Outlook" (WEO) reports reflecting all sources of energy. In my personal electronic library I have copies of every report issued every year since 2006, and also have in my library, for amusement (giggling at a tragedy), the 2000 and 1995 issues.
I will reproduce some of these tables, those I use personally for calculations, and original tables from the last three editions of the WEO. Necessarily, the WEO data is the data from the previous year of the edition, 2017 refers to 2016 data, 2018 refers to 2017 data...and so on. Several years ago this lag time was actually two years, but reporting mechanisms have improved apparently.
The unit utilized in the World Energy Outook is the unfortunate unit "MTOE" which stands for "Million Tons Oil Equivalent."
The SI unit for energy is the Joule. The IEA offers a table of conversion factors including the TJ, the TeraJoule, one trillion joules. It is found on page 772 of the 2019 World Energy Outlook. Here it is:

Use of the TeraJoule to represent world energy production gives unwieldy numbers. When thinking about world energy supplies and production I have preferred, for the last 20 years, to think in exajoules, which gives in general two digit or three digit numbers.
Here are the conversion factors I use regularly to think in terms of exajoules and in terms of energy resources.

KgPuEq is a unit that only I use, and as it seems it is "kilograms of plutonium equivalent." Ignoring neutrinos since they don't interact well with matter and thus their energy cannot be captured, a kilogram of plutonium fully fissioned, represents about 80.3 trillion joules, or 80.3 TJ. Thus a million tons of oil is the equivalent of a little over half a ton of plutonium.
It is interesting that people are quite willing to accept the death toll associated with the combustion of a million tons of oil - seven million deaths per year from air pollution - and yet will engage in paroxysms of agony over the discovery of an object coated with trace plutonium that might have been laying around for decades without harming a single sole. Such people are Trumpian in their ignorance; Trumpian in the stupidity of their assertions, Trumpian in the perniciousness of their effect on history.
Anyway, the tables, first my own calculation tables for the years, 2016, 2017 and 2018, covered by the WEO's of the subsequent years.
Here is what I compiled in MTOE for the three years:

Here is what I compiled in the SI unit ExaJoules, EJ:

In previous editions, both forms of bioenergy, traditional and "modern" were included in the same category. This accounts for the blank spaces in these tables. Bioenergy is by far, the world's largest, and by far its most dangerous and destructive, form of so called "renewable energy."
In these tables, the headings, "Current Policy Scenario," "Stated Policy Scenario" and "Sustainable Development Scenario" are the terms utilized in the 2019 WEO edition. They are similar, but not identical, to terms used in previous editions. Finally the projection figures assembled by the large international team are for 2030 and 2040 as in the 2019 WEO. The projections in the 2018 WEO were for 2040 and 2025. In the 2017 edition, several different tables were utilized for each scenario.
Predictions about energy are usually bull, by the way, whether it's intellectually and morally contemptible drivel "studies" from Greenpeace about 100% "renewable energy" by 2050, or 2075 of 2100 or whenever the predicting party will be dead, or whether it was drivel produced by the tiresome fool Amory Lovins in the 1970's, or for that matter the EIA.
There is always the hope we will wake up.
This table, also mine, shows the changes in primary energy use in this century:

This table uses the "percent talk" by which anti-nukes misrepresent the complete and total failure of so called "renewable energy" to save human lives and the ecosystem of the entire planet, which is being destroyed by dangerous fossil fuel waste. It also shows absolute numbers, again in ExaJoules.
In Trumpian scale lying represented by "percent talk," so called renewable energy is - one hears this Trumpian Scale Lie alot - has been the fastest growing source of energy on the planet in this century.
In absolute numbers, exajoules, the fastest growing source of energy on this planet in this century has been coal. Coal use grew in the world at large between 2017 and 2018, despite what one may have heard in the American provinces.
In absolute numbers, dangerous natural gas was the second fastest growing source of energy in this century.
In absolute numbers, dangerous petroleum was the third fastest growing source of energy on this planet.
In this century, world energy demand grew by 179.15 exajoules to 599.34 exajoules.
In this century, world gas demand grew by 50.33 exajoules to 137.03 exajoules.
In this century, the use of petroleum grew by 34.79 exajoules to 188.45 exajoules.
In this century, the use of coal grew by 63.22 exajoules to 159.98 exajoules.
In this century, the solar, wind, geothermal, and tidal energy on which people so cheerfully have bet the entire planetary atmosphere, stealing the future from all future generations, grew by 9.76 exajoules to 12.27 exajoules.
A note on the only sustainable form of energy there is, nuclear energy:
In the days where I used to write over in the E&E forum, which is less about science as it is about sarcasm in the face of what may yet prove to be the most destructive deliberate consequence of human action, outstripping even the spread of the bubonic plague, and even World War II, climate change, there was a certain set of people who appealed to the logical fallacy of Appeal to Popularity
These people were decidedly not intellectuals in any shape, manner, or form, and there were a number of them whose intellects were so weak that they generally expressed themselves with emojis, since they lacked the intelligence to use words. Their arguments to support the unsupportable proposition that so called "renewable energy" was a good and viable way to address climate change.
These were not people who actually gave a rat's ass about climate change, nor people who gave a rat's ass about the massive death toll from air pollution and, increasingly, extreme weather. Their target was, and is I suppose, were I still listening to their tortuous claptrap, nuclear energy, which I'm not doing.
Like those television ads that try to get you to buy a car or a soft drink or any other consumer junk by using the term "best selling," in the ad, these people loved to announce that so called "renewable energy" was good because someone was building a massive wind farm in previously pristine wilderness, or solar cells were selling like hot cakes in Southern California.
The inverse was of course, to gloat, because nuclear plants were being shut. The fallacy was that since the idea of shutting nuclear plants was popular, it was therefore a good idea.
This represents another popular idea that killed people, since nuclear plants save lives.
Now these are stupid people, these gloating antinukes, and their ignorance extends beyond their vast technical ignorance. Since they would rather engage in the circle jerk of equally stupid people quoting one another - it's sort of like the Republican party, isn't it - than actually find things out, if by nothing else, by reading and contemplating data, they would note that nuclear energy has consistently produced a constant amount of energy for almost two decades without many new nuclear plants being added to the fleet. This means that nuclear plants are reliable and long lasting. This consistent amount of energy was produced despite a constant stream of screaming marketing that is reminiscent of similar anti-science appeals, anti-vaxxing and anti-GMO.
It is a fact that almost all of the world's operating nuclear plants were built using technology developed in the mid 20th century. It is a fact that they have produced more than 3 times as much energy as the forms of so called "renewable energy" represented by solar and wind, even as trillions of dollars resulting from appeals to popularity were squandered on billions of tons of this future electronic landfill.
Since the people applauding this state of affairs are ignorant of just about everything they do not know a damned thing about industrial history. The country that built the most nuclear reactors is the United States. It built almost all of them in a 25 year period lasting from about 1960 to 1985, this while producing the lowest price electricity in the industrial world.
But appeals to ignorance are the key to marketing, as we can see as we have a criminal in the White House and there are still people who worship the criminal fool.
There are still people who accept seven million air pollution deaths per year by claiming that "nuclear power is dangerous!"
Their strategy was the "Gym Jordan" strategy of "look there goes a squirrel." If you try to discuss the seven million deaths a year with these moral idiots, they'll come up with some idiot statement asking how much "hot steel" there is in the world, even though "hot steel" has never killed as many as the 19,000 people who will die today from air pollution. They'll point to some mildly radioactive material at the Hanford nuclear weapons plant as if it was some kind of tragedy requiring international attention, while the aforementioned 7 million who will die this year from air pollution require no attention.
There is no technical reason that nuclear energy cannot be expanded at the same rate it expanded in the 20th century, at a rate of ten exajoules per decade. This has already been done, with primitive technology In fact there is no technical reason that it can't be expanded at four or five times that rate. Our used nuclear fuel contains enough plutonium, in a breed and burn scenario to produce all of the world's energy indefinitely, using uranium and thorium already mined.
The issue is not technical. The issue is the plausible lie, and the international embrace of the plausible lie. But a lie is a lie, plausible or not.
The data is here; the data is no lie. I will shortly paste some original tables from the WEO editions in my files.
Let me say this, though, since rightly, the issue of the appalling stupidity of my generation, the consumer generation, the distracted baby boomers is coming to world attention: We grew up in the shadow of nuclear war. We heard static from giant nuclear weapons tests. When I was a child I thought that the element that has so fascinated me as an adult, cesium, had no non-radioactive isotopes. We lived in fear of nuclear Armageddon.
None of this is an excuse for what we have done. We announced ourselves as young people as the generation of "peace and love" but later only included "love" in "sex, drugs, and rock and roll." We have partied ourselves to death, not just our own deaths, but the death of a planet.
OK Boomers. We're done. Let's move aside and let the real grown ups, the millennial, work to undo what we have done. If we can't think, and clearly we can't, let's get out the way.
Some tables from the original WEO reports:
Table 1.1 page 38 World Energy Outlook 2019:

Table 1.1 page 38 World Energy outlook 2018:

Table A.2 (partial) page 647 World Energy Outlook 2017:

Table 3.2 pg 79 World Energy Outlook 1995 (Predicting 2010):

Table 2.1 Page 51 World Energy Outlook 2012 (Data from 2010):

I trust you're having a nice weekend.
The 2019 IEA WEO Is Out: Solar and Wind Energy Grew By 15.35% From 2017-2018.
The 2019 World Energy Outlook, put out by the International Energy Agency is out; I downloaded it this afternoon. I've been calculating from the figures provided in table 1.1 on page 38, (interestingly the same page and table number as in the 2018 edition.)
For some time, relying on the 2018 Edition, I have been including the following text in many of my posts in which I address our belief that solar and wind energy will save the day:
In this century, world gas demand grew by 43.38 exajoules to 130.08 exajoules.
In this century, the use of petroleum grew by 32.03 exajoules to 185.68 exajoules.
In this century, the use of coal grew by 60.25 exajoules to 157.01 exajoules.
In this century, the solar, wind, geothermal, and tidal energy on which people so cheerfully have bet the entire planetary atmosphere, stealing the future from all future generations, grew by 8.12 exajoules to 10.63 exajoules.
10.63 exajoules is under 2% of the world energy demand.
2018 Edition of the World Energy Outlook Table 1.1 Page 38 (I have converted MTOE in the original table to the SI unit exajoules in this text.)
This is not going to popular, but, sorry, for the record, I'm a scientist, and as one, I do not elevate my pet theories over experimental results. Solar and wind did not save the day; they are not saving the day; they won't save the day. This week we went past 410 ppm of the dangerous fossil fuel waste carbon dioxide concentrations in the planetary atmosphere; we will surely approach or pass 418 this May.
If you want someone to tell you what you want to hear, I'm not the guy to do it.
To me, facts matter.
The title of this post is an abuse of language, deliberately, because it is what I call "percent" talk. It is an abuse of language since it is a very different thing to say that I have increased my wealth by 200% if I had a dollar and now have three, than if I am Bill Gates and I announce that I have increased my wealth by 200%.
It is true that solar and wind energy (with a little geothermal and tidal energy thrown in - the IEA calls all 4 categories "other" ) grew by 15.35% but the total in 2017 was 10.63 exajoules, and in 2018 was 12.27 exajoules, thus 15.35% is an increase of just 1.63 exajoules.
The reason that solar and wind can grow so seemingly large in "percent talk" is that they have both been consistently been trivial, all through half a century of wild cheering for them, and the expenditure of trillions of dollars on them. In "percent talk" however, they cracked 2% this year, and now represent 2.05% of world energy output.
For comparison purposes, the fastest growing source of energy from 2017 to 2018 was, unsurprisingly, dangerous natural gas, which grew by 6.95 exajoules to 130.08 exajoules. Dangerous petroleum grew by 2.76 exajoules to 188.45 exajoules. Dangerous coal, which decreased moderately from 2016 to 2017 actually (to my surprise) grew by 2.97 exajoules to 159.98 exajoules.
World Energy Demand grew by 14.36 exajoules to just shy of 600 exajoules, to 599.34 exajoules to be exact, or in "percent talk," 879.49% faster than solar, wind, geothermal and tidal energy combined. When I started writing here on Energy and the Environment and hearing how the world would be saved by renewable energy and conservation, that figure was under 450 exajoules. If this sounds like Schadenfreude, there's no happiness in it for me; I would have rather been wrong than right.
There is popular enthusiasm for "phasing out" the world's only sustainable form of energy, nuclear energy, an idea that represents mass insanity, mass ignorance, and mass hysteria.
To my surprise, while under constant attack by uneducated and, in my opinion extremely stupid people who obviously can't think, the production of nuclear primary energy rose by 0.88 exajoules to 29.68 exajoules. This is almost certainly connected with Chinese nuclear plant construction.
This rise in nuclear output is not enough, not even close to being enough, but we'd rather have California burn to the ground in darkness, laced with all those extra required power lines required to connect to wind turbines and solar cells, than open science or engineering books.
(I actually saw a person from San Francisco who writes here, complain about PSEG's last nuclear plant while bashing that company for having poorly maintained power transmission lines all over the state. The IEA, which represents solar and wind energy as "sustainable" although they are no such thing, has also written publications about the increased requirement for transmission lines (with the resultant requirement for copper, aluminum and steel) to make us all "renewable." There is simply no addressing ignorance.)
Along side all of this, seven million people will die this year, 19,000 today, from combustion wastes from dangerous fossil fuel and dangerous biomass combustion waste, also known as "air pollution."
Fukushima.
History will not forgive us, nor should it.
OK Boomers?
Have a nice evening.
My son is living in the world I want, courtesy of the Italian Government.
Because of some research my son did this summer at Oak Ridge as an intern, he was advised to apply for the "Italian Tech Award."
He seems to have won it.
His mother and I were not entirely happy about it, since it involved traveling to Italy for a week at the expense of the Italian government and is taking place now, right in the middle of the semester.
Nevertheless, he spoke with all of his professors, and they advised him to go, and to learn about some cutting edge Italian scientific research, at the expense of their government.
Well he's there, so I texted him to see how it was going. He's pretty thrilled. He told me that he got to speak Spanish, Italian, Russian and Chinese with native speakers all in the same day, had a wonderful conversation with an Iranian scientist on the subject of piezoelectric clothing, which converts body motions into electricity, made very good friends with a Mexican chemical engineering student, and met with people from Uzbekistan, Russia, Italy (of course) and China and is apparently being exposed to some wonderful science.
This is the good world, where people get together to admire one another. This is the world I want, one built on respect all humans for other humans.
I really didn't get why the Italian government was doing this for foreigners, but it occurs to me that all these winners, for the rest of their lives, will have a positive view of Italy, Italian science, and Italian business. My son is twenty years old, and hopefully will lead a long and productive life, always with Italy in the back of his mind, with fondness.
Governments can do great things, in spite of having occasions where they are led by vicious fools, like that corrupt ass in the White House.
SpaceX Launch Highlights Threat to Astronomy.
This is a news item from Nature. I believe it's open sourced, since I didn't need to login to access it.
It's here: SpaceX launch highlights threat to astronomy from ‘megaconstellations’
Nature News November 11, 2019.
It's another way how present day consumers are denuding the future of humanity for mere amusement, demonstrating contempt for all future generations, now by foreclosing the night sky.
A graphic:
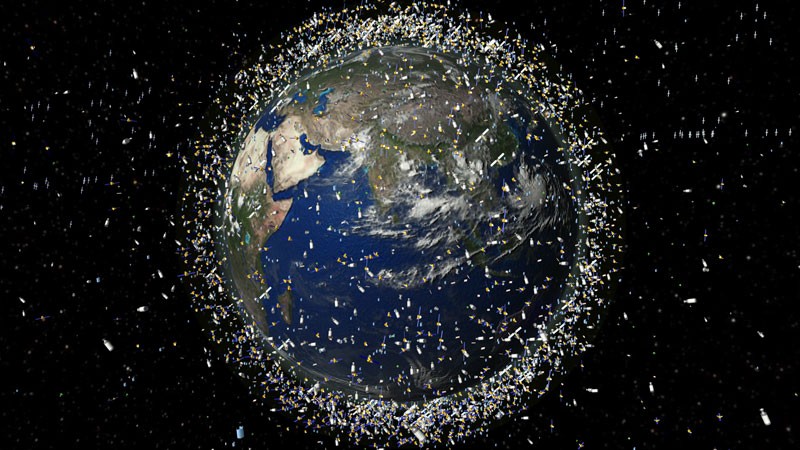
Some text:
SpaceX aims to launch its second set of these satellites — called Starlinks — from Cape Canaveral, Florida, just before 10 a.m. local time; the first 60 went up in May. But these launches are just the beginning: by the end of 2020, there could be hundreds of Starlinks in orbit, and SpaceX envisions thousands in the years to come. Other companies such as Amazon, headquartered in Seattle, Washington, and London-based OneWeb are planning launches that altogether could more than double the number of existing satellites. They are meant to bring fast, reliable Internet to underserved communities worldwide, with other potential applications, including improved satellite Internet service for military planes.
Although it’s not clear how many of the planned megaconstellations will actually be built, several researchers have begun to analyse how the satellite networks could affect astronomy. The situation doesn’t seem as bad as initially feared, but might still dramatically shift how some astronomers do their jobs...
...Within the next year or so, SpaceX plans to launch an initial set of 1,584 Starlink satellites into 550-kilometre-high orbits. At a site like Cerro Tololo, Chile, which hosts several major telescopes, six to nine of these satellites would be visible for about an hour before dark and after dawn each night, Seitzer has calculated.
Most telescopes can deal with that, says Olivier Hainaut, an astronomer at the European Southern Observatory (ESO) in Garching, Germany. Even if more companies launch megaconstellations, many astronomers might still be okay, he says. Hainaut has calculated that if 27,000 new satellites are launched, then ESO’s telescopes in Chile would lose about 0.8% of their long-exposure observing time near dusk and dawn. “Normally, we don’t do long exposures during twilight,” he says. “We are pretty sure it won’t be a problem for us.”
But an upcoming, cutting-edge telescope could be in bigger trouble. The US Large Synoptic Survey Telescope (LSST) will use an enormous camera to study dark matter and dark energy, asteroids and other astronomical phenomena. It will survey the entire visible sky at least once every three nights, starting in 2022. Because the telescope has such a wide field of view, satellites trailing across the sky could affect it substantially, says Tony Tyson, an astronomer at the University of California, Davis, and the LSST’s chief scientist.
He and his colleagues have been studying how up to 50,000 new satellites — an estimate from companies’ filings with the US government — could affect LSST observations. Full results are expected in a few weeks, but early findings suggest that the telescope could lose significant amounts of observing time to satellite trails near dusk and dawn.
I know...I know...I know. Here on the left this asinine billionaire child Elon Musk is some kind of hero, because, on a planet where over 1 billion people lack access to any kind of improved sanitation, he makes electric car playthings for billionaires and millionaires.
Personally, this mentality appalls me.
I'll chalk up the worship of this tiresome fool as yet another example of why history won't forgive us, and again, there's no reason it should.
"OK boomer..."
I trust you're having a nice evening.
Profile Information
Gender: MaleCurrent location: New Jersey
Member since: 2002
Number of posts: 33,516