Welcome to DU!
The truly grassroots left-of-center political community where regular people, not algorithms, drive the discussions and set the standards.
Join the community:
Create a free account
Support DU (and get rid of ads!):
Become a Star Member
Latest Breaking News
General Discussion
The DU Lounge
All Forums
Issue Forums
Culture Forums
Alliance Forums
Region Forums
Support Forums
Help & Search
OKIsItJustMe
OKIsItJustMe's Journal
OKIsItJustMe's Journal
July 4, 2019
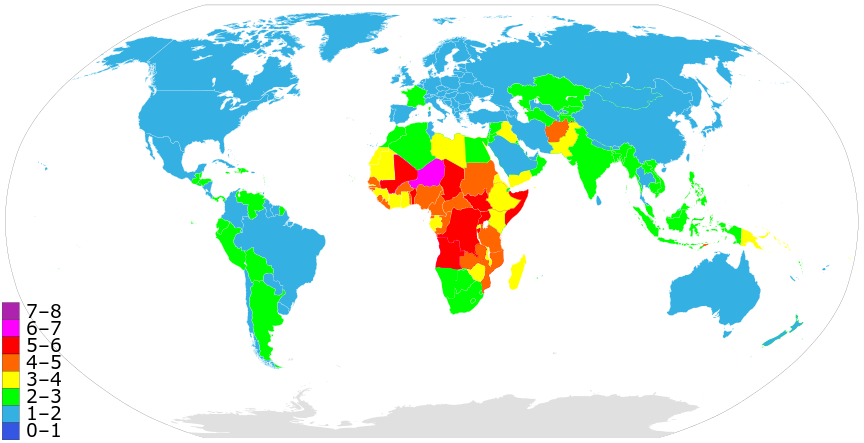
Map of countries by fertility rate (2018), according to CIA World Factbook
Yet, the US is the primary source of carbon dioxide emissions:
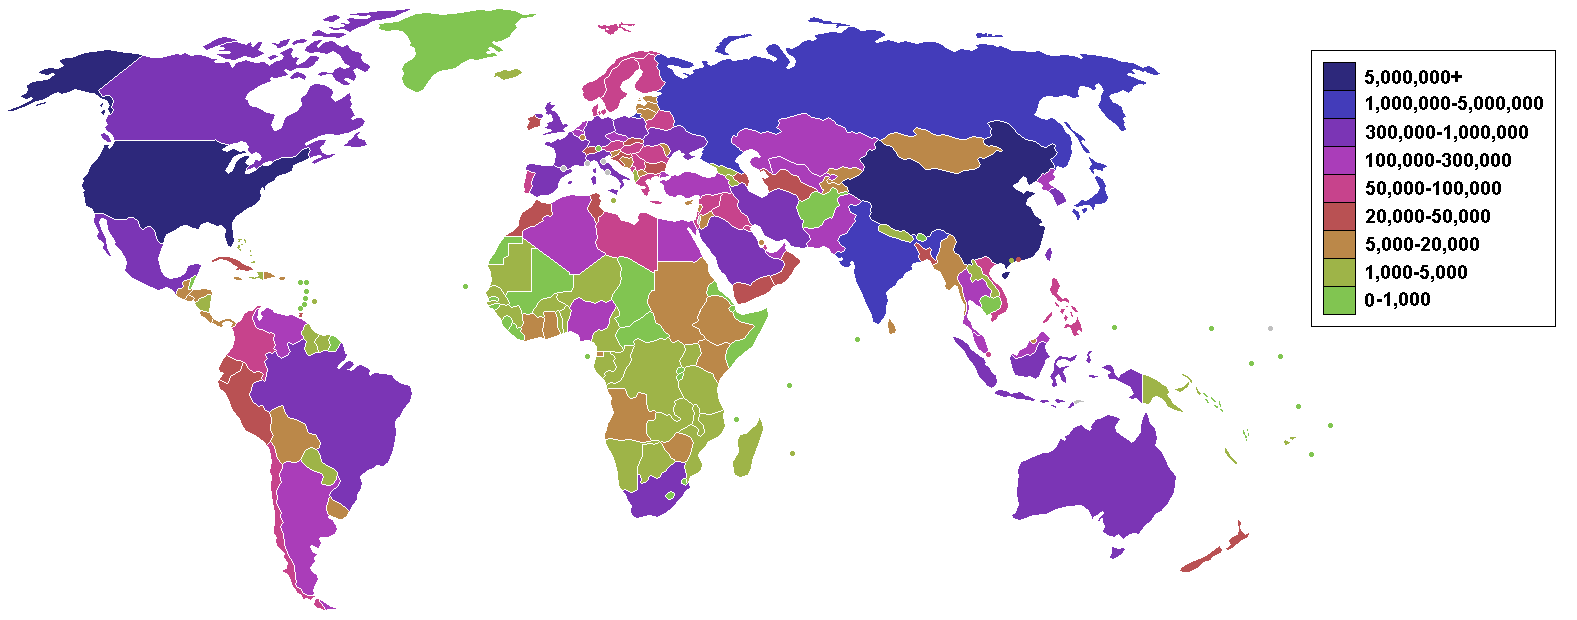
Countries by carbon dioxide emissions in thousands of tonnes per annum, via the burning of fossil fuels (blue the highest and green the lowest).
The reason is our very high per capita CO₂ emissions:

Birth rates clearly are not the cause of "climate change."
By harping about "birth control," US citizens can blame Africans for "climate change" because their birth rate is so high. If our per capita CO₂ emissions matched Africa’s, we wouldn’t be in this predicament.
That’s why I have decided the meme is racist in nature.
It’s also a convenient excuse not to do something difficult, like cutting our per capita emissions. After all, such efforts are useless if those Africans are going to keep breeding? (Right?)
I have decided that the "birth control"/"climate change" meme is racist
The US has a relatively low total fertility rate (births per woman) compared to Africa:
Map of countries by fertility rate (2018), according to CIA World Factbook
Yet, the US is the primary source of carbon dioxide emissions:
Countries by carbon dioxide emissions in thousands of tonnes per annum, via the burning of fossil fuels (blue the highest and green the lowest).
The reason is our very high per capita CO₂ emissions:
Birth rates clearly are not the cause of "climate change."
By harping about "birth control," US citizens can blame Africans for "climate change" because their birth rate is so high. If our per capita CO₂ emissions matched Africa’s, we wouldn’t be in this predicament.
That’s why I have decided the meme is racist in nature.
It’s also a convenient excuse not to do something difficult, like cutting our per capita emissions. After all, such efforts are useless if those Africans are going to keep breeding? (Right?)
May 24, 2019
New Studies Increase Confidence in NASA's Measure of Earth's Temperature
(Please note: Story from NASA — copyright concerns are nil.)
https://climate.nasa.gov/news/2876/
Features | May 23, 2019
New Studies Increase Confidence in NASA's Measure of Earth's Temperature
By Jessica Merzdorf,
NASA's Goddard Space Flight Center
A new assessment of NASA's record of global temperatures revealed that the agency's estimate of Earth's long-term temperature rise in recent decades is accurate to within less than a tenth of a degree Fahrenheit, providing confidence that past and future research is correctly capturing rising surface temperatures.
The most complete assessment ever of statistical uncertainty within the GISS Surface Temperature Analysis (GISTEMP) data product shows that the annual values are likely accurate to within 0.09 degrees Fahrenheit (0.05 degrees Celsius) in recent decades, and 0.27 degrees Fahrenheit (0.15 degrees C) at the beginning of the nearly 140-year record.
This data record, maintained by NASA’s Goddard Institute for Space Studies (GISS) in New York City, is one of a handful kept by major science institutions around the world that track Earth's temperature and how it has risen in recent decades. This global temperature record has provided one of the most direct benchmarks of how our home planet's climate has changed as greenhouse gas concentrations rise.
The study also confirms what researchers have been saying for some time now: that Earth's global temperature increase since 1880 – about 2 degrees Fahrenheit, or a little more than 1 degree Celsius – cannot be explained by any uncertainty or error in the data. Going forward, this assessment will give scientists the tools to explain their results with greater confidence.
GISTEMP is a widely used index of global mean surface temperature anomaly — it shows how much warmer or cooler than normal Earth’s surface is in a given year. "Normal" is defined as the average during a baseline period of 1951-80.
NASA uses GISTEMP in its annual global temperature update, in partnership with the National Oceanic and Atmospheric Administration. (In 2019, NASA and NOAA found that 2018 was the fourth-warmest year on record, with 2016 holding the top spot.) The index includes land and sea surface temperature data back to 1880, and today incorporates measurements from 6,300 weather stations, research stations, ships and buoys around the world.
Previously, GISTEMP provided an estimate of uncertainty accounting for the spatial gaps between weather stations. Like other surface temperature records, GISTEMP estimates the temperatures between weather stations using data from the closest stations, a process called interpolation. Quantifying the statistical uncertainty present in those estimates helped researchers to be confident that the interpolation was accurate.
“Uncertainty is important to understand because we know that in the real world we don’t know everything perfectly,” said Gavin Schmidt, director of GISS and a co-author on the study. “All science is based on knowing the limitations of the numbers that you come up with, and those uncertainties can determine whether what you’re seeing is a shift or a change that is actually important.”
The study found that individual and systematic changes in measuring temperature over time were the most significant source of uncertainty. Also contributing was the degree of weather station coverage. Data interpolation between stations contributed some uncertainty, as did the process of standardizing data that was collected with different methods at different points in history.
After adding these components together, GISTEMP’s uncertainty value in recent years was still less than a tenth of a degree Fahrenheit, which is “very small,” Schmidt said.
The team used the updated model to reaffirm that 2016 was very probably the warmest year in the record, with an 86.2 percent likelihood. The next most likely candidate for warmest year on record was 2017, with a 12.5 percent probability.
“We’ve made the uncertainty quantification more rigorous, and the conclusion to come out of the study was that we can have confidence in the accuracy of our global temperature series,” said lead author Nathan Lenssen, a doctoral student at Columbia University. “We don’t have to restate any conclusions based on this analysis.”
Another recent study evaluated GISTEMP in a different way that also added confidence to its estimate of long-term warming. A paper published in March 2019, led by Joel Susskind of NASA's Goddard Space Flight Center, compared GISTEMP data with that of the Atmospheric Infrared Sounder (AIRS), onboard NASA's Aqua satellite.
GISTEMP uses air temperature recorded with thermometers slightly above the ground or sea, while AIRS uses infrared sensing to measure the temperature right at the Earth's surface (or “skin temperature”) from space. The AIRS record of temperature change since 2003 (which begins when Aqua launched) closely matched the GISTEMP record.
Comparing two measurements that were similar but recorded in very different ways ensured that they were independent of each other, Schmidt said. One difference was that AIRS showed more warming in the northernmost latitudes.
“The Arctic is one of the places we already detected was warming the most. The AIRS data suggests that it’s warming even faster than we thought,” said Schmidt, who was also a co-author on the Susskind paper.
Taken together, Schmidt said, the two studies help establish GISTEMP as a reliable index for current and future climate research.
“Each of those is a way in which you can try and provide evidence that what you’re doing is real,” Schmidt said. “We’re testing the robustness of the method itself, the robustness of the assumptions, and of the final result against a totally independent data set.”
In all cases, he said, the resulting trends are more robust than what can be accounted for by any uncertainty in the data or methods.
Access the paper here.
New Studies Increase Confidence in NASA's Measure of Earth's Temperature
By Jessica Merzdorf,
NASA's Goddard Space Flight Center
Earth’s long-term warming trend can be seen in this visualization of NASA’s global temperature record, which shows how the planet’s temperatures are changing over time, compared to a baseline average from 1951 to 1980. The record is shown as a running five-year average. Credit: NASA’s Scientific Visualization Studio/Kathryn Mersmann. Download related visualizations here.
A new assessment of NASA's record of global temperatures revealed that the agency's estimate of Earth's long-term temperature rise in recent decades is accurate to within less than a tenth of a degree Fahrenheit, providing confidence that past and future research is correctly capturing rising surface temperatures.
The most complete assessment ever of statistical uncertainty within the GISS Surface Temperature Analysis (GISTEMP) data product shows that the annual values are likely accurate to within 0.09 degrees Fahrenheit (0.05 degrees Celsius) in recent decades, and 0.27 degrees Fahrenheit (0.15 degrees C) at the beginning of the nearly 140-year record.
This data record, maintained by NASA’s Goddard Institute for Space Studies (GISS) in New York City, is one of a handful kept by major science institutions around the world that track Earth's temperature and how it has risen in recent decades. This global temperature record has provided one of the most direct benchmarks of how our home planet's climate has changed as greenhouse gas concentrations rise.
The study also confirms what researchers have been saying for some time now: that Earth's global temperature increase since 1880 – about 2 degrees Fahrenheit, or a little more than 1 degree Celsius – cannot be explained by any uncertainty or error in the data. Going forward, this assessment will give scientists the tools to explain their results with greater confidence.
GISTEMP is a widely used index of global mean surface temperature anomaly — it shows how much warmer or cooler than normal Earth’s surface is in a given year. "Normal" is defined as the average during a baseline period of 1951-80.
NASA uses GISTEMP in its annual global temperature update, in partnership with the National Oceanic and Atmospheric Administration. (In 2019, NASA and NOAA found that 2018 was the fourth-warmest year on record, with 2016 holding the top spot.) The index includes land and sea surface temperature data back to 1880, and today incorporates measurements from 6,300 weather stations, research stations, ships and buoys around the world.
Previously, GISTEMP provided an estimate of uncertainty accounting for the spatial gaps between weather stations. Like other surface temperature records, GISTEMP estimates the temperatures between weather stations using data from the closest stations, a process called interpolation. Quantifying the statistical uncertainty present in those estimates helped researchers to be confident that the interpolation was accurate.
“Uncertainty is important to understand because we know that in the real world we don’t know everything perfectly,” said Gavin Schmidt, director of GISS and a co-author on the study. “All science is based on knowing the limitations of the numbers that you come up with, and those uncertainties can determine whether what you’re seeing is a shift or a change that is actually important.”
The study found that individual and systematic changes in measuring temperature over time were the most significant source of uncertainty. Also contributing was the degree of weather station coverage. Data interpolation between stations contributed some uncertainty, as did the process of standardizing data that was collected with different methods at different points in history.
After adding these components together, GISTEMP’s uncertainty value in recent years was still less than a tenth of a degree Fahrenheit, which is “very small,” Schmidt said.
The team used the updated model to reaffirm that 2016 was very probably the warmest year in the record, with an 86.2 percent likelihood. The next most likely candidate for warmest year on record was 2017, with a 12.5 percent probability.
“We’ve made the uncertainty quantification more rigorous, and the conclusion to come out of the study was that we can have confidence in the accuracy of our global temperature series,” said lead author Nathan Lenssen, a doctoral student at Columbia University. “We don’t have to restate any conclusions based on this analysis.”
Another recent study evaluated GISTEMP in a different way that also added confidence to its estimate of long-term warming. A paper published in March 2019, led by Joel Susskind of NASA's Goddard Space Flight Center, compared GISTEMP data with that of the Atmospheric Infrared Sounder (AIRS), onboard NASA's Aqua satellite.
GISTEMP uses air temperature recorded with thermometers slightly above the ground or sea, while AIRS uses infrared sensing to measure the temperature right at the Earth's surface (or “skin temperature”) from space. The AIRS record of temperature change since 2003 (which begins when Aqua launched) closely matched the GISTEMP record.
Comparing two measurements that were similar but recorded in very different ways ensured that they were independent of each other, Schmidt said. One difference was that AIRS showed more warming in the northernmost latitudes.
“The Arctic is one of the places we already detected was warming the most. The AIRS data suggests that it’s warming even faster than we thought,” said Schmidt, who was also a co-author on the Susskind paper.
Taken together, Schmidt said, the two studies help establish GISTEMP as a reliable index for current and future climate research.
“Each of those is a way in which you can try and provide evidence that what you’re doing is real,” Schmidt said. “We’re testing the robustness of the method itself, the robustness of the assumptions, and of the final result against a totally independent data set.”
In all cases, he said, the resulting trends are more robust than what can be accounted for by any uncertainty in the data or methods.
Access the paper here.
April 13, 2019
2018: United-States

Energy Flow Diagrams
https://flowcharts.llnl.gov/commodities/energy2018: United-States
February 6, 2019
2018 Fourth Warmest Year in Continued Warming Trend, According to NASA, NOAA
(Please note, NASA press release—Copyright concerns are nil.)
https://www.nasa.gov/press-release/2018-fourth-warmest-year-in-continued-warming-trend-according-to-nasa-noaa
Feb. 6, 2019
RELEASE 19-002
2018 Fourth Warmest Year in Continued Warming Trend, According to NASA, NOAA
Earth's global surface temperatures in 2018 were the fourth warmest since 1880, according to independent analyses by NASA and the National Oceanic and Atmospheric Administration (NOAA).
Global temperatures in 2018 were 1.5 degrees Fahrenheit (0.83 degrees Celsius) warmer than the 1951 to 1980 mean, according to scientists at NASA’s Goddard Institute for Space Studies (GISS) in New York. Globally, 2018's temperatures rank behind those of 2016, 2017 and 2015. The past five years are, collectively, the warmest years in the modern record.
“2018 is yet again an extremely warm year on top of a long-term global warming trend,” said GISS Director Gavin Schmidt.
Since the 1880s, the average global surface temperature has risen about 2 degrees Fahrenheit (1 degree Celsius). This warming has been driven in large part by increased emissions into the atmosphere of carbon dioxide and other greenhouse gases caused by human activities, according to Schmidt.
Weather dynamics often affect regional temperatures, so not every region on Earth experienced similar amounts of warming. NOAA found the 2018 annual mean temperature for the contiguous 48 United States was the 14th warmest on record.
Warming trends are strongest in the Arctic region, where 2018 saw the continued loss of sea ice. In addition, mass loss from the Greenland and Antarctic ice sheets continued to contribute to sea level rise. Increasing temperatures can also contribute to longer fire seasons and some extreme weather events, according to Schmidt.
“The impacts of long-term global warming are already being felt — in coastal flooding, heat waves, intense precipitation and ecosystem change,” said Schmidt.
NASA’s temperature analyses incorporate surface temperature measurements from 6,300 weather stations, ship- and buoy-based observations of sea surface temperatures, and temperature measurements from Antarctic research stations.
These raw measurements are analyzed using an algorithm that considers the varied spacing of temperature stations around the globe and urban heat island effects that could skew the conclusions. These calculations produce the global average temperature deviations from the baseline period of 1951 to 1980.
Because weather station locations and measurement practices change over time, the interpretation of specific year-to-year global mean temperature differences has some uncertainties. Taking this into account, NASA estimates that 2018’s global mean change is accurate to within 0.1 degree Fahrenheit, with a 95 percent certainty level.
NOAA scientists used much of the same raw temperature data, but with a different baseline period and different interpolation into the Earth’s polar and other data poor regions. NOAA’s analysis found 2018 global temperatures were 1.42 degrees Fahrenheit (0.79 degrees Celsius) above the 20th century average.
NASA’s full 2018 surface temperature data set — and the complete methodology used to make the temperature calculation — are available at:
https://data.giss.nasa.gov/gistemp
GISS is a laboratory within the Earth Sciences Division of NASA’s Goddard Space Flight Center in Greenbelt, Maryland. The laboratory is affiliated with Columbia University’s Earth Institute and School of Engineering and Applied Science in New York.
NASA uses the unique vantage point of space to better understand Earth as an interconnected system. The agency also uses airborne and ground-based monitoring, and develops new ways to observe and study Earth with long-term data records and computer analysis tools to better see how our planet is changing. NASA shares this knowledge with the global community and works with institutions in the United States and around the world that contribute to understanding and protecting our home planet.
For more information about NASA’s Earth science missions, visit:
https://www.nasa.gov/earth
The slides for the Feb. 6 news conference are available at:
https://www.nasa.gov/sites/default/files/atoms/files/noaa-nasa_global_analysis-2018-final_feb6.pdf
NOAA’s Global Report is available at:
http://bit.ly/Global201812
-end-
Steve Cole
Headquarters, Washington
202-358-0918
stephen.e.cole@nasa.gov
Last Updated: Feb. 6, 2019
Editor: Sean Potter
RELEASE 19-002
2018 Fourth Warmest Year in Continued Warming Trend, According to NASA, NOAA
Earth's global surface temperatures in 2018 were the fourth warmest since 1880, according to independent analyses by NASA and the National Oceanic and Atmospheric Administration (NOAA).
Global temperatures in 2018 were 1.5 degrees Fahrenheit (0.83 degrees Celsius) warmer than the 1951 to 1980 mean, according to scientists at NASA’s Goddard Institute for Space Studies (GISS) in New York. Globally, 2018's temperatures rank behind those of 2016, 2017 and 2015. The past five years are, collectively, the warmest years in the modern record.
“2018 is yet again an extremely warm year on top of a long-term global warming trend,” said GISS Director Gavin Schmidt.
Since the 1880s, the average global surface temperature has risen about 2 degrees Fahrenheit (1 degree Celsius). This warming has been driven in large part by increased emissions into the atmosphere of carbon dioxide and other greenhouse gases caused by human activities, according to Schmidt.
Earth’s long-term warming trend can be seen in this visualization of NASA’s global temperature record, which shows how the planet’s temperatures are changing over time, compared to a baseline average from 1951 to 1980. The record is shown as a running five-year average.
Credits: NASA’s Scientific Visualization Studio/Kathryn Mersmann
Download high-definition video and still imagery here.
Weather dynamics often affect regional temperatures, so not every region on Earth experienced similar amounts of warming. NOAA found the 2018 annual mean temperature for the contiguous 48 United States was the 14th warmest on record.
Warming trends are strongest in the Arctic region, where 2018 saw the continued loss of sea ice. In addition, mass loss from the Greenland and Antarctic ice sheets continued to contribute to sea level rise. Increasing temperatures can also contribute to longer fire seasons and some extreme weather events, according to Schmidt.
“The impacts of long-term global warming are already being felt — in coastal flooding, heat waves, intense precipitation and ecosystem change,” said Schmidt.
NASA’s temperature analyses incorporate surface temperature measurements from 6,300 weather stations, ship- and buoy-based observations of sea surface temperatures, and temperature measurements from Antarctic research stations.
This line plot shows yearly temperature anomalies from 1880 to 2018, with respect to the 1951-1980 mean, as recorded by NASA, NOAA, the Japan Meteorological Agency, the Berkeley Earth research group, and the Met Office Hadley Centre (UK). Though there are minor variations from year to year, all five temperature records show peaks and valleys in sync with each other. All show rapid warming in the past few decades, and all show the past decade has been the warmest.
Credits: NASA’s Earth Observatory

These raw measurements are analyzed using an algorithm that considers the varied spacing of temperature stations around the globe and urban heat island effects that could skew the conclusions. These calculations produce the global average temperature deviations from the baseline period of 1951 to 1980.
Because weather station locations and measurement practices change over time, the interpretation of specific year-to-year global mean temperature differences has some uncertainties. Taking this into account, NASA estimates that 2018’s global mean change is accurate to within 0.1 degree Fahrenheit, with a 95 percent certainty level.
NOAA scientists used much of the same raw temperature data, but with a different baseline period and different interpolation into the Earth’s polar and other data poor regions. NOAA’s analysis found 2018 global temperatures were 1.42 degrees Fahrenheit (0.79 degrees Celsius) above the 20th century average.
NASA’s full 2018 surface temperature data set — and the complete methodology used to make the temperature calculation — are available at:
https://data.giss.nasa.gov/gistemp
GISS is a laboratory within the Earth Sciences Division of NASA’s Goddard Space Flight Center in Greenbelt, Maryland. The laboratory is affiliated with Columbia University’s Earth Institute and School of Engineering and Applied Science in New York.
NASA uses the unique vantage point of space to better understand Earth as an interconnected system. The agency also uses airborne and ground-based monitoring, and develops new ways to observe and study Earth with long-term data records and computer analysis tools to better see how our planet is changing. NASA shares this knowledge with the global community and works with institutions in the United States and around the world that contribute to understanding and protecting our home planet.
For more information about NASA’s Earth science missions, visit:
https://www.nasa.gov/earth
The slides for the Feb. 6 news conference are available at:
https://www.nasa.gov/sites/default/files/atoms/files/noaa-nasa_global_analysis-2018-final_feb6.pdf
NOAA’s Global Report is available at:
http://bit.ly/Global201812
-end-
Steve Cole
Headquarters, Washington
202-358-0918
stephen.e.cole@nasa.gov
Last Updated: Feb. 6, 2019
Editor: Sean Potter
February 6, 2019
Diffusing the methane bomb: We can still make a difference
http://www.iiasa.ac.at/web/home/about/news/190206-Tundra-methane.html06 February 2019
Diffusing the methane bomb: We can still make a difference
The Arctic is warming twice as fast as the rest of the planet, causing the carbon containing permafrost that has been frozen for tens or hundreds of thousands of years to thaw and release methane into the atmosphere, thereby contributing to global warming. The findings of a study that included researchers from IIASA, however, suggest that it is still possible to neutralize this threat
…
In their analysis, the researchers quantified the upper range value for natural methane emissions that can be released from the Arctic tundra, as it allows it to be put in relation to the much larger release of methane emissions from human activities. Although estimates of the release of methane from natural sources in the Arctic and estimates of methane from human activity have been presented separately in previous studies, this is the first time that the relative contribution of the two sources to global warming has been quantified and compared.
…
According to the researchers, their findings confirm the urgency of a transition away from a fossil fuel based society as well as the importance of reducing methane emissions from other sources, in particular livestock and waste. The results indicate that man-made emissions can be reduced sufficiently to limit methane-caused climate warming by 2100 even in the case of an uncontrolled natural Arctic methane emission feedback. This will however require a committed, global effort towards substantial, but feasible reductions.
“In essence, we want to convey the message that the release of methane from human activities is something we can do something about, especially since the technology for drastic reductions is readily available - often even at a low cost. If we can only get the human emissions under control, the natural emissions should not have to be of major concern,” concludes Höglund-Isaksson.
…
https://dx.doi.org/10.1038/s41598-018-37719-9
Diffusing the methane bomb: We can still make a difference
The Arctic is warming twice as fast as the rest of the planet, causing the carbon containing permafrost that has been frozen for tens or hundreds of thousands of years to thaw and release methane into the atmosphere, thereby contributing to global warming. The findings of a study that included researchers from IIASA, however, suggest that it is still possible to neutralize this threat
…
In their analysis, the researchers quantified the upper range value for natural methane emissions that can be released from the Arctic tundra, as it allows it to be put in relation to the much larger release of methane emissions from human activities. Although estimates of the release of methane from natural sources in the Arctic and estimates of methane from human activity have been presented separately in previous studies, this is the first time that the relative contribution of the two sources to global warming has been quantified and compared.
…
According to the researchers, their findings confirm the urgency of a transition away from a fossil fuel based society as well as the importance of reducing methane emissions from other sources, in particular livestock and waste. The results indicate that man-made emissions can be reduced sufficiently to limit methane-caused climate warming by 2100 even in the case of an uncontrolled natural Arctic methane emission feedback. This will however require a committed, global effort towards substantial, but feasible reductions.
“In essence, we want to convey the message that the release of methane from human activities is something we can do something about, especially since the technology for drastic reductions is readily available - often even at a low cost. If we can only get the human emissions under control, the natural emissions should not have to be of major concern,” concludes Höglund-Isaksson.
…
Profile Information
Member since: Mon Mar 6, 2006, 04:51 PMNumber of posts: 19,938