OKIsItJustMe
OKIsItJustMe's Journal2025 Global Temperature - James Hansen and Pushker Kharecha - 15 April 2025
https://www.columbia.edu/~jeh1/mailings/2025/2025GlobalTemperature.15April2025.pdf
2025 Global Temperature
James Hansen and Pushker Kharecha. 15 April 2025
Abstract. Global temperature for 2025 should decline little, if at all, from the record 2024 level. Absence of a large temperature decline after the huge El Nino-spurred temperature increase in 2023-24 will provide further confirmation that IPCC’s best estimates for climate sensitivity and aerosol climate forcing were both underestimates. Specifically, 2025 global temperature should remain near or above +1.5C relative to 1880-1920, and, if the tropics remain ENSO-neutral, there is good chance that 2025 may even exceed the 2024 record high global temperature.
Global temperature in February and March 2025 fell below the record highs for those months in 2024 (Fig. 1) and such relative decline is likely in most of the next few months. However, the decline has been modest and the 2024 vs 2025 ranks of several months later in the year might be reversed.
Expectation of continuing global temperature change is aided by understanding of the accelerated global warming that began in about 2015. As noted in our “Acceleration” paper, ² the leap of global temperature in 2023-24, in part, had an earlier origin. Interpretations of the 2023 warming are bookended by Raghuraman et al. ³ and Schmidt. ⁴ Raghuraman et al. conclude that the 2023 warming is explained by the El Nino, while Schmidt concludes that the extreme warming cannot be explained by even the full array of mechanisms in global models. Raghuraman et al. note that the 2023 El Nino rose from a deep La Nina, so, despite the El Nino being modest, the Nino4.4 (equatorial Pacific temperature used to characterize El Nino status) change may be sufficient to explain the extreme 2023-24 warming. Here, based on the Acceleration paper, we show that the El Nino accounts for only about half of the 2023-24 warming, and thus Schmidt is partially right: something else important is occurring.
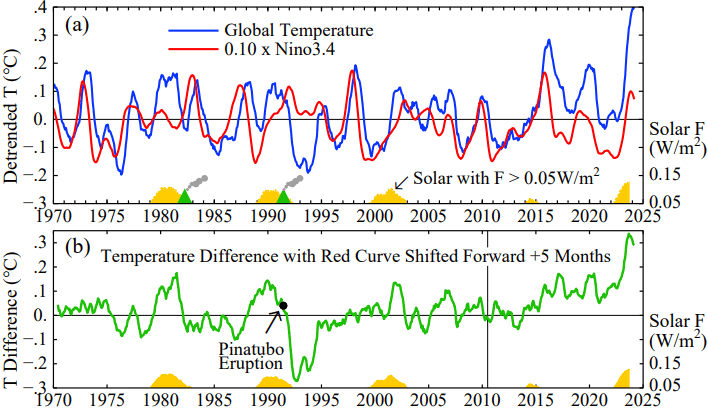
We first (Fig. 2a) remove the long-term trend of global temperature (0.18°C per decade) by subtracting it from the global temperature record since 1970. (The long-term trend is caused by the net greenhouse gas plus aerosol forcing.) What remains is the blue curve in Fig. 2a, which is global temperature change due to other forcings and natural variability. The main source of natural variability is the tropical El Nino cycle, shown by the temperature anomaly in the tropical Nino3.4 region (red curve). Thus, as a second step, we subtract the El Nino variability from the blue curve, ⁵ obtaining the green curve in Fig. 2b. Fingerprints of climate forcings are apparent in the green curve. Most obvious is the 0.3°C global cooling caused by the Pinatubo volcanic eruption, but even the maxima of solar irradiance (a forcing of only ± 0.12 W/m²) cause detectable warmings consistent with prior analyses.⁶
Figure 2. Detrended global and Nino3.4 temperatures (°C) and difference⁷
…
James Hansen and Pushker Kharecha - The Acid Test: Global Temperature in 2025
https://www.columbia.edu/~jeh1/mailings/2025/Acid.Test.20Feb2025.pdf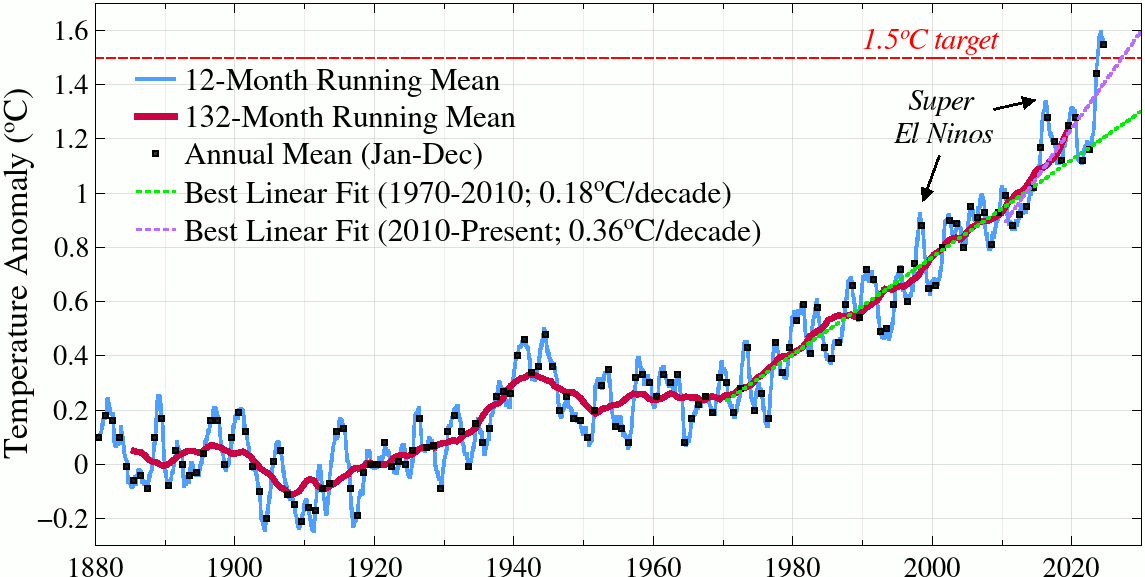
The Acid Test: Global Temperature in 2025
James Hansen and Pushker Kharecha 20 February 2025
The unprecedented leap of global temperature in 2023 and early 2024 exceeded 0.4°C (Fig. 1). We and coauthors² interpret that uniquely large warming as being due about equally to a moderate El Nino and reduction of ship aerosols, with a smaller contribution from the present solar maximum (our entire paper, including Abstract & Supplementary Material is available in a single compressed PDF here). An “acid” test of our interpretation will be provided by the 2025 global temperature: unlike the 1997-98 and 2015-16 El Ninos, which were followed by global cooling of more than 0.3°C and 0.2°C, respectively, we expect global temperature in 2025 to remain near or above the 1.5°C level. Indeed, the 2025 might even set a new record despite the present weak La Nina. There are two independent reasons. First, the “new” climate forcing due to reduction of sulfate aerosols over the ocean remains in place, and, second, high climate sensitivity (~4.5°C for doubled CO₂ ) implies that the warming from recently added forcings is still growing significantly.
The impact of high climate sensitivity warrants clarification. High climate sensitivity implies a large contribution from amplifying feedbacks: water vapor, surface albedo (sea ice/snow) and clouds. The feedbacks do not come into play immediately in response to a climate forcing, but rather in response to the global warming caused by the forcing. That warming takes time, and it takes longer for higher sensitivity.³ Thus, response to a forcing in the first few years depends little on climate sensitivity, as shown by the response functions for three climate sensitivities (Fig. 2); early response is due mainly to the forcing itself, not feedbacks. But as temperature change grows, feedbacks come into play and are the main cause of the continued, growing, response.a The relevant point here is that feedbacks stretch out the response time, so, within a decade or two, higher climate sensitivity yields a significantly greater response. If climate sensitivity is 3°C or less, the rapid, early, response to the ship aerosol forcing introduced in 2020 is complete in 2025, but if climate sensitivity is high, there is still substantial “juice” in the aerosol forcing change, which can thus offset tropical cooling.ᵇ
Figure 2. Global Temperature Response to 2×CO₂
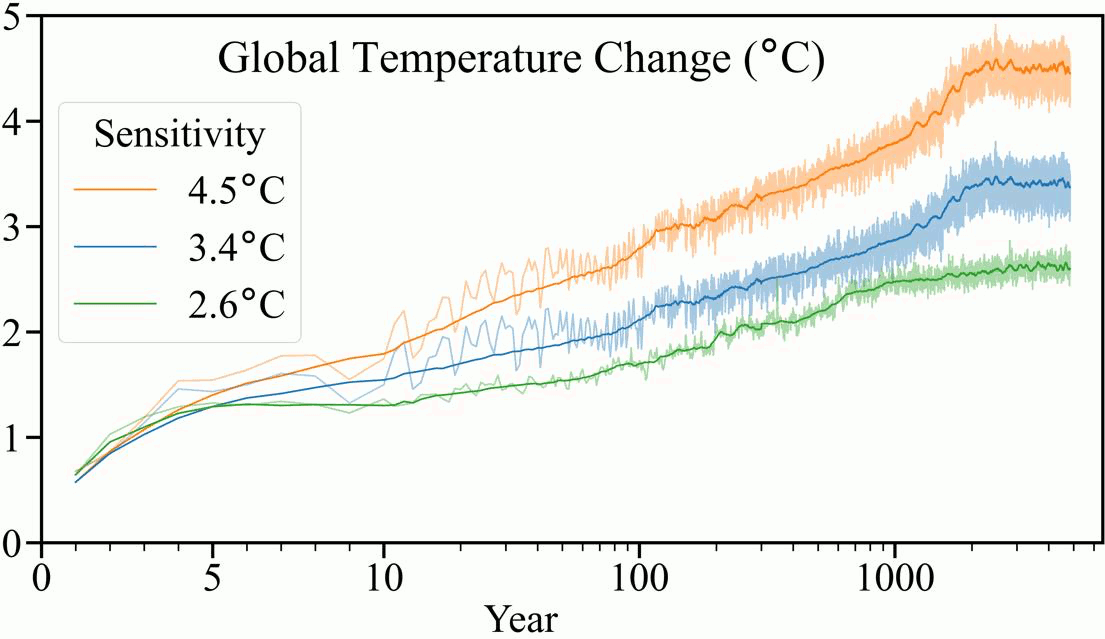
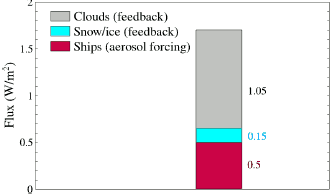
Why are we confident that climate sensitivity is high? We have shown that in three independent ways: (1) climate sensitivity 4.8°C ± 0.6°C (1𝜎 ) based on comparison of glacial and interglacial climate states,4 (2) sensitivity of 4.5°C ± 0.5°C (1𝜎 ) based on temperature from 1750 through 2024,² (3) the large “darkening” (reduced albedo) of Earth between 2000 and 2024, which implies a strong cloud feedback (Fig. 3) – and strong cloud feedback implies high climate sensitivity.²
Figure 3. Contributions to Reduced Earth Albedo
…
Reuters: US power system becomes more fossil-dependent than China's
https://www.reuters.com/business/energy/us-power-system-becomes-more-fossil-dependent-than-chinas-maguire-2024-10-25/By Gavin Maguire
October 25, 2024 1:13 PM EDT
Commentary
By Gavin Maguire
LITTLETON, Colorado, Oct 25 (Reuters) - Utilities in the United States have relied on fossil fuels to generate a larger share of electricity than their counterparts in China since June, seriously undermining U.S. claims to be a leader in energy transition efforts.
U.S. utilities have relied on fossil fuels to generate an average of 62.4% of total electricity production for the past four months, according to data from energy think tank Ember.
That fossil fuel share exceeds the 60.5% over the same period in China, the world's largest power producer and polluter.

China vs USA share of electricity generation from clean & fossil fuels
The high U.S. fossil dependence came during the summer when domestic power demand is highest due to air conditioner use, while China's relatively lower fossil reliance has occurred during a protracted economic slowdown.
…
James Hansen et al: Reflections on Time Scales and Butterflies
https://www.columbia.edu/~jeh1/mailings/2024/Reflections.2024.07.12.pdf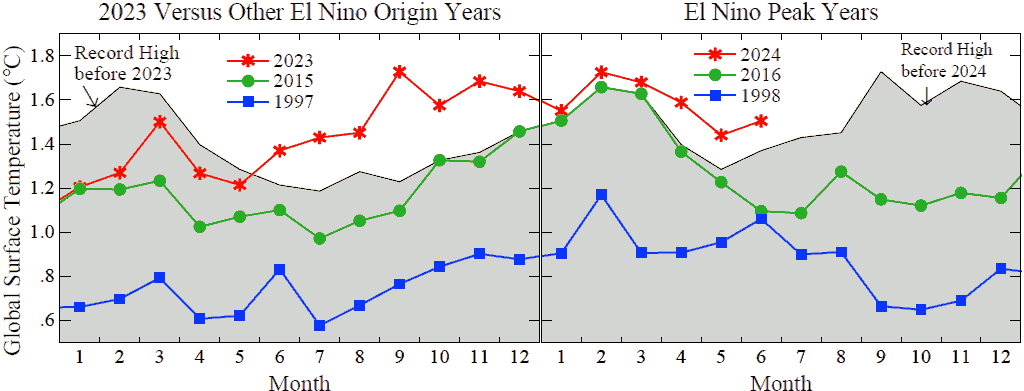
Fig. 1. Global temperature relative to 1880-1920 based on the GISS analysis.¹ ²
Reflections on Time Scales and Butterflies
12 July 2024
James Hansen, Makiko Sato, Pushker Kharecha
Abstract. Breathless reporting on when the present global heat anomaly will begin to fall is understandable, given heat suffering around the world. However, fundamental issues are in question and a reflection on time scales is in order, for the sake of understanding ongoing climate change and actions that need to be taken.
June was the 13 th consecutive record monthly global temperature (Fig. 1). The changing gap between this current string and prior records is revealing. The gap is smallest in Northern Hemisphere winter, the months when a strong El Nino gives global temperature the biggest kick, consistent with direct evidence that the recent El Nino was far from a super El Nino. Thus, more than the recent modest El Nino is needed to explain the uniquely large rise of temperature in the past year (Fig. 2).
Reanalyses (computer simulations of global weather post facto, using available observations) show that the first week of July this year was cooler than in 2023 (Fig. 3). Nevertheless, we suggest caution in predictions about July and August for Fig. 1. Almost a dead-heat (sorry, no pun intended) with the 2023 July and August records is possible, even likely. In September, global temperature surely will fall well below the unusually-high September record (Fig. 1); with that, the 12-month running-mean global temperature (Fig. 2) will decline noticeably.
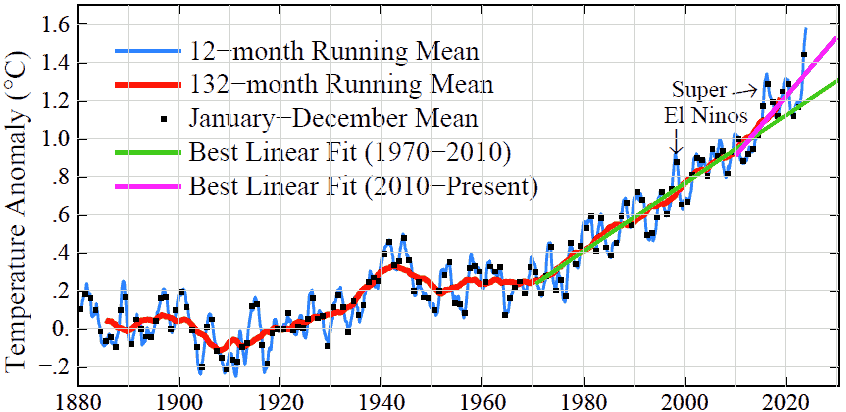
Fig. 2. Global temperature relative to 1880-1920 based on the GISS analysis. Warming rate is 0.18°C/decade for 1970-2010, 0.32°C/decade for 2010-present.
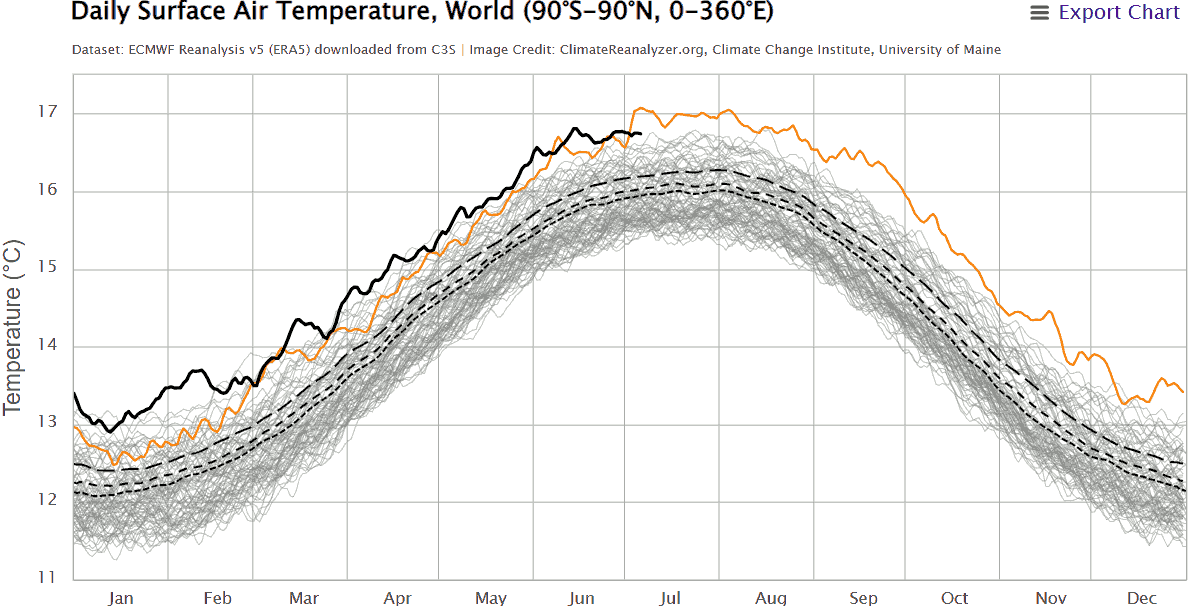
Fig. 3. Global surface air temperature from ECMWF reanalysis, provided by Univ. of Maine.³
Tropical surface air temperature (Fig. 4) during the next few months is expected to fall below its El Nino-enhanced 2023 value – but how far below? Sea surface temperature (SST) is a less “noisy,” powerful, climate diagnostic because it serves as a measure of the entire depth of the ocean surface “mixed layer,” which is well-mixed almost daily by winds. The mixed layer accumulates effects of all the forcings at the ocean surface, capturing effects 24/7/365, not only at the moments of satellite sampling. Thus, SST reduces effects of weather noise, cloud variability, and sampling biases in satellite observations.
Global SST (Fig. 5) reveals the huge warming in the transition from La Nina at the beginning of 2023 to El Nino by mid-2023, exceeding the SST warming in even the strongest El Ninos. The magnitude and stability of the warming imply the need for a substantial mechanism(s) in addition to the El Nino, especially given the modest strength of the El Nino. Our suggestion4 for a large component of this additional forcing is aerosol forcing that grew especially during the 2020s. A sharp increase of aerosol forcing is expected in January 2020 due to regulations on sulphates in ship fuels. Aerosol forcing occurs mainly via effects on clouds that are highly nonlinear, being most effective in less-polluted air; thus, ship aerosols have a substantial impact, even though the ship portion of total human-made aerosols is small.
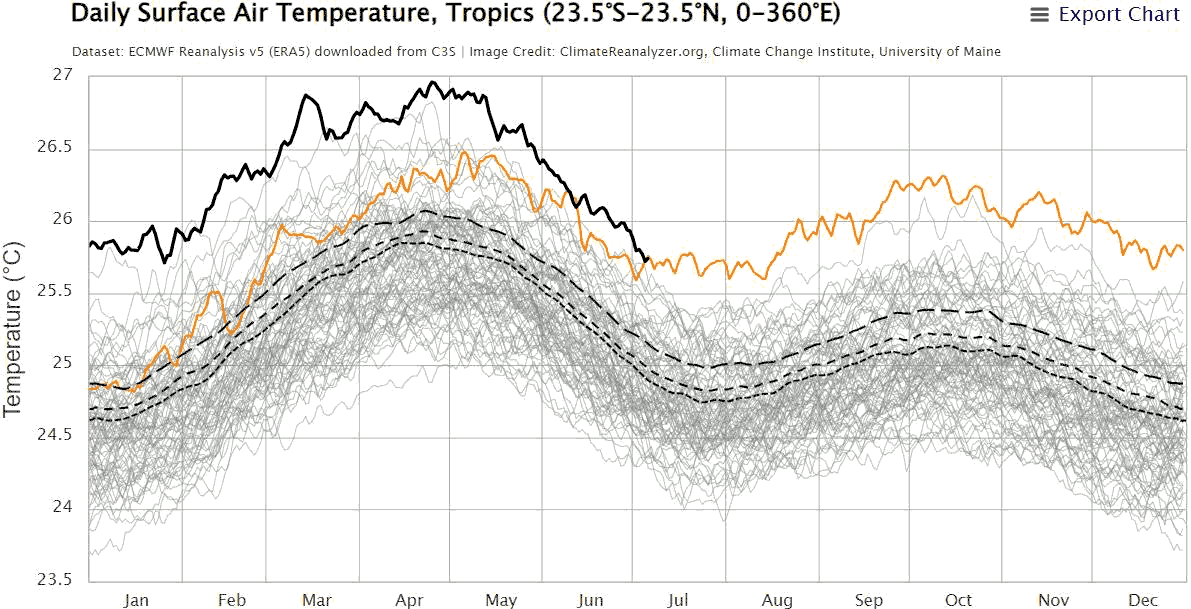
Fig. 4. Tropical surface air temperature from ECMWF reanalysis, provided by Univ. of Maine.
…
¹ Lenssen NJL, Schmidt GA, Hansen JE et al. Improvements in the GISTEMP uncertainty model, J Geophys Res Atmos 124(12), 6307-26, 2019
² Hansen J, Ruedy R, Sato M et al. Global surface temperature change. Rev Geophys 48:RG4004, 2010
³ This ECMWF reanalysis graphic is provided by the Climate Change Institute, University of Maine.
…
James Hansen et al: Ice melt, sea level rise and superstorms: evidence from paleoclimate data, climate modeling, and...
https://acp.copernicus.org/articles/16/3761/2016/acp-16-3761-2016.pdfwww.atmos-chem-phys.net/16/3761/2016/
doi:10.5194/acp-16-3761-2016
© Author(s) 2016. CC Attribution 3.0 License.
Ice melt, sea level rise and superstorms: evidence from paleoclimate data, climate modeling, and modern observations that 2 °C global warming could be dangerous
…
Received: 11 June 2015 – Published in Atmos. Chem. Phys. Discuss.: 23 July 2015
Revised: 17 February 2016 – Accepted: 18 February 2016 – Published: 22 March 2016
Abstract. We use numerical climate simulations, paleoclimate data, and modern observations to study the effect of growing ice melt from Antarctica and Greenland. Meltwater tends to stabilize the ocean column, inducing amplifying feedbacks that increase subsurface ocean warming and ice shelf melting. Cold meltwater and induced dynamical effects cause ocean surface cooling in the Southern Ocean and North Atlantic, thus increasing Earth’s energy imbalance and heat flux into most of the global ocean’s surface. Southern Ocean surface cooling, while lower latitudes are warming, increases precipitation on the Southern Ocean, increasing ocean stratification, slowing deepwater formation, and increasing ice sheet mass loss. These feedbacks make ice sheets in contact with the ocean vulnerable to accelerating disintegration. We hypothesize that ice mass loss from the most vulnerable ice, sufficient to raise sea level several meters, is better approximated as exponential than by a more linear response. Doubling times of 10, 20 or 40 years yield multi-meter sea level rise in about 50, 100 or 200 years. Recent ice melt doubling times are near the lower end of the 10–40-year range, but the record is too short to confirm the nature of the response. The feedbacks, including subsurface ocean warming, help explain paleoclimate data and point to a dominant Southern Ocean role in controlling atmospheric CO₂, which in turn exercised tight control on global temperature and sea level. The millennial (500–2000-year) timescale of deep-ocean ventilation affects the timescale for natural CO₂, change and thus the timescale for paleo-global climate, ice sheet, and sea level changes, but this paleo-millennial timescale should not be misinterpreted as the timescale for ice sheet response to a rapid, large, human-made climate forcing. These climate feedbacks aid interpretation of events late in the prior interglacial, when sea level rose to +6–9 m with evidence of extreme storms while Earth was less than 1 ◦C warmer than today. Ice melt cooling of the North Atlantic and Southern oceans increases atmospheric temperature gradients, eddy kinetic energy and baroclinicity, thus driving more powerful storms. The modeling, paleoclimate evidence, and ongoing observations together imply that 2 °C global warming above the preindustrial level could be dangerous. Continued high fossil fuel emissions this century are predicted to yield (1) cooling of the Southern Ocean, especially in the Western Hemisphere; (2) slowing of the Southern Ocean overturning circulation, warming of the ice shelves, and growing ice sheet mass loss; (3) slowdown and eventual shutdown of the Atlantic overturning circulation with cooling of the North Atlantic region; (4) increasingly powerful storms; and (5) non-linearly growing sea level rise, reaching several meters over a timescale of 50–150 years. These predictions, especially the cooling in the Southern Ocean and North Atlantic with markedly reduced warming or even cooling in Europe, differ fundamentally from existing climate change assessments. We discuss observations and modeling studies needed to refute or clarify these assertions.
1 Introduction
Humanity is rapidly extracting and burning fossil fuels without full understanding of the consequences. Current assessments place emphasis on practical effects such as increasing extremes of heat waves, droughts, heavy rainfall, floods, and encroaching seas (IPCC, 2014; USNCA, 2014). These assessments and our recent study (Hansen et al., 2013a) conclude that there is an urgency to slow carbon dioxide (CO₂ ) emissions, because the longevity of the carbon in the climate system (Archer, 2005) and persistence of the induced warming (Solomon et al., 2010) may lock in unavoidable, highly undesirable consequences.
Despite these warnings, fossil fuels remain the world’s primary energy source and global CO₂ emissions continue at a high level, perhaps with an expectation that humanity can adapt to climate change and find ways to minimize effects via advanced technologies. We suggest that this viewpoint fails to appreciate the nature of the threat posed by ice sheet instability and sea level rise. If the ocean continues to accumulate heat and increase melting of marine-terminating ice shelves of Antarctica and Greenland, a point will be reached at which it is impossible to avoid large-scale ice sheet disintegration with sea level rise of at least several meters. The economic and social cost of losing functionality of all coastal cities is practically incalculable. We suggest that a strategy relying on adaptation to such consequences will be unacceptable to most of humanity, so it is important to understand this threat as soon as possible.
We investigate the climate threat using a combination of atmosphere–ocean modeling, information from paleoclimate data, and observations of ongoing climate change. Each of these has limitations: modeling is an imperfect representation of the climate system, paleo-data consist mainly of proxy climate information usually with substantial ambiguities, and modern observations are limited in scope and accuracy. However, with the help of a large body of research by the scientific community, it is possible to draw meaningful conclusions.
…
CNN Opinion: I'm a climate scientist. If you knew what I know, you'd be terrified too
https://www.cnn.com/2024/03/07/opinions/climate-scientist-scare-doom-anxiety-mcguire/index.htmlOpinion by Bill McGuire
4 minute read — Updated 9:56 AM EST, Thu March 7, 2024
Editor’s Note: Editor’s Note: Bill McGuire is professor emeritus of geophysical & climate hazards at University College London and author of “Hothouse Earth: An Inhabitant’s Guide.” The views expressed in this commentary are his own. Read more CNN opinion here.
CNN
—
Are you frightened by climate change? Do you worry about what sort of world we are bequeathing to our children and grandchildren? In the words of science writer and author of “The Uninhabitable Earth” David Wallace-Wells, “No matter how well informed you are, you are surely not alarmed enough.”
I would put it even more strongly.
If the fracturing of our once stable climate doesn’t terrify you, then you don’t fully understand it. The reality is that, as far as we know, and in the natural course of events, our world has never — in its entire history — heated up as rapidly as it is doing now. Nor have greenhouse gas levels in the atmosphere ever seen such a precipitous hike.
…
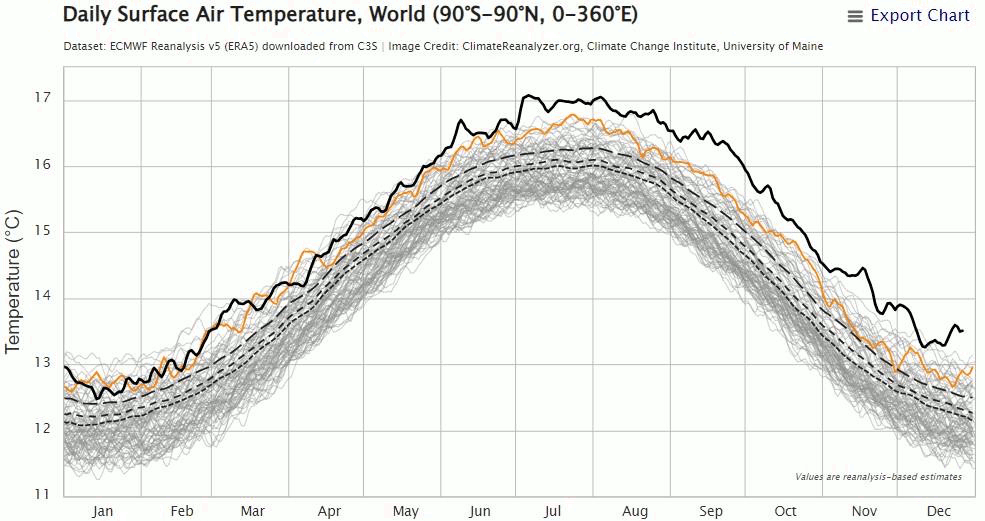
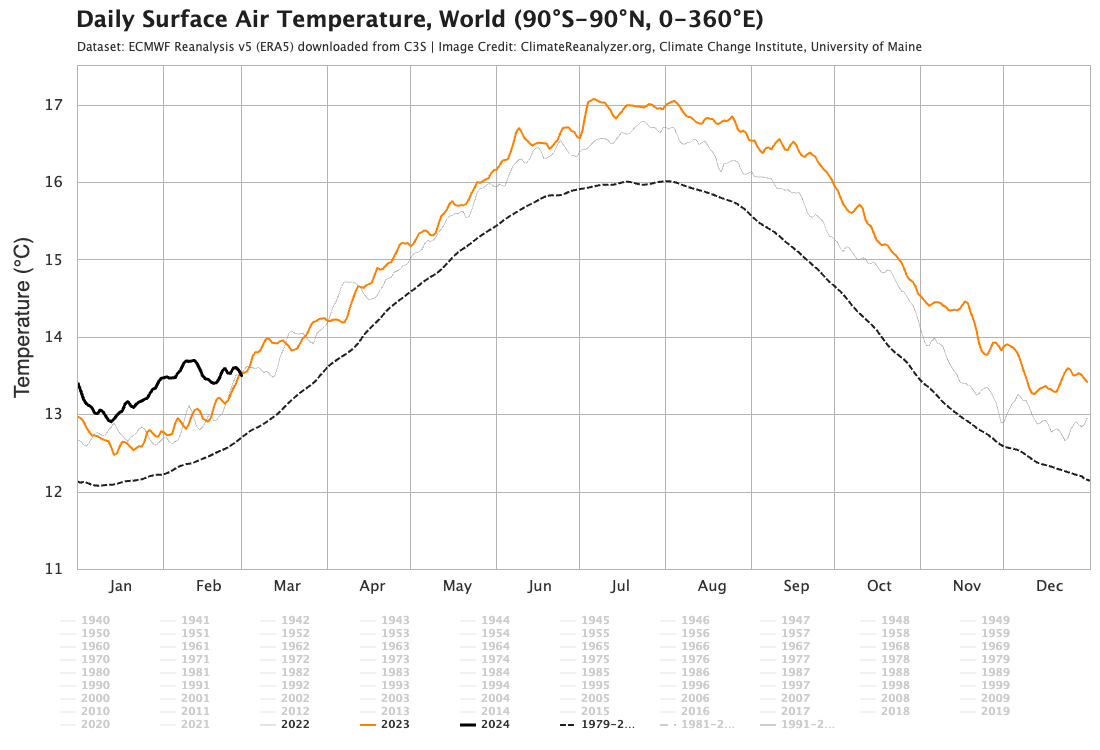
Ninth Record Breaking Month in a Row
https://climatereanalyzer.org/clim/t2_daily/?dm_id=world
And now, with less “spaghetti":
- Dashed line: 1979-2000 Average
- Gray line: 2022
- Orange line: 2023
- Black line: 2024
Projections of an ice-free Arctic Ocean
https://doi.org/10.1038/s43017-023-00515-9Projections of an ice-free Arctic Ocean
Alexandra Jahn, Marika M. Holland & Jennifer E. Kay
Nature Reviews Earth & Environment (2024)
Abstract
Observed Arctic sea ice losses are a sentinel of anthropogenic climate change. These reductions are projected to continue with ongoing warming, ultimately leading to an ice-free Arctic (sea ice area ﹤1 million km²). In this Review, we synthesize understanding of the timing and regional variability of such an ice-free Arctic. In the September monthly mean, the earliest ice-free conditions (the first single occurrence of an ice-free Arctic) could occur in 2020–2030s under all emission trajectories and are likely to occur by 2050. However, daily September ice-free conditions are expected approximately 4 years earlier on average, with the possibility of preceding monthly metrics by 10 years. Consistently ice-free September conditions (frequent occurrences of an ice-free Arctic) are anticipated by mid-century (by 2035–2067), with emission trajectories determining how often and for how long the Arctic could be ice free. Specifically, there is potential for ice-free conditions in May–January and August–October by 2100 under a high-emission and low-emission scenario, respectively. In all cases, sea ice losses begin in the European Arctic, proceed to the Pacific Arctic and end in the Central Arctic, if becoming ice free at all. Future research must assess the impact of model selection and recalibration on projections, and assess the drivers of internal variability that can cause early ice-free conditions.
…
https://www.democraticunderground.com/?com=view_post&forum=1127&pid=168542
James Hansen et al. Groundhog Day. Another Gobsmackingly Bananas Month. What's Up?
http://www.columbia.edu/~jeh1/mailings/2024/Groundhog.04January2024.pdf
Fig. 1. Daily surface temperature analysis from the ECMWF reanalysis version 5 (ERA5).¹
04 January 2024
James Hansen, Makiko Sato, Pushker Kharecha
Abstract. December was the 7th consecutive month of record-shattering global temperature, driven by the combination of a moderately strong El Nino and a large decrease of Earth’s albedo. The El Nino will fade in the next few months, but we anticipate that the string of record monthly temperatures will continue to a total of 12 and possibly 13 months because of Earth’s unprecedented energy imbalance. By May the 12-month running-mean global temperature relative to 1880-1920 should be +1.6-1.7°C and not fall below +1.4 ± 0.1°C during the next La Nina minimum. Thus, given the planetary energy imbalance, it will be clear that the 1.5°C ceiling has been passed for all practical purposes.
Zeke Hausfather memorably termed the record September global temperature as “gobsmackingly bananas.” Subsequent monthly temperature anomalies have not been much smaller. These records coincide with a moderately strong El Nino, but they exceed expectations for even the strongest El Nino, if that were the only driving factor. Warming is also being driven by another factor, one that
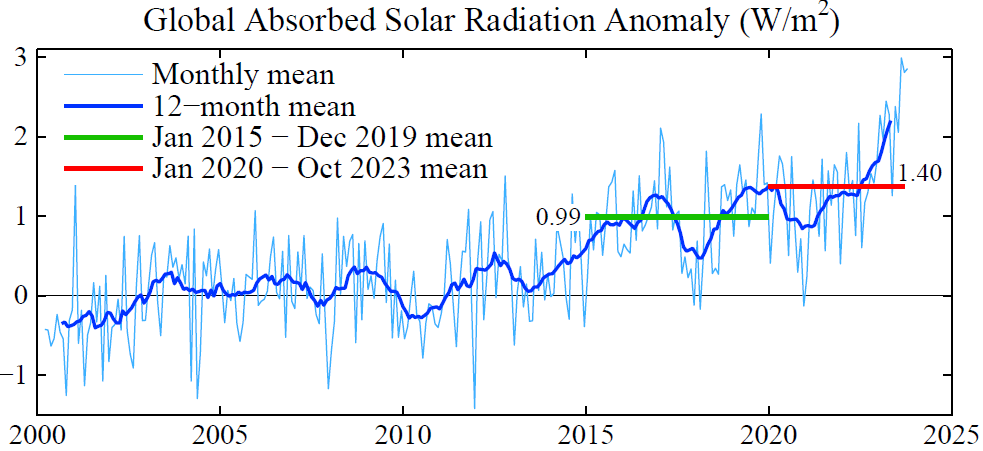
Fig. 2. Global absorbed solar radiation (W/m² ) relative to mean of the first 120 months of CERES data. CERES data² are available at http://ceres.larc.nasa.gov/
Fig. 3. 12-month running-mean of Earth’s energy imbalance from CERES satellite data normalized to 0.71 W/m² mean for July 2005 – June 2015 (blue bar) from in situ data.
is ultimately more consequential: a large decrease of Earth’s albedo. In other words, Earth has become darker, absorbing more of the sunlight incident on the planet (Fig. 2). The increase of absorbed solar radiation (1.4 W/m² ) is a decrease of Earth’s albedo (reflectivity) of 0.4% (1.4/340).³ This reduced albedo is equivalent to a sudden increase of atmospheric CO₂ from 420 to 530 ppm.
We conclude in our Pipeline paper⁴ that the decreased albedo is spurred by reduced atmospheric aerosols and enhanced by feedbacks. Given that NASA decided in the early 1990s⁵ not to make precise measurements of the global aerosol forcing and cloud feedbacks, we are faced with a difficult task of sorting out how much of the increased solar absorption is aerosol forcing and how much is from feedbacks. The two major feedbacks expected to darken Earth as the planet warms are reduced sea ice cover and reduced cloud cover. The recent spike of absorbed solar radiation to almost 3 W/m² (Fig. 2) may be related in part to the fact that it occurred during the season when solar insolation was rising in the region of Southern Hemisphere sea ice when sea ice cover was at its lowest point in the period of satellite data. Large variability of clouds, unforced and forced, complicates interpretation of anomalies, but spatial variations may help untangle the situation.
Feedbacks associated with ice melt are particularly important for reasons discussed in our Ice Melt paper⁶ (that’s the paper blackballed by IPCC because it disagrees with IPCC about the imminent threat of shutdown of the overturning ocean circulations and large sea level rise). We find in that paper that freshwater injection into the ocean mixed layer by melting polar ice is already a significant climate forcing that acts to slow down the production of deepwater in the North Atlantic and production of bottom water in the Southern Ocean.
…
¹ Daily Surface Air Temperature graph based on ERA5 available via Climate Reanalyzer, Climate Change Institute, University of Maine https://climatereanalyzer.org/wx/todays-weather/?var_id=t2&ortho=1&wt=1
² Loeb NG, Johnson GC, Thorsen, TJ et al. Satellite and ocean data reveal marked increase in Earth’s heating rate. Geophys Res Lett 2021;48:e2021GL09304
³ The average solar energy incident on Earth is about 340 W/m².
⁴ Hansen J, Sato M, Simons L et al. Global warming in the pipeline. Oxford Open Clim Chan 2023;3(1):kgad008, doi.org/10.1093/oxfclm/kgad008
⁵ Hansen J, Rosa W, Fung I. Long-term monitoring of global climate forcings and feedbacks. Washington: NASA Conference Publication 3234, 1993
⁶ Hansen J, Sato M, Hearty P et al. Ice melt, sea level rise and superstorms: evidence from paleoclimate data, climate modeling, and modern observations that 2 C global warming could be dangerous. Atmos Chem Phys2016;16:3761-812
…
NOVA: The Invisible Flame (BBC 1978)
This 1980 episode of the PBS science program NOVA introduces hydrogen as an alternative to petroleum and natural gas. They look at safety, generation, transportation (pipelines and trucks) storage and use. They show vehicles converted to use hydrogen, including a proposed passenger jet and a “hydrogen home” with a hydrogen stove and oven. They also show a home “electrolyzer” for refueling your hydrogen powered car.
Near the end they look at fuel cells, saying that they would be more efficient than using hydrogen in an internal combustion engine and introduce a possible, looming concern, CO₂ and the possibility that it might lead to problems in as little as 10 years (8 years later, James Hansen would give his famous congressional testimony.) A prediction is made that at that time, a global effort will be made to move away from the use of “fossil fuels.”
In my opinion, it’s a balanced presentation, and worthwhile viewing for hydrogen advocates and skeptics alike. The science really has not changed all that much in 40+ years.
https://archive.org/details/NOVATheInvisibleFlame
I notice that while NOVA ran this in 1980, the BBC credit at the end gives a date of 1978.
Profile Information
Gender: Do not displayHometown: New York State
Home country: United States of America
Member since: Mon Mar 6, 2006, 03:51 PM
Number of posts: 21,711
