Latest Breaking News
In reply to the discussion: Omicron now accounts for 73% of new coronavirus cases in the US, according to the CDC [View all]
BumRushDaShow
(172,716 posts)might be the fact that infections were never uniform over a fixed time period, both globally and domestically. In fact, an increasingly standard assumption has evolved that the U.S. infections from a new variant have occurred about "2 - 3 weeks after UK infections".
The pandemic has always been a bubbling cauldron where in a specific time range, a set of regions were hitting a peak of infection while other areas only had few or no confirmed cases.
As an extreme example, during the period when FL was peaking, a different large population states like NY, were at a lull, having come off their peak.
So the graph literally only shows the series of snapshots of total cases/deaths over time but is blending (smoothing) where they happened. I.e., this pandemic spread around the country (and world) in a non-uniform fashion. Early on in the pandemic in the U.S., your largest infections were happening in the northeast, and took time before hitting much of the rest of the country and you never had all of the states with large populations, simultaneously reaching a peak for cases, hospitalizations, or deaths at exactly the same time.
I expect it would be difficult to find time periods where there was some type of "synchronization" of peaks and valleys around the country.
I want to almost give an analogy like this -

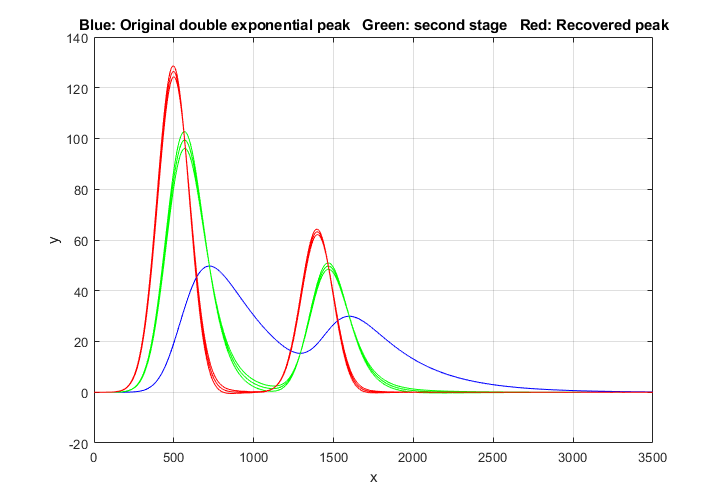
So for example if you made a graph with a series of distinct overlaid plots for each locale and label (on the plot vs on an axis) the peaks for cases, hospitalizations, and deaths, with the Y axis as totals and the X axis showing time, you will see the skew better. Sortof like this -
Using actual NYT data, you see the skew (shift) (the Y-scale is a bit different but shouldn't be too much of an issue with the below comparisons but I wish they had kept the scales the same or allowed the Y axis to be adjustable so you could see a truer "overall" comparison) -
TEXAS

NEW YORK

FLORIDA

Where NY had been at a "lull" around the July time period and gradually increased while TX and FL suddenly exploded. Similarly you will see the November time frame where FL came off a large summer peak where NY was already taking off again.
So using the generic chart that I manually annotated with a yellow (ball-parked free-draw) curve to average the red/green/blue curves, you see sortof that average shift of the max and time (and normally the green would probably be a good fit for an average of red & blue, the blue has such a long tail that it would skew the whole average including the green line, to the right)-

So when looking at "global" (or say "U.S." ) "peaks", that is nothing but an "average over time" of all the data and the skew would be enough to distort trying to calculate the timing between cases and hospitalizations and then between hospitalizations and deaths, since those time intervals are only measured in weeks and the "waves" have never been uniform.
Edit history
Recommendations
0 members have recommended this reply (displayed in chronological order): = new reply since forum marked as read
Highlight:
NoneDon't highlight anything
5 newestHighlight 5 most recent replies
RecommendedHighlight replies with 5 or more recommendations
= new reply since forum marked as read
Highlight:
NoneDon't highlight anything
5 newestHighlight 5 most recent replies
RecommendedHighlight replies with 5 or more recommendations